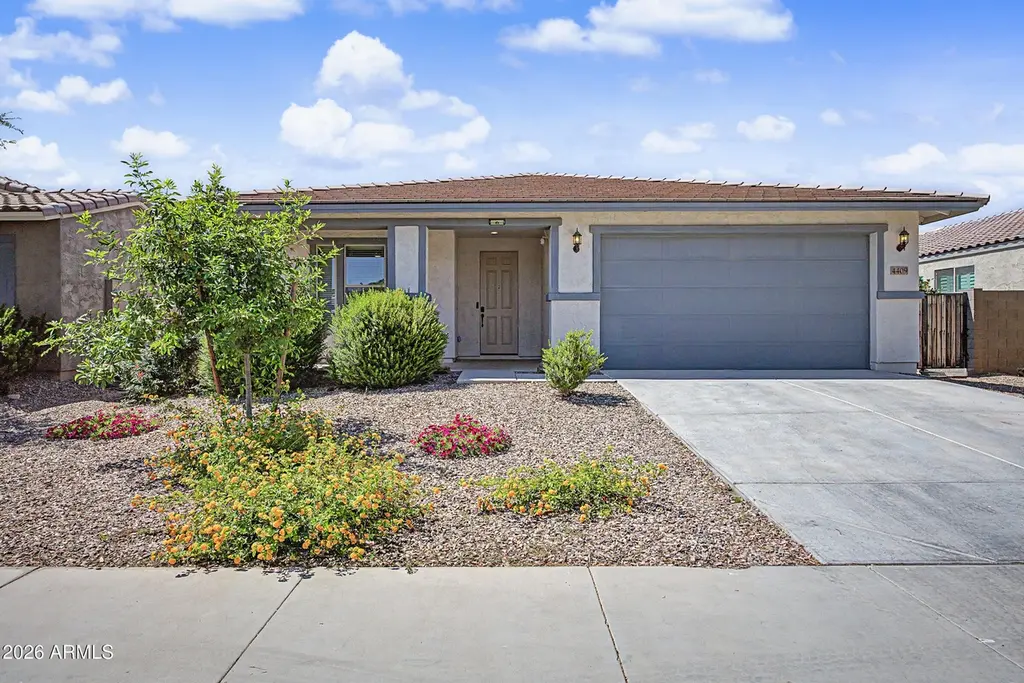
4409 W Vervain Ave · San Tan Valley, AZ
Flood risk 1/10 · Minimal
- FEMA flood zone
- X (unshaded)
- Chance of flooding over 30 yrs
- 0.0%
- Est. flood insurance / yr
- $507 – $1,088
Fire risk 5/10 · Moderate
- Est. fire insurance / yr
- $610 – $1,132
Heat risk 9/10 · Severe
- Hot days now (above 111°F)
- 7 days/yr
- Hot days in 30 yrs
- 19 days/yr
Wind risk 1/10 · Minimal
- Chance of severe wind over 30 yrs
- —
Air-quality risk 2/10 · Minimal
- Unhealthy air days now
- 1 days/yr
- Unhealthy air days in 30 yrs
- 1 days/yr
Risk factors via First Street. Map © Google.
Why this score? — see what drove the D grade
The composite is a weighted blend of 9 inputs, each scored 0–100. Each bar is that input's sub-score; the figure is the points it added to the 100-point composite (weight × sub-score).
- ARV discount +15.0/15.0
- Appreciation +10.0/10.0
- Cash flow +6.0/30.0
- Livability +2.7/5.0
- Rent growth +2.5/5.0
- Condition / age +2.5/5.0
- Schools +1.8/10.0
- 1% rule +0.4/10.0
- DSCR +0.4/10.0
$399,999
🖨 Deal sheet (PDF) 📄 Offer letter ✓ Due diligence
Listing remarks
Stunning Taylor Morrison Sterling Model | Built in 2019 | 1,958 Sq Ft | Flex Space | Move-In Ready Welcome to this beautifully designed Sterling model by Taylor Morrison, built in 2019 and offering 1,958 square feet of thoughtfully crafted living space. Combining modern design, energy-efficient construction, and everyday functionality, this immaculate single-story home is a rare opportunity for buyers seeking a move-in-ready home in one of the area's most desirable communities. From the moment you arrive, you'll appreciate the attractive curb appeal, contemporary architecture, and well-maintained exterior. Inside, the highly sought-after Sterling floor plan features an open-concept desig
Key facts
- Open concept living
- Gourmet kitchen
- Raised garden beds
Tags
Property features AI
Finance
- Financial info: Conventional financing available (non-assumable)
- HOA & community: Monthly association fee of $66 covering ground maintenance; Association rules restrict visible trucks, trailers, RVs, and boats; Community playground; Biking and walking paths
Exterior
- Parking: 2 covered garage spaces; 2 open parking spaces; Tandem garage with garage door opener
- Utilities: Private water company; Public sewer
- Home design: Single-family residence; Fee simple ownership
- Construction: Stucco and wood frame construction; Blown cellulose insulation; Painted exterior; Tile roof
- Exterior features: Storage; Block fencing; Sprinklers front and rear with automatic timers; Desert landscaping front and back; Synthetic grass in back; Mountain view
Interior
- Kitchen: Refrigerator; Dishwasher; Garbage disposal; Built-in microwave; Walk-in pantry; Kitchen island
- Bedrooms: 3 bedrooms
- Flooring: Carpet; Laminate
- Bathrooms: 3 full bathrooms
- Heating & cooling: Central air; Ceiling fans; Programmable thermostat; Natural gas heating; ENERGY STAR qualified heating and cooling equipment
- Interior features: High-speed internet; Granite counters; Double vanity in bathroom; Eat-in kitchen; No interior steps; Kitchen island; Full bathroom in primary bedroom; Low-emissivity dual-pane windows with vinyl frames
- Laundry & utility: Indoor laundry; Energy Star rated laundry features
Neighborhood map
What this means for you Summary
Snapshot
- This is a 3-bed/3.0-bath single-family listed at $400k.
Deal economics
- At list price, monthly cash flow is $-759 ($-9k/yr) — negative.
- To cash-flow at today's rent, offer at most $266k (33.5% below list).
- To meet the 1% rule (rent ≥ 1% of price), the offer needs to be $215k (46.1% below list).
- Recommended offer: $215k (46.1% below list) — sets the bar for 1% rule.
- Cap rate 4.0% vs local median 3.2% in San Tan Valley — meaningfully above typical; check what's discounted (condition, days-on-market, listing class) to confirm the premium yield is real.
Location & tenants
- Location reads 54/100 on livability (#282 in AZ) — a working-class tenant base; expect higher turnover. Strengths: housing A+, employment B+; Watch: crime D+, schools D, amenities F.
- Florence Unified School District (4437) (rural): math 16% / reading 24% proficiency, ranked #178 of 249 in AZ (top 72%) — low school quality limits family demand, transient renter base, plan for 1-2y turnover.
- Market conditions: 488 active listings in the ZIP; 40 comparable units currently listed for rent nearby; rentals at typical pace (median 16d on market — plan ~3-4 weeks tenant-placement turnaround); 9,504 units permitted in Pinal County in 2024 (776 in 5+ unit buildings).
Forward outlook
- In year one you build about $43k of equity ($3k loan paydown + $40k appreciation (10.0% local appreciation)).
- By year 2, paydown + projected appreciation supports a ~$69k cash-out refi (75% LTV) — recoverable capital for the next deal without selling this one.
Negotiation context
- Only 5 days on market — expect competitive offers; lowballing is unlikely to land.
Risks & watch-outs
- Climate carrying-cost: moderate wildfire risk; extreme-heat days projected 7→19/yr by 2055 (HVAC capex compounding) — expect insurance premiums to compound above CPI over the hold.
Questions for the listing agent
- What do current leases actually rent for vs. the listed asking? Can we see a recent rent roll and the last 12 months of T-12 income?
- What does the HOA fee cover, when was the last increase, and are there any pending special assessments or reserve-fund shortfalls?
- Is there a deadline driving the sale (1031 exchange, divorce, estate, relocation)? That informs how much negotiation room exists.
- Schools are D-rated, which usually means shorter tenancies and higher turnover. Who's the typical renter profile here, and what's been the actual vacancy rate?
- Crime grade is D in this area — have there been break-ins, vandalism, or insurance claims at this property in the last 3 years? What carrier currently insures it and at what premium?
- The area grade is low — what's the realistic commute time and amenity access for the typical tenant pool here? Any planned neighborhood developments (good or bad) we should know about?
- What's the average days-on-market for RENTAL listings here right now (not sales)? A rising rental-DOM trend means longer vacancies and softer asking-rent achievability than the comps imply.
- What's the recent tenant-quality profile in this submarket — average credit score on applications, eviction rate, late-payment / NSF rate, and stable-employment percentage? A property-management company in the area should have these aggregated.
- How much new for-sale + rental construction is in the pipeline within 1–3 miles? Heavy new supply typically softens prices + rents 12–24 months out; constrained supply supports both.
Investment metrics
- 1% rule
- 0.54% ✗
- Cap rate
- 4.02%
- Cash-on-cash
- -8.13%
- DSCR
- 0.64
- GRM
- 15.5
CMA / ARV
- ARV (median comp)
- $480,037
- List price
- $399,999
- Delta
- -14.59%
- Verdict
- UNDERPRICED
- Comps
- 20 within 1.0 mi
Show comp detail 12 sales within ~0.75 mi
| Address | Dist | Beds/Ba | Sqft | Sold | Price | $/sf | Match |
|---|---|---|---|---|---|---|---|
| 4390 W Kirkland Ave | 0.16mi | 3/2.5 | 1,973 (+0%) | 1mo | $365,000 | $185 | 89 |
| 33964 N Rockflower Trl | 0.17mi | 4/3.0 (+1) | 1,967 (+0%) | 1mo | $430,000 | $219 | 86 |
| 4448 W Stickleaf Way | 0.19mi | 4/3.0 (+1) | 2,007 (+2%) | 0mo | $450,000 | $224 | 83 |
| 33915 N Blue Curl Ln | 0.18mi | 4/3.0 (+1) | 2,026 (+3%) | 0mo | $435,000 | $215 | 81 |
| 4456 W Pelotazo Way | 0.04mi | 4/3.0 (+1) | 2,123 (+8%) | 1mo | $435,000 | $205 | 79 |
| 4268 W Dayflower Dr | 0.17mi | 3/2.0 | 2,116 (+8%) | 1mo | $514,300 | $243 | 74 |
| 33421 N Bowles Dr | 0.34mi | 3/2.0 | 1,871 (-5%) | 1mo | $372,500 | $199 | 72 |
| 4071 W White Canyon Rd | 0.44mi | 4/2.5 (+1) | 1,913 (-3%) | 1mo | $389,000 | $203 | 67 |
| 4548 W Sweetbush Way | 0.36mi | 4/2.0 (+1) | 1,819 (-7%) | 0mo | $435,000 | $239 | 62 |
| 4164 W Suncup Dr | 0.41mi | 4/2.0 (+1) | 1,819 (-7%) | 1mo | $567,000 | $312 | 59 |
| 4017 W Brenley Dr | 0.56mi | 3/2.0 | 1,837 (-6%) | 1mo | $455,000 | $248 | 58 |
| 4447 W Mountain Laural Dr | 0.69mi | 3/2.0 | 1,735 (-12%) | 0mo | $395,000 | $228 | 44 |
Match score weights: distance 35% · size 25% · config 20% · recency 20%. Top-matched comps best support the ARV.
Projected returns pro-forma
10.0% appreciation · 3.0% rent growth · sell at horizon
- IRR
- 18.5%
- Equity multiple
- 2.51×
- Total profit
- $169,376
- Equity at exit
- $360,351
- IRR
- 17.2%
- Equity multiple
- 5.79×
- Total profit
- $536,477
- Equity at exit
- $777,110
Cash invested: $112,000 (down + closing). Projections, not guarantees.
Landlord ↔ Tenant lean methodology
- Overall (STATE)
- 87 Strongly Landlord-Friendly
- State Arizona
- 87 Strongly Landlord-Friendly · R+3
- County
- — inherits STATE
- City
- — inherits STATE
ZIP-level market 85144
- Home prices YoY
- 7.2%
- Active inventory
- 488
- Price-to-rent
- 15.5×
Monthly cashflow live
- Estimated rent
- $2,155 high interval (Pro) →
- Mortgage (P&I)
- −$2,098
- Tax from tax record
- −$134 /mo · $1,614/yr
- Insurance
- −$167
- HOA
- −$62
- Vacancy / Maint / Mgmt
- −$452
- Net cashflow
- $-759
Break-even live
Sensitivity live
| Price | -10% $-532 | -5% $-645 | +0% $-759 | +5% $-872 | +10% $-985 |
|---|---|---|---|---|---|
| Rent | -10% $-929 | -5% $-844 | +0% $-759 | +5% $-674 | +10% $-588 |
| Rate | -1.0pp $-557 | -0.5pp $-657 | base $-759 | +0.5pp $-862 | +1.0pp $-968 |
UW: 25.0% down · 7.5% · 30yr · 1.5% tax · 5.0% vac · 8.0% maint · 8.0% mgmt
Financing live
Cash to close
- Down payment
- $100,000
- Closing costs
- $12,000
- Reserves months
- —
- Total cash needed
- —
Loan-product check · same deal, 3 products live
Conventional
25% down · 7.5% · 30yr
- Down + closing
- —
- Monthly P&I
- —
- Monthly cashflow
- —
- DSCR
- —
- Eligible?
- —
Personal DTI + credit; lowest rate.
DSCR
20% down · 8.5% · 30yr
- Down + closing
- —
- Monthly P&I
- —
- Monthly cashflow
- —
- DSCR
- —
- Eligible?
- —
No personal income docs; deal must DSCR.
Hard money
10% down · 12.0% · 12mo
- Down + closing
- —
- Monthly P&I
- —
- Monthly cashflow
- —
- DSCR
- —
- Eligible?
- —
Short-term bridge; refi at stabilization.
Rent comps 40 comps
| Address | Beds | Baths | Sqft | Rent | $/sqft | DOM | Units | Dist |
|---|---|---|---|---|---|---|---|---|
| 4251 W Dayflower Dr San Tan Valley, AZ | 4.0 | 3.0 | 2563 | $2,490 | $0.97 | 6d | 1 | 0.11mi |
| 4590 W Foldwing DR Queen Creek, AZ | 4.0 | 2.0 | 1806 | $2,449 | $1.36 | 4d | 1 | 0.18mi |
| 33948 N Beeblossom Trl San Tan Valley, AZ | 3.0 | 2.0 | 1348 | $1,850 | $1.37 | 18d | 1 | 0.26mi |
| 4504 W Stonecrop Dr San Tan Valley, AZ | 4.0 | 2.0 | 1810 | $2,075 | $1.15 | 6d | 1 | 0.27mi |
| 33810 N Mercedes Dr San Tan Valley, AZ | 4.0 | 2.0 | 1504 | $1,925 | $1.28 | 45d | 1 | 0.31mi |
| 3854 W Carlos Ln San Tan Valley, AZ | 3.0 | 2.0 | 1527 | $1,775 | $1.16 | 0d | 1 | 0.35mi |
| 3809 W Five Mile Peak Dr San Tan Valley, AZ | 3.0 | 2.0 | 1343 | $1,895 | $1.41 | 6d | 1 | 0.36mi |
| 3792 W Santa Cruz Ave San Tan Valley, AZ | 4.0 | 2.0 | 1852 | $1,795 | $0.97 | 45d | 1 | 0.39mi |
| 3877 W Naomi Ln San Tan Valley, AZ | 4.0 | 2.5 | 2010 | $1,850 | $0.92 | 6d | 1 | 0.42mi |
| 3846 W Morgan Ln San Tan Valley, AZ | 3.0 | 3.0 | 2422 | $1,949 | $0.80 | 25d | 1 | 0.49mi |
| 33889 N Barbara Dr San Tan Valley, AZ | 4.0 | 2.0 | 1868 | $1,975 | $1.06 | 6d | 1 | 0.52mi |
| 34113 N Alison Dr San Tan Valley, AZ | 4.0 | 3.0 | 2423 | $2,089 | $0.86 | 4d | 1 | 0.53mi |
| 3849 W South Butte Rd San Tan Valley, AZ | 4.0 | 2.0 | 1884 | $1,846 | $0.98 | 45d | 1 | 0.58mi |
| 3560 W Mesquite Ave San Tan Valley, AZ | 3.0 | 2.0 | 1453 | $1,750 | $1.20 | 12d | 1 | 0.60mi |
| 3569 W Morgan Ln San Tan Valley, AZ | 4.0 | 2.0 | 1700 | $1,550 | $0.91 | 25d | 1 | 0.61mi |
| 3369 W Yellow Peak Dr San Tan Valley, AZ | 4.0 | 2.5 | 2617 | $2,715 | $1.04 | 0d | 1 | 0.62mi |
| 33993 N Danja Dr San Tan Valley, AZ | 3.0 | 2.0 | 1998 | $2,450 | $1.23 | 45d | 1 | 0.63mi |
| 33024 N Madison Way Dr San Tan Valley, AZ | 3.0 | 2.0 | 1500 | $1,700 | $1.13 | 16d | 1 | 0.70mi |
| 3194 W Yellow Peak Dr San Tan Valley, AZ | 4.0 | 2.0 | 1925 | $1,908 | $0.99 | 45d | 1 | 0.73mi |
| 3162 W Sunshine Butte Dr San Tan Valley, AZ | 4.0 | 2.0 | 1600 | $1,850 | $1.16 | 23d | 1 | 0.80mi |
| 35155 N Thompson Rd San Tan Valley, AZ | 1.0–2.0 | 1.0–2.5 | 1000 | $2,320 | $2.32 | 0d | 1 | 0.80mi |
| 3102 W Belle Ave San Tan Valley, AZ | 4.0 | 2.0 | 1909 | $1,900 | $1.00 | 14d | 1 | 0.81mi |
| 3102 W Belle Ave San Tan Valley, AZ | 4.0 | 2.0 | 1909 | $1,900 | $1.00 | 16d | 1 | 0.81mi |
| 3541 Dreamy Draw Dr Queen Creek, AZ | 4.0 | 2.5 | 1918 | $2,700 | $1.41 | 25d | 1 | 0.83mi |
| 3047 W Dancer Ln San Tan Valley, AZ | 3.0 | 2.0 | 1454 | $1,915 | $1.32 | 45d | 1 | 0.85mi |
| 3439 W Oil Well Rd San Tan Valley, AZ | 3.0 | 2.0 | 1595 | $2,500 | $1.57 | 45d | 1 | 0.88mi |
| 2993 W Dancer Ln San Tan Valley, AZ | 3.0 | 2.0 | 1290 | $1,700 | $1.32 | 45d | 1 | 0.88mi |
| 34973 N Augite Way San Tan Valley, AZ | 4.0 | 2.5 | 2614 | $4,350 | $1.66 | 0d | 1 | 0.90mi |
| 33897 N Wash View Rd San Tan Valley, AZ | 3.0 | 2.0 | 1721 | $1,980 | $1.15 | 4d | 1 | 0.92mi |
| 2924 W Allens Peak Dr San Tan Valley, AZ | 3.0 | 2.0 | 1765 | $1,860 | $1.05 | 0d | 1 | 0.92mi |
| 2924 W Allens Peak Dr San Tan Valley, AZ | 3.0 | 2.0 | 1765 | $1,955 | $1.11 | 12d | 1 | 0.92mi |
| 35032 N Barrel Rd San Tan Valley, AZ | 3.0 | 2.5 | 2213 | $3,900 | $1.76 | 0d | 1 | 0.92mi |
| 33856 N Cherry Creek Rd San Tan Valley, AZ | 3.0 | 2.0 | 1928 | $1,850 | $0.96 | 45d | 1 | 0.93mi |
| 4165 W Monika Ln San Tan Valley, AZ | 4.0 | 3.0 | 2049 | $2,450 | $1.20 | 45d | 1 | 1.02mi |
| 2899 W White Canyon Rd San Tan Valley, AZ | 3.0 | 2.0 | 1981 | $1,950 | $0.98 | 4d | 1 | 1.03mi |
| 2699 W Camp River Rd San Tan Valley, AZ | 3.0 | 2.0 | 1766 | $1,975 | $1.12 | 45d | 1 | 1.05mi |
| 2828 Patagonia Ct Queen Creek, AZ | 3.0 | 2.5 | 2230 | $2,500 | $1.12 | 45d | 1 | 1.06mi |
| 4001 W Brass Ln San Tan Valley, AZ | 4.0 | 2.5 | 2432 | $2,750 | $1.13 | 45d | 1 | 1.12mi |
| 4565 W Hunter Trl San Tan Valley, AZ | 4.0 | 3.0 | 2049 | $2,370 | $1.16 | 0d | 1 | 1.13mi |
| 4287 W Jeanette Ln San Tan Valley, AZ | 4.0 | 3.0 | 2049 | $2,450 | $1.20 | 19d | 1 | 1.17mi |
HOA detail
- Monthly dues
- $62 · $744/yr
Listing history 10 events
-
2026-06-21pricestatusdays on market $399,999 Coming Soon 5 DOM
-
2026-06-09days on market $410,000 Active 29 DOM
-
2026-06-08days on market $410,000 Active 28 DOM
-
2026-06-07pricedays on market $410,000 Active 27 DOM
-
2026-06-04days on market $419,000 Active 24 DOM
-
2026-06-03days on market $419,000 Active 23 DOM
-
2026-06-02days on market $419,000 Active 22 DOM
-
2026-06-01days on market $419,000 Active 21 DOM
-
2026-05-31days on market $419,000 Active 20 DOM
-
2026-05-11$425,000 Active 2197-char remark
ⓘ Source: listings_history table (triggers on properties + properties_extension) + one-shot
backfill from property_details.listing_events for pre-trigger history.
Tax reassessment forecast AZ · Resets to sale price
- Current annual tax
- $1,614 · $134/mo
- Projected year-2 tax
- $2,640 · $220/mo
- Expected delta
- +$1,026/yr (+$86/mo · 63.6%)
ⓘ Screening estimate from a state-policy table — verify with the county assessor before closing.
Climate risk First Street
- Flood 1/10 Low FEMA zone X (unshaded) · 0% chance over 30 yrs
- Wildfire 5/10 Major
- Heat 9/10 Extreme 7 d/yr ≥111°F today · 19 d/yr by 30 yrs out
- Wind 1/10 Low
- Air quality 2/10 Low 1 unhealthy d/yr today · 1 by 30 yrs out
Nearby sold comps map
Loading sold comps map…
Walkable amenities ~0.75 mi
Loading nearby amenities…
Taxation est. · year 1
- Rental income
- $25,855
- − Mortgage interest
- −$22,406
- − Property taxes
- −$1,614
- − Insurance
- −$2,000
- − Repairs & maintenance
- −$2,068
- − Management
- −$2,068
- − HOA
- −$744
- − Depreciation
- −$11,636
- Taxable loss
- −$16,682
- Est. tax savings @ 24.0%
- +$4,004
- After-tax cash flow
- $-5,100/yr
For passive investors: Depreciation is non-cash, so a rental often shows a tax loss while cash-flowing — sheltering income. Rental losses are passive: they offset passive income freely, and up to $25,000/yr can offset ordinary (W-2) income if you actively participate and your MAGI is under $100k (phasing out to $0 by $150k); unused losses carry forward. On sale, claimed depreciation is recaptured at up to 25%, and gains may owe capital-gains tax (a 1031 exchange can defer both). Figures are a year-1 estimate at your 24.0% rate — not tax advice; consult a CPA.
Schools (NCES district)
- District
- Florence Unified School District (4437)
- NCES district ID
- 0402920
- Math proficiency
- 16% ▼ -11.00%
- Reading proficiency
- 24% ▼ -7.00%
- Median HH income
- $54,426
- Composite
- 18.31/100
- National rank
- #8950
- State rank
- #178 of 249 in AZ
Livability — San Tan Valley
- Score
- 54/100
- State rank
- #282
- US rank
- #24192
Category grades
Schools grade is shown separately in the Schools card above.
Census & demographics
- Census place
- San Tan Valley, AZ
Population outlook (Pinal County) Hauer SSP2
- Today (2025)
- 437,574 people
- By 2030
- 446,903 · +2.1%
- By 2040
- 452,589 · +3.4%
- By 2050
- 444,126 · +1.5%
- By 2075
- 430,300 · -1.7%
- By 2100
- 393,536 · -10.1%
Not yet ingested
- Political lean
- —
- Race & ethnicity
- —
- Common origin
- —
- Civics
- —
Market trends
- HPI YoY
- ▲ 24.94%
- Current HPI
- 372.52
- Rent YoY
- —
- Metro
- —
- State GDP YoY
- ▲ 4.54%
- F500 in state
- 20
Industry mix (Fortune 500 HQ in AZ)
| Industry | F500 HQs | Revenue |
|---|---|---|
| Technology | 2 | $13B |
|
||
| Mining / Metals | 1 | $23B |
|
||
| Environmental Services | 1 | $16B |
|
||
| Metals / Steel | 1 | $14B |
|
||
| Technology Distribution | 1 | $9B |
|
||
| Homebuilding | 1 | $8B |
|
||
Price history
-3.5% since first listed4 events — show timeline
- 2026-06-09 Listing Removed — ARMLS
- 2026-06-04 Price Changed $410,000 ARMLS
- 2026-05-29 Price Changed $419,000 ARMLS
- 2026-05-11 Listed $425,000 ARMLS
Property tax history
+47.8%/yrLatest (2025): $1,614 · +2.0% YoY. Source: county tax records.
Cash-flow waterfall
monthlySold comps — $/sqft
last 12 mo · ≤1 miLoading sold comps…