6 Laverne Ln · Chardon, OH
Flood risk 1/10 · Minimal
- FEMA flood zone
- X (unshaded)
- Chance of flooding over 30 yrs
- 0.0%
- Est. flood insurance / yr
- $473 – $860
Fire risk 1/10 · Minimal
- Est. fire insurance / yr
- $713 – $1,323
Heat risk 2/10 · Minimal
- Hot days now (above 95°F)
- 7 days/yr
- Hot days in 30 yrs
- 16 days/yr
Wind risk 1/10 · Minimal
- Chance of severe wind over 30 yrs
- —
Air-quality risk 4/10 · Minor
- Unhealthy air days now
- 3 days/yr
- Unhealthy air days in 30 yrs
- 6 days/yr
Risk factors via First Street. Map © Google.
Why this score? — see what drove the B grade
The composite is a weighted blend of 9 inputs, each scored 0–100. Each bar is that input's sub-score; the figure is the points it added to the 100-point composite (weight × sub-score).
- Cash flow +30.0/30.0
- 1% rule +10.0/10.0
- DSCR +10.0/10.0
- ARV discount +7.5/15.0
- Schools +6.8/10.0
- Livability +4.4/5.0
- Rent growth +2.5/5.0
- Condition / age +2.5/5.0
- Appreciation +0.0/10.0
$46,000
🖨 Deal sheet 📄 Offer letter ✓ Due diligence
Listing remarks
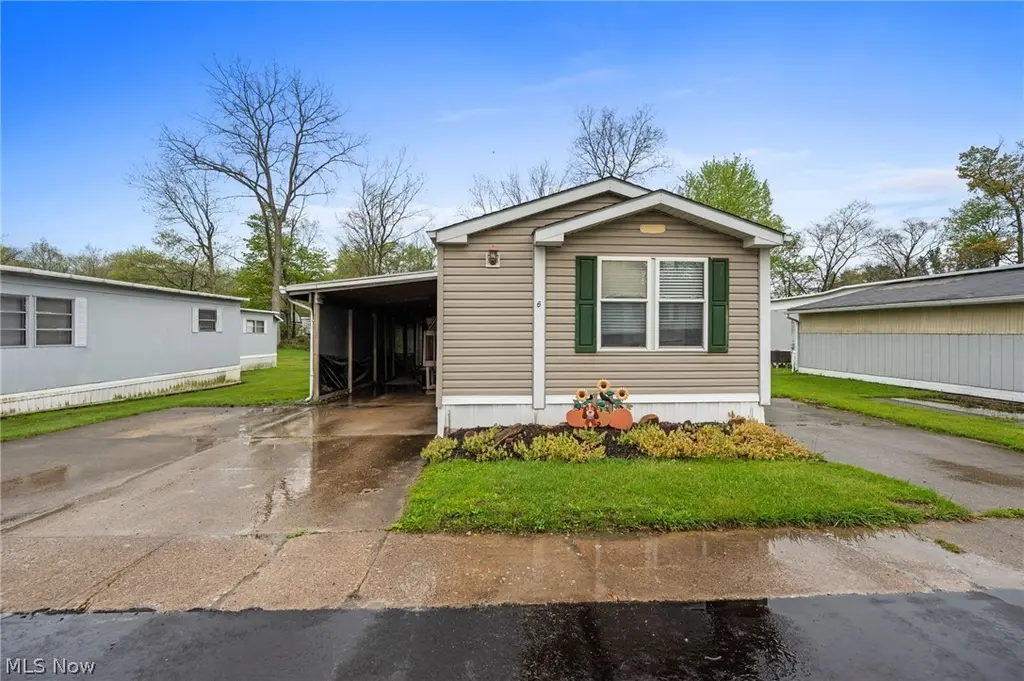
Move right into this beautiful, neutral 3 bedroom / 2 full bathroom manufactured home in the Chardon Estates Mobile Home Park community! The home has a covered carport as well as an additional parking space. Inside, the living room is open to the spacious kitchen with dining area. All appliances are included with your purchase. The laundry area has a newer stack-able washer/dryer unit. A split floor plan offers an ideal layout. The large primary has a bathroom en suite, including a soaking tub and separate shower. The two secondary bedrooms are bright and neutral and share a full bath. Outside, there is a shed for additional storage and a nice yard space overlooking the community pond. This
Key facts
- Open living room
- Laundry area
- Covered carport
Tags
Property features AI
Finance
- Other: Above-grade finished area reported as 1,728 (per public records)
- Financial info: Property has a land lease with a monthly amount
- HOA & community: Homeowners association (Chardon Estates) with monthly fee
Exterior
- Parking: Covered carport; One carport space
- Utilities: Private water; Private sewer
- Home design: Single-story home; Vinyl siding exterior; Asphalt shingle roof
- Construction: Vinyl siding construction; Asphalt shingle roof; Built according to public records
- Exterior features: Covered side porch; Shed(s)
Interior
- Kitchen: Dishwasher; Range; Microwave; Refrigerator
- Bedrooms: Three main-level bedrooms
- Bathrooms: Two full bathrooms on the main level
- Heating & cooling: Forced air heating (electric); Central air conditioning
- Interior features: Single-story layout
- Laundry & utility: Washer hookup on main level; Electric dryer hookup; Washer and Dryer included
Neighborhood map
What this means for you Summary
Snapshot
- This is a 3-bed/2.0-bath manufactured listed at $46k.
Deal economics
- At list price, monthly cash flow is $1k ($13k/yr) — positive.
- The deal already cash-flows at list — no discount required.
- Meets the 1% rule at list price ($2k rent vs $46k).
- Cap rate 33.5% vs local median 2.3% in Chardon — top-decile yield for the area; either an underpriced asset or a hidden risk that comps aren't pricing in. Stress-test before assuming the spread holds.
Location & tenants
- Location reads 87/100 on livability (#33 in OH, #318 nationally) — a professional / high-income tenant draw. Strengths: schools A+, crime A+, cost of living A+; Watch: commute F.
- Chardon Local (town): math 78% / reading 79% proficiency, ranked #56 of 656 in OH (top 8%) — strong family-tenant draw, lease renewals of 3-5y typical; only 14% free/reduced lunch — higher-income household profile.
- Market conditions: 79 active listings in the ZIP; solid renter incomes; 220 units permitted in Geauga County in 2024 (0 in 5+ unit buildings).
Forward outlook
- Local home prices are declining (-3.0%/yr); year-one equity from $318 of loan paydown is wiped out by about $1k of value loss. Plan a longer hold.
- Geauga County population projected to shrink 7% by 2050 — rents likely to lag national; underwrite the cash flow, not the appreciation.
- At projected returns (-3.0% appreciation + 3.0% rent growth), your $13k cash investment doubles in ~2 years — after that, you're playing with house money.
Negotiation context
- Only 4 days on market — expect competitive offers; lowballing is unlikely to land.
Questions for the listing agent
- Is there a deadline driving the sale (1031 exchange, divorce, estate, relocation)? That informs how much negotiation room exists.
- Schools are A-rated — typically a magnet for longer-tenancy family renters. What's the average tenant stay here, and is there a school-zone premium baked into asking?
- What's the average days-on-market for RENTAL listings here right now (not sales)? A rising rental-DOM trend means longer vacancies and softer asking-rent achievability than the comps imply.
- What's the recent tenant-quality profile in this submarket — average credit score on applications, eviction rate, late-payment / NSF rate, and stable-employment percentage? A property-management company in the area should have these aggregated.
- How much new for-sale + rental construction is in the pipeline within 1–3 miles? Heavy new supply typically softens prices + rents 12–24 months out; constrained supply supports both.
Investment metrics
- 1% rule
- 3.75% ✓
- Cap rate
- 33.54%
- Cash-on-cash
- 97.31%
- DSCR
- 5.33
- GRM
- 2.2
CMA / ARV
No comps found within radius.
Projected returns pro-forma
-3.0% appreciation · 3.0% rent growth · sell at horizon
- IRR
- 98.3%
- Equity multiple
- 5.59×
- Total profit
- $59,097
- Equity at exit
- $6,859
- IRR
- —
- Equity multiple
- 11.65×
- Total profit
- $137,227
- Equity at exit
- $3,977
Cash invested: $12,880 (down + closing). Projections, not guarantees.
Landlord ↔ Tenant lean methodology
- Overall (STATE)
- 73 Landlord-Friendly
- State Ohio
- 73 Landlord-Friendly · R+6
- County
- — inherits STATE
- City
- — inherits STATE
ZIP-level market 44024
- Active inventory
- 79
- Price-to-rent
- 2.2×
Monthly cashflow live
- Estimated rent
- $1,725 medium interval (Pro) →
- Mortgage (P&I)
- −$241
- Tax est. 1.5%
- −$58 /mo · $690/yr
- Insurance
- −$19
- HOA
- −$0
- Vacancy / Maint / Mgmt
- −$362
- Net cashflow
- $1,044
Break-even live
UW: 25.0% down · 7.5% · 30yr · 1.5% tax · 5.0% vac · 8.0% maint · 8.0% mgmt
Financing live
Cash to close
- Down payment
- $11,500
- Closing costs
- $1,380
- Reserves months
- —
- Total cash needed
- —
Loan-product check · same deal, 3 products live
Conventional
25% down · 7.5% · 30yr
- Down + closing
- —
- Monthly P&I
- —
- Monthly cashflow
- —
- DSCR
- —
- Eligible?
- —
Personal DTI + credit; lowest rate.
DSCR
20% down · 8.5% · 30yr
- Down + closing
- —
- Monthly P&I
- —
- Monthly cashflow
- —
- DSCR
- —
- Eligible?
- —
No personal income docs; deal must DSCR.
Hard money
10% down · 12.0% · 12mo
- Down + closing
- —
- Monthly P&I
- —
- Monthly cashflow
- —
- DSCR
- —
- Eligible?
- —
Short-term bridge; refi at stabilization.
Listing history 2 events
-
2026-05-06status Pending 775-char remark
-
2026-04-30$46,000 Active 775-char remark
ⓘ Source: listings_history table (triggers on properties + properties_extension) + one-shot
backfill from property_details.listing_events for pre-trigger history.
Climate risk First Street
- Flood 1/10 Low FEMA zone X (unshaded) · 0% chance over 30 yrs
- Wildfire 1/10 Low
- Heat 2/10 Low 7 d/yr ≥95°F today · 16 d/yr by 30 yrs out
- Wind 1/10 Low
- Air quality 4/10 Moderate 3 unhealthy d/yr today · 6 by 30 yrs out
Nearby sold comps map
Loading sold comps map…
Walkable amenities ~0.75 mi
Loading nearby amenities…
Taxation est. · year 1
- Rental income
- $20,695
- − Mortgage interest
- −$2,577
- − Property taxes
- −$690
- − Insurance
- −$230
- − Repairs & maintenance
- −$1,656
- − Management
- −$1,656
- − Depreciation
- −$1,338
- Taxable income
- $12,549
- Est. tax owed @ 24.0%
- −$3,012
- After-tax cash flow
- $9,522/yr
For passive investors: Depreciation is non-cash, so a rental often shows a tax loss while cash-flowing — sheltering income. Rental losses are passive: they offset passive income freely, and up to $25,000/yr can offset ordinary (W-2) income if you actively participate and your MAGI is under $100k (phasing out to $0 by $150k); unused losses carry forward. On sale, claimed depreciation is recaptured at up to 25%, and gains may owe capital-gains tax (a 1031 exchange can defer both). Figures are a year-1 estimate at your 24.0% rate — not tax advice; consult a CPA.
Schools (NCES district)
- District
- Chardon Local
- NCES district ID
- 3904718
- Math proficiency
- 78% ▼ -6.00%
- Reading proficiency
- 79% ▼ -5.00%
- Median HH income
- $68,705
- Composite
- 68.2/100
- National rank
- #352
- State rank
- #56 of 656 in OH
Livability — Chardon
- Score
- 87/100
- State rank
- #33
- US rank
- #318
Category grades
Schools grade is shown separately in the Schools card above.
Census & demographics
- County
- Geauga · 90,510 people
- City population
- 24,376
- Metro
- Cleveland, OH
- Population (ZIP)
- 24,376
- Household income
- $104,808
- Rent vs Own
- Severe rent burden
- 5.6
Population outlook (Geauga County) Hauer SSP2
- Today (2025)
- 94,919 people
- By 2030
- 94,804 · -0.1%
- By 2040
- 92,641 · -2.4%
- By 2050
- 88,198 · -7.1%
- By 2075
- 79,080 · -16.7%
- By 2100
- 60,856 · -35.9%
Race, ethnicity, and origin ACS 2023
- Neighborhood character
- Predominantly White (92%)
- Race & ethnicity
- White 92% Two or more races 5% Hispanic / Latino 3%
- Common ancestry
- Romanian 8% Slovak 2% Italian 1%
- Foreign-born
- 2% · Canada
- Languages at home
- 96% English-only · Spanish 1% German/W. Germanic 1% Russian/Polish/Slavic 1%
Political lean MEDSL · Geauga
- 2024 margin
- Strong R (+24.1) · D 37.5% · R 61.7%
- 2008→2024 swing
- -8.8pp toward R · 2008: -15.4pp · 2024: -24.1pp
- All cycles
- 2024: R+24.1 2020: R+23.1 2016: R+25.5 2012: R+21.6 2008: R+15.4
Not yet ingested
- Civics
- —
Market trends
- HPI YoY
- ▼ -193.59%
- Current HPI
- 205.447
- Rent YoY
- —
- Metro
- —
- State GDP YoY
- ▲ 1.98%
- F500 in state
- 48
Industry mix (Fortune 500 HQ in OH)
| Industry | F500 HQs | Revenue |
|---|---|---|
| Insurance | 3 | $145B |
|
||
| Industrial Machinery | 3 | $49B |
|
||
| Financial Services | 3 | $24B |
|
||
| Consumer Goods | 2 | $93B |
|
||
| Aerospace / Defense | 2 | $47B |
|
||
| Utilities | 2 | $33B |
|
||
Price history
+2.2% since first listed3 events — show timeline
- 2026-05-26 Sold (MLS) $47,000 MLSNOW
- 2026-05-06 Pending — MLSNOW
- 2026-04-30 Listed $46,000 MLSNOW
Cash-flow waterfall
monthlySold comps — $/sqft
last 12 mo · ≤1 miLoading sold comps…