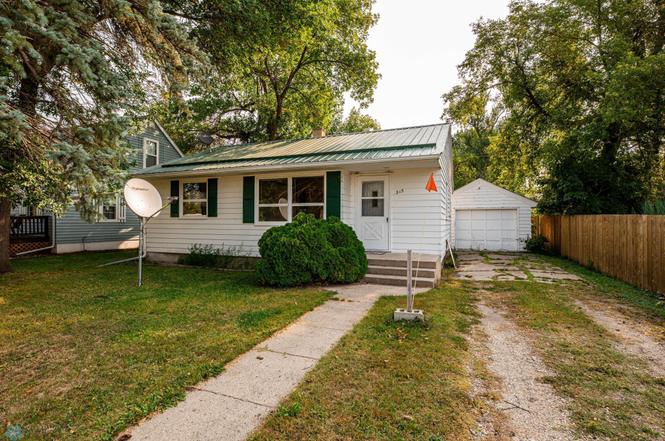
315 Rose St · Lisbon, ND
Flood risk No data
- FEMA flood zone
- —
- Chance of flooding over 30 yrs
- —
- Est. flood insurance / yr
- —
Fire risk No data
- Est. fire insurance / yr
- —
Heat risk No data
- Hot days now (above threshold)
- —
- Hot days in 30 yrs
- —
Wind risk No data
- Chance of severe wind over 30 yrs
- —
Air-quality risk No data
- Unhealthy air days now
- —
- Unhealthy air days in 30 yrs
- —
Risk factors via First Street. Map © Google.
Why this score? — see what drove the C+ grade
The composite is a weighted blend of 9 inputs, each scored 0–100. Each bar is that input's sub-score; the figure is the points it added to the 100-point composite (weight × sub-score).
- Cash flow +26.2/30.0
- DSCR +8.9/10.0
- ARV discount +7.5/15.0
- 1% rule +7.1/10.0
- Schools +4.1/10.0
- Livability +3.5/5.0
- Rent growth +2.5/5.0
- Condition / age +2.5/5.0
- Appreciation +0.0/10.0
$69,000
🖨 Deal sheet (PDF) 📄 Offer letter ✓ Due diligence
Key facts
- Metal roof
- Manageable lot
- Local amenities
Tags
Property features AI
Finance
- Other: Other structures: Garage(s)
- Financial info: Conventional financing available
Exterior
- Parking: Detached garage (1 car) with 14x20 dimensions
- Utilities: City water (in street); City sewer (in street); 100 Amp electrical service; Oil fuel
- Home design: Residential property; One story
- Construction: Frame construction; Metal roof; Block foundation (24x32 foundation dimensions); Has basement (block, unfinished)
- Exterior features: Deck; City street frontage; Publicly maintained road
Interior
- Kitchen: Range; Dishwasher; Refrigerator
- Bedrooms: 1 bedroom (main floor)
- Bathrooms: 1 full bathroom (main floor)
- Heating & cooling: Forced air heating; Wall and window air conditioning units
- Interior features: Living/Dining room combination; Bonus room; Utility room; Exhaust fan; Fuel tank (owned); Electric water heater
- Laundry & utility: Washer and dryer included; Washer/Dryer hookup; Laundry located in basement
Neighborhood map
What this means for you Summary
Snapshot
- This is a 1-bed/1.0-bath other listed at $69k.
Deal economics
- At list price, monthly cash flow is $176 ($2k/yr) — positive.
- The deal already cash-flows at list — no discount required.
- Meets the 1% rule at list price ($837 rent vs $69k).
- Recommended offer: $61k (12.0% below list) — sets the bar for market timing.
Location & tenants
- Location reads 70/100 on livability (#73 in ND) — a middle-class / working-renter tenant base. Strengths: crime A+, cost of living A+, housing A+; Watch: employment D+, health & safety D+, amenities F.
- Lisbon 19 (rural): math 46% / reading 49% proficiency, ranked #15 of 53 in ND (top 28%) — families likely to look elsewhere, expect single-tenant / working-renter base with shorter leases; only 17% free/reduced lunch — higher-income household profile.
- Zoned schools: Lisbon Elementary School (math 52% / reading 47%, grade D, #65 of 236 statewide, top 37%, 235 students, 26% FRL); Lisbon Middle School (math 42% / reading 47%, grade D, #16 of 35 statewide, top 44%, 186 students, 22% FRL); Lisbon High School (math 34% / reading 54%, grade F, #33 of 144 statewide, top 32%, 207 students, 21% FRL).
- Market conditions: 17 active listings in the ZIP; 3 units permitted in Ransom County in 2024 (0 in 5+ unit buildings).
Forward outlook
- Local home prices are declining (-3.0%/yr); year-one equity from $477 of loan paydown is wiped out by about $2k of value loss. Plan a longer hold.
- At projected returns (-3.0% appreciation + 3.0% rent growth), your $19k cash investment doubles in ~10 years — after that, you're playing with house money.
Negotiation context
- It's been on market 250 days — a 12% lower offer ($61k) is reasonable based on typical stale-listing flexibility.
Risks & watch-outs
- Watch-outs: built in 1955 — expect roof / HVAC / electrical / plumbing capex.
Questions for the listing agent
- It's been on market 250 days. Have you received any prior offers? Is the seller open to a 12% concession, seller financing, or rate buy-down credit?
- Built in 1955 — when were the roof, HVAC, electrical panel, plumbing, and water heater last replaced?
- Why hasn't it sold? Are there any deal-killer items the seller is aware of (foundation, flood, title, zoning, code violations)?
- Is there a deadline driving the sale (1031 exchange, divorce, estate, relocation)? That informs how much negotiation room exists.
- What's the average days-on-market for RENTAL listings here right now (not sales)? A rising rental-DOM trend means longer vacancies and softer asking-rent achievability than the comps imply.
- What's the recent tenant-quality profile in this submarket — average credit score on applications, eviction rate, late-payment / NSF rate, and stable-employment percentage? A property-management company in the area should have these aggregated.
- How much new for-sale + rental construction is in the pipeline within 1–3 miles? Heavy new supply typically softens prices + rents 12–24 months out; constrained supply supports both.
Investment metrics
- 1% rule
- 1.21% ✓
- Cap rate
- 9.36%
- Cash-on-cash
- 10.94%
- DSCR
- 1.49
- GRM
- 6.9
CMA / ARV
No comps found within radius.
Projected returns pro-forma
-3.0% appreciation · 3.0% rent growth · sell at horizon
- IRR
- 0.1%
- Equity multiple
- 1.00×
- Total profit
- $51
- Equity at exit
- $10,288
- IRR
- 9.7%
- Equity multiple
- 1.75×
- Total profit
- $14,557
- Equity at exit
- $5,966
Cash invested: $19,320 (down + closing). Projections, not guarantees.
Landlord ↔ Tenant lean methodology
- Overall (STATE)
- 82 Strongly Landlord-Friendly
- State North Dakota
- 82 Strongly Landlord-Friendly · R+20
- County
- — inherits STATE
- City
- — inherits STATE
ZIP-level market 58054
- Active inventory
- 17
- Price-to-rent
- 6.9×
Monthly cashflow live
- Estimated rent
- $837 medium interval (Pro) →
- Mortgage (P&I)
- −$362
- Tax from tax record
- −$95 /mo · $1,135/yr
- Insurance
- −$29
- HOA
- −$0
- Vacancy / Maint / Mgmt
- −$176
- Net cashflow
- $176
Break-even live
Sensitivity live
| Price | -10% $215 | -5% $196 | +0% $176 | +5% $157 | +10% $137 |
|---|---|---|---|---|---|
| Rent | -10% $110 | -5% $143 | +0% $176 | +5% $209 | +10% $242 |
| Rate | -1.0pp $211 | -0.5pp $194 | base $176 | +0.5pp $158 | +1.0pp $140 |
UW: 25.0% down · 7.5% · 30yr · 1.5% tax · 5.0% vac · 8.0% maint · 8.0% mgmt
Financing live
Cash to close
- Down payment
- $17,250
- Closing costs
- $2,070
- Reserves months
- —
- Total cash needed
- —
Loan-product check · same deal, 3 products live
Conventional
25% down · 7.5% · 30yr
- Down + closing
- —
- Monthly P&I
- —
- Monthly cashflow
- —
- DSCR
- —
- Eligible?
- —
Personal DTI + credit; lowest rate.
DSCR
20% down · 8.5% · 30yr
- Down + closing
- —
- Monthly P&I
- —
- Monthly cashflow
- —
- DSCR
- —
- Eligible?
- —
No personal income docs; deal must DSCR.
Hard money
10% down · 12.0% · 12mo
- Down + closing
- —
- Monthly P&I
- —
- Monthly cashflow
- —
- DSCR
- —
- Eligible?
- —
Short-term bridge; refi at stabilization.
Listing history 3 events
-
2026-05-20status Pending
-
2026-02-12price $69,000
-
2025-09-12$72,000 Active
ⓘ Source: listings_history table (triggers on properties + properties_extension) + one-shot
backfill from property_details.listing_events for pre-trigger history.
Tax reassessment forecast ND · Resets to sale price
- Current annual tax
- $1,135 · $95/mo
- Projected year-2 tax
- $1,135 · $95/mo
- Expected delta
- $0/yr ($0/mo · 0.0%)
ⓘ Screening estimate from a state-policy table — verify with the county assessor before closing.
Nearby sold comps map
Loading sold comps map…
Walkable amenities ~0.75 mi
Loading nearby amenities…
Taxation est. · year 1
- Rental income
- $10,044
- − Mortgage interest
- −$3,865
- − Property taxes
- −$1,135
- − Insurance
- −$345
- − Repairs & maintenance
- −$804
- − Management
- −$804
- − Depreciation
- −$2,007
- Taxable income
- $1,085
- Est. tax owed @ 24.0%
- −$260
- After-tax cash flow
- $1,853/yr
For passive investors: Depreciation is non-cash, so a rental often shows a tax loss while cash-flowing — sheltering income. Rental losses are passive: they offset passive income freely, and up to $25,000/yr can offset ordinary (W-2) income if you actively participate and your MAGI is under $100k (phasing out to $0 by $150k); unused losses carry forward. On sale, claimed depreciation is recaptured at up to 25%, and gains may owe capital-gains tax (a 1031 exchange can defer both). Figures are a year-1 estimate at your 24.0% rate — not tax advice; consult a CPA.
Schools (NCES district)
- District
- Lisbon 19
- NCES district ID
- 3811430
- Math proficiency
- 46% ▲ 2.00%
- Reading proficiency
- 49% ▲ 1.00%
- Median HH income
- $53,438
- Composite
- 41.04/100
- National rank
- #3582
- State rank
- #15 of 53 in ND
Livability — Lisbon
- Score
- 70/100
- State rank
- #73
- US rank
- #7461
Category grades
Schools grade is shown separately in the Schools card above.
Census & demographics
- Census place
- Lisbon, ND
- Population (ZIP)
- 3,332
Population outlook (Ransom County) Hauer SSP2
- Today (2025)
- 5,517 people
- By 2030
- 5,534 · +0.3%
- By 2040
- 5,574 · +1.0%
- By 2050
- 5,654 · +2.5%
- By 2075
- 6,316 · +14.5%
- By 2100
- 6,749 · +22.3%
Race, ethnicity, and origin ACS 2023
- Neighborhood character
- Predominantly White (93%)
- Race & ethnicity
- White 93% Two or more races 5% Hispanic / Latino 1% Black 1%
- Common ancestry
- Portuguese 33% Lithuanian 3% Iranian 1%
- Foreign-born
- 2% · China
- Languages at home
- 96% English-only · Russian/Polish/Slavic 1% Spanish 1% Other Indo-European 1%
Political lean MEDSL · Ransom
- 2024 margin
- Strong R (+28.2) · D 35.0% · R 63.1% · Other 1.9%
- 2008→2024 swing
- -43.5pp toward R · 2008: 15.3pp · 2024: -28.2pp
- All cycles
- 2024: R+28.2 2020: R+19.3 2016: R+16.1 2012: D+13.8 2008: D+15.3
Not yet ingested
- Civics
- —
Market trends
- HPI YoY
- ▼ -77.34%
- Current HPI
- 110.413
- Rent YoY
- —
- Metro
- —
- State GDP YoY
- ▲ 2.09%
- F500 in state
- 2
Industry mix (Fortune 500 HQ in ND)
| Industry | F500 HQs | Revenue |
|---|---|---|
| Utilities / Construction | 1 | $6B |
|
||
Price history
-4.2% since first listed3 events — show timeline
- 2026-05-20 Pending — NORTHSTARMLS as Distributed by MLS Grid
- 2026-02-12 Price Changed $69,000 NORTHSTARMLS as Distributed by MLS Grid
- 2025-09-12 Listed $72,000 NORTHSTARMLS as Distributed by MLS Grid
Property tax history
+1.9%/yrLatest (2025): $1,135 · +9.5% YoY. Source: county tax records.
Cash-flow waterfall
monthlySold comps — $/sqft
last 12 mo · ≤1 miLoading sold comps…