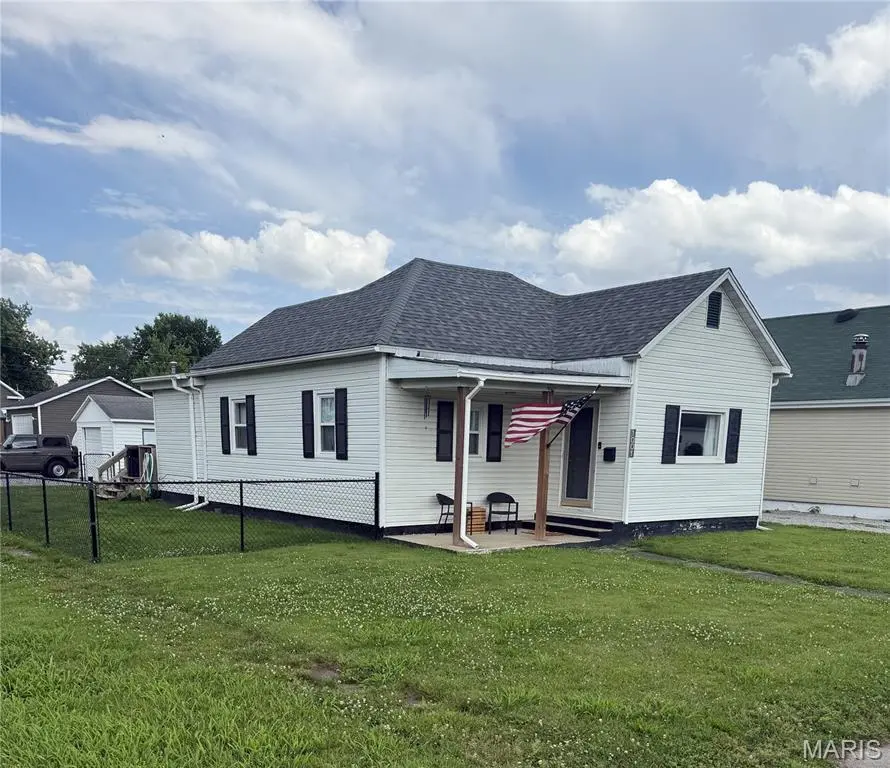
1001 S Macoupin St · Gillespie, IL
Flood risk 3/10 · Minor
- FEMA flood zone
- X
- Chance of flooding over 30 yrs
- 0.1%
- Est. flood insurance / yr
- $473 – $860
Fire risk 1/10 · Minimal
- Est. fire insurance / yr
- $804 – $1,492
Heat risk 4/10 · Minor
- Hot days now (above 105°F)
- 7 days/yr
- Hot days in 30 yrs
- 20 days/yr
Wind risk 2/10 · Minimal
- Chance of severe wind over 30 yrs
- 1.0%
Air-quality risk 4/10 · Minor
- Unhealthy air days now
- 3 days/yr
- Unhealthy air days in 30 yrs
- 6 days/yr
Risk factors via First Street. Map © Google.
Why this score? — see what drove the D grade
The composite is a weighted blend of 9 inputs, each scored 0–100. Each bar is that input's sub-score; the figure is the points it added to the 100-point composite (weight × sub-score).
- Cash flow +16.3/30.0
- ARV discount +8.1/15.0
- DSCR +5.1/10.0
- 1% rule +3.9/10.0
- Livability +3.7/5.0
- Rent growth +2.5/5.0
- Condition / age +2.5/5.0
- Schools +1.5/10.0
- Appreciation +0.0/10.0
$112,000
🖨 Deal sheet (PDF) 📄 Offer letter ✓ Due diligence
Listing remarks MLS
Move in ready. Lots of windows to brighten this home. Two bedroom, one full bath home with main floor laundry. Living room, dining room are open concept. Kitchen includes center island. You will enjoy walking out to the fenced in backyard. Detached 1 car garage. Home was updated in 2021!
Key facts
- Natural light
- Fenced backyard
- Center island
Tags
Property features AI
Exterior
- Parking: Detached garage (1 car, total parking for 1)
- Utilities: Public water; Public sewer; Electric service by Ameren
- Home design: Single-family residence; One story
- Construction: Vinyl siding
- Exterior features: Corner lot; Gravel road access
Interior
- Kitchen: Microwave; Gas range; Refrigerator
- Bedrooms: 2 bedrooms (both on the main level)
- Bathrooms: 1 full bathroom (on the main level)
- Heating & cooling: Natural gas heating with forced air; Central air conditioning; Gas-powered cooling components
- Interior features: Kitchen island; Crawl space basement
- Laundry & utility: Main-level laundry
Neighborhood map
What this means for you Summary
Snapshot
- This is a 2-bed/1.0-bath single-family listed at $112k.
Deal economics
- At list price, monthly cash flow is $62 ($744/yr) — positive.
- The deal already cash-flows at list — no discount required.
- To meet the 1% rule (rent ≥ 1% of price), the offer needs to be $99k (11.3% below list).
- Recommended offer: $99k (11.3% below list) — sets the bar for 1% rule.
Location & tenants
- Location reads 74/100 on livability (#261 in IL, #4,848 nationally) — a middle-class / working-renter tenant base. Strengths: cost of living A+, housing A+, crime A; Watch: amenities F, commute D-, employment F.
- Gillespie CUSD 7 (town): math 14% / reading 20% proficiency, ranked #485 of 620 in IL (top 78%) — low school quality limits family demand, transient renter base, plan for 1-2y turnover.
- Zoned schools: Ben-Gil Elementary School (math 7% / reading 15%, grade F, #1,460 of 2,056 statewide, top 72%, 552 students, 0% FRL); Gillespie Middle School (math 16% / reading 20%, grade F, #444 of 665 statewide, top 67%, 248 students, 0% FRL); Gillespie High School (math 27% / reading 32%, grade F, #187 of 693 statewide, top 30%, 340 students, 0% FRL) — zoned schools average 0% FRL vs 57% district-wide (57 pts lower); this property's tenant base skews higher-income than the district average.
- Market conditions: 21 active listings in the ZIP; 70 units permitted in Macoupin County in 2024 (0 in 5+ unit buildings).
Forward outlook
- Local home prices are declining (-3.0%/yr); year-one equity from $774 of loan paydown is wiped out by about $3k of value loss. Plan a longer hold.
- Macoupin County population projected at -27% by 2050 — secular population decline; favor cash flow + early exit over multi-decade hold.
Negotiation context
- Only 6 days on market — expect competitive offers; lowballing is unlikely to land.
- 3 sale attempts since 22y ago; this cycle's ask is 22% above the opening price — seller raised mid-cycle; expect resistance to lowballs.
- Current owner paid $50k; list at $112k implies a 124% gain — meaningful room to come down on a strong offer.
Risks & watch-outs
- Watch-outs: built in 1940 — expect roof / HVAC / electrical / plumbing capex.
Questions for the listing agent
- Built in 1940 — when were the roof, HVAC, electrical panel, plumbing, and water heater last replaced?
- Is there a deadline driving the sale (1031 exchange, divorce, estate, relocation)? That informs how much negotiation room exists.
- Schools are D-rated, which usually means shorter tenancies and higher turnover. Who's the typical renter profile here, and what's been the actual vacancy rate?
- The area grade is low — what's the realistic commute time and amenity access for the typical tenant pool here? Any planned neighborhood developments (good or bad) we should know about?
- What's the average days-on-market for RENTAL listings here right now (not sales)? A rising rental-DOM trend means longer vacancies and softer asking-rent achievability than the comps imply.
- What's the recent tenant-quality profile in this submarket — average credit score on applications, eviction rate, late-payment / NSF rate, and stable-employment percentage? A property-management company in the area should have these aggregated.
- How much new for-sale + rental construction is in the pipeline within 1–3 miles? Heavy new supply typically softens prices + rents 12–24 months out; constrained supply supports both.
Investment metrics
- 1% rule
- 0.89% ✗
- Cap rate
- 6.96%
- Cash-on-cash
- 2.37%
- DSCR
- 1.11
- GRM
- 9.4
CMA / ARV
- ARV (on-the-fly)
- $113,500
- Comps found
- 8
Show comp detail 8 sales within ~0.75 mi
| Address | Dist | Beds/Ba | Sqft | Sold | Price | $/sf | Match |
|---|---|---|---|---|---|---|---|
| 708 Madison St | 0.17mi | 3/2.0 (+1) | 1,180 (+4%) | 7mo | $149,900 | $127 | 70 |
| 803 S Madison St | 0.13mi | 3/1.0 (+1) | 1,200 (+6%) | 12mo | $21,000 | $18 | 69 |
| 504 Henrietta St | 0.30mi | 3/1.0 (+1) | 1,047 (-8%) | 11mo | $105,000 | $100 | 58 |
| 211 W Baker St | 0.20mi | 2/1.0 | 1,010 (-11%) | 18mo | $50,000 | $50 | 58 |
| 600 W Wilson Ave | 0.34mi | 2/2.5 | 1,200 (+6%) | 16mo | $159,000 | $133 | 56 |
| 411 W Chestnut St | 0.49mi | 2/1.0 | 1,092 (-4%) | 23mo | $19,900 | $18 | 51 |
| 414 W Walnut | 0.52mi | 2/1.5 | 1,060 (-7%) | 20mo | $27,500 | $26 | 46 |
| 300 W Maple St | 0.70mi | 2/1.5 | 1,032 (-9%) | 21mo | $124,800 | $121 | 32 |
Match score weights: distance 35% · size 25% · config 20% · recency 20%. Top-matched comps best support the ARV.
Projected returns pro-forma
-3.0% appreciation · 3.0% rent growth · sell at horizon
- IRR
- -12.6%
- Equity multiple
- 0.55×
- Total profit
- $-14,219
- Equity at exit
- $16,700
- IRR
- -3.5%
- Equity multiple
- 0.77×
- Total profit
- $-7,366
- Equity at exit
- $9,684
Cash invested: $31,360 (down + closing). Projections, not guarantees.
Landlord ↔ Tenant lean methodology
- Overall (STATE)
- 43 Moderately Tenant-Leaning
- State Illinois
- 43 Moderately Tenant-Leaning · D+7
- County
- — inherits STATE
- City
- — inherits STATE
ZIP-level market 62033
- Home prices YoY
- -25.4%
- Active inventory
- 21
- Price-to-rent
- 9.4×
Monthly cashflow live
- Estimated rent
- $994 medium interval (Pro) →
- Mortgage (P&I)
- −$587
- Tax from tax record
- −$89 /mo · $1,069/yr
- Insurance
- −$47
- HOA
- −$0
- Vacancy / Maint / Mgmt
- −$209
- Net cashflow
- $62
Break-even live
Sensitivity live
| Price | -10% $125 | -5% $94 | +0% $62 | +5% $30 | +10% $-1 |
|---|---|---|---|---|---|
| Rent | -10% $-17 | -5% $23 | +0% $62 | +5% $101 | +10% $140 |
| Rate | -1.0pp $118 | -0.5pp $90 | base $62 | +0.5pp $33 | +1.0pp $3 |
UW: 25.0% down · 7.5% · 30yr · 1.5% tax · 5.0% vac · 8.0% maint · 8.0% mgmt
Financing live
Cash to close
- Down payment
- $28,000
- Closing costs
- $3,360
- Reserves months
- —
- Total cash needed
- —
Loan-product check · same deal, 3 products live
Conventional
25% down · 7.5% · 30yr
- Down + closing
- —
- Monthly P&I
- —
- Monthly cashflow
- —
- DSCR
- —
- Eligible?
- —
Personal DTI + credit; lowest rate.
DSCR
20% down · 8.5% · 30yr
- Down + closing
- —
- Monthly P&I
- —
- Monthly cashflow
- —
- DSCR
- —
- Eligible?
- —
No personal income docs; deal must DSCR.
Hard money
10% down · 12.0% · 12mo
- Down + closing
- —
- Monthly P&I
- —
- Monthly cashflow
- —
- DSCR
- —
- Eligible?
- —
Short-term bridge; refi at stabilization.
Listing history 9 events
-
2026-06-21days on market $112,000 Active 6 DOM
-
2026-06-21days on market $112,000 Active 5 DOM
-
2026-06-18days on market $112,000 Active 3 DOM
-
2026-06-17days on market $112,000 Active 2 DOM
-
2026-06-17remarks 349-char remark
-
2026-06-16statusdays on market $112,000 Active 1 DOM
-
2026-06-15days on market $112,000 Coming Soon 3 DOM
-
2026-06-12remarks 313-char remark
-
2026-06-12$112,000 Coming Soon 1 DOM
ⓘ Source: listings_history table (triggers on properties + properties_extension) + one-shot
backfill from property_details.listing_events for pre-trigger history.
Tax reassessment forecast IL · Partial reset (capped growth)
- Current annual tax
- $1,069 · $89/mo
- Projected year-2 tax
- $1,806 · $150/mo
- Expected delta
- +$737/yr (+$61/mo · 68.9%)
ⓘ Screening estimate from a state-policy table — verify with the county assessor before closing.
Climate risk First Street
- Flood 3/10 Moderate FEMA zone X · 10% chance over 30 yrs
- Wildfire 1/10 Low
- Heat 4/10 Moderate 7 d/yr ≥105°F today · 20 d/yr by 30 yrs out
- Wind 2/10 Low 100% chance of damaging wind over 30 yrs
- Air quality 4/10 Moderate 3 unhealthy d/yr today · 6 by 30 yrs out
Nearby sold comps map
Loading sold comps map…
Walkable amenities ~0.75 mi
Loading nearby amenities…
Taxation est. · year 1
- Rental income
- $11,925
- − Mortgage interest
- −$6,274
- − Property taxes
- −$1,069
- − Insurance
- −$560
- − Repairs & maintenance
- −$954
- − Management
- −$954
- − Depreciation
- −$3,258
- Taxable loss
- −$1,144
- Est. tax savings @ 24.0%
- +$275
- After-tax cash flow
- $1,018/yr
For passive investors: Depreciation is non-cash, so a rental often shows a tax loss while cash-flowing — sheltering income. Rental losses are passive: they offset passive income freely, and up to $25,000/yr can offset ordinary (W-2) income if you actively participate and your MAGI is under $100k (phasing out to $0 by $150k); unused losses carry forward. On sale, claimed depreciation is recaptured at up to 25%, and gains may owe capital-gains tax (a 1031 exchange can defer both). Figures are a year-1 estimate at your 24.0% rate — not tax advice; consult a CPA.
Schools (NCES district)
- District
- Gillespie CUSD 7
- NCES district ID
- 1716680
- Math proficiency
- 14% ▼ -12.00%
- Reading proficiency
- 20% ▼ -19.00%
- Median HH income
- $41,399
- Composite
- 14.59/100
- National rank
- #9413
- State rank
- #485 of 620 in IL
Livability — Gillespie
- Score
- 74/100
- State rank
- #261
- US rank
- #4848
Category grades
Schools grade is shown separately in the Schools card above.
Census & demographics
- Census place
- Gillespie, IL
- Population (ZIP)
- 4,398
Population outlook (Macoupin County) Hauer SSP2
- Today (2025)
- 42,867 people
- By 2030
- 40,796 · -4.8%
- By 2040
- 36,135 · -15.7%
- By 2050
- 31,469 · -26.6%
- By 2075
- 22,102 · -48.4%
- By 2100
- 15,380 · -64.1%
Race, ethnicity, and origin ACS 2023
- Neighborhood character
- Predominantly White (93%)
- Race & ethnicity
- White 93% Two or more races 6%
- Common ancestry
- Slovak 3% Romanian 2% Serbian 1%
- Foreign-born
- 0%
Political lean MEDSL · Macoupin
- 2024 margin
- Solid R (+39.2) · D 29.4% · R 68.7% · Other 1.9%
- 2008→2024 swing
- -49.0pp toward R · 2008: 9.8pp · 2024: -39.2pp
- All cycles
- 2024: R+39.2 2020: R+36.5 2016: R+35.0 2012: R+7.0 2008: D+9.8
Not yet ingested
- Civics
- —
Market trends
- HPI YoY
- ▼ -46.59%
- Current HPI
- 136.9671
- Rent YoY
- —
- Metro
- —
- State GDP YoY
- ▲ 1.59%
- F500 in state
- 60
Industry mix (Fortune 500 HQ in IL)
| Industry | F500 HQs | Revenue |
|---|---|---|
| Insurance | 4 | $201B |
|
||
| Consumer Goods | 4 | $87B |
|
||
| Industrial Machinery | 3 | $64B |
|
||
| Healthcare | 2 | $55B |
|
||
| Retail / Pharmacy | 1 | $148B |
|
||
| Agriculture / Food | 1 | $86B |
|
||
Price history
+349.8% since first listed11 events — show timeline
- 2026-06-12 Coming Soon $112,000 MARIS as Distributed by MLS Grid
- 2023-05-08 Listed $92,000 MARIS as Distributed by MLS Grid
- 2023-05-08 Sold (MLS) — MARIS as Distributed by MLS Grid
- 2021-08-27 Pending — MARIS as Distributed by MLS Grid
- 2021-08-27 Sold (MLS) — MARIS as Distributed by MLS Grid
- 2021-07-26 Contingent — MARIS as Distributed by MLS Grid
- 2021-07-07 Listed $79,900 MARIS as Distributed by MLS Grid
- 2020-05-20 Sold (MLS) — MARIS as Distributed by MLS Grid
- 2005-04-12 Sold (Public Records) $50,000 Public Records
- 2004-10-15 Sold (MLS) — RMLSA as Distributed by MLS Grid
- 2004-09-13 Listed $24,900 RMLSA as Distributed by MLS Grid
Property tax history
+2.2%/yrLatest (2024): $1,069 · +5.3% YoY. Source: county tax records.
Cash-flow waterfall
monthlySold comps — $/sqft
last 12 mo · ≤1 miLoading sold comps…