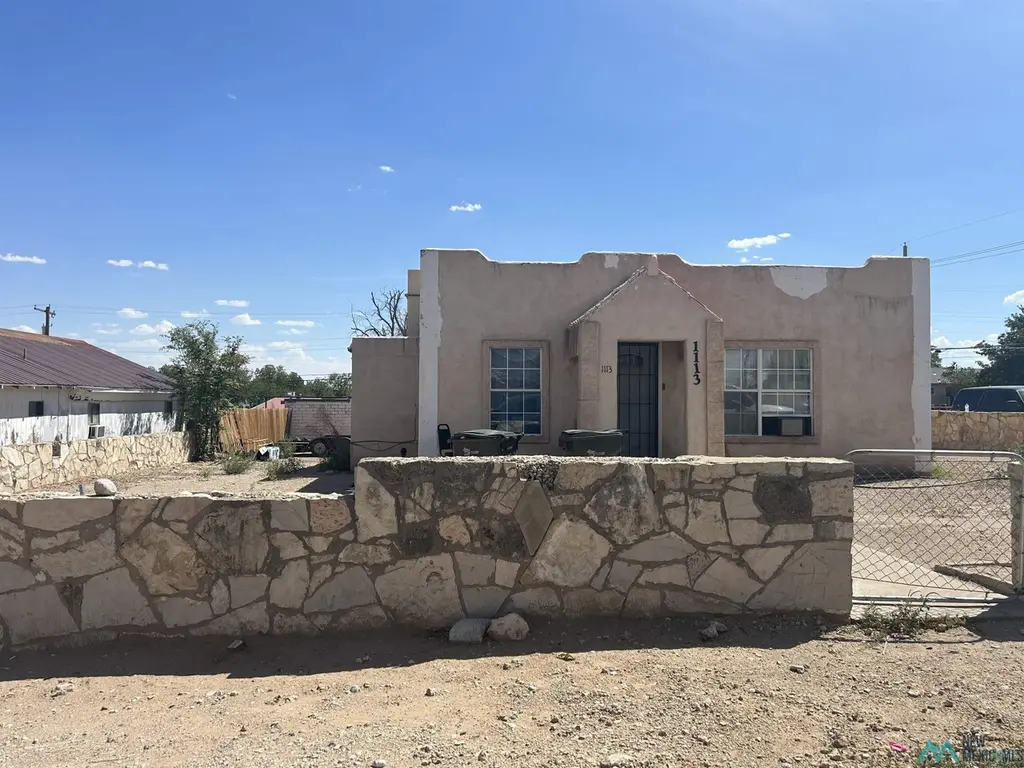
1113 W Greene St · Carlsbad, NM
Flood risk 1/10 · Minimal
- FEMA flood zone
- X (unshaded)
- Chance of flooding over 30 yrs
- 0.0%
- Est. flood insurance / yr
- $507 – $1,088
Fire risk 7/10 · Major
- Est. fire insurance / yr
- $706 – $1,312
Heat risk 6/10 · Moderate
- Hot days now (above 102°F)
- 7 days/yr
- Hot days in 30 yrs
- 21 days/yr
Wind risk 2/10 · Minimal
- Chance of severe wind over 30 yrs
- —
Air-quality risk 1/10 · Minimal
- Unhealthy air days now
- 0 days/yr
- Unhealthy air days in 30 yrs
- 0 days/yr
Risk factors via First Street. Map © Google.
Why this score? — see what drove the C+ grade
The composite is a weighted blend of 9 inputs, each scored 0–100. Each bar is that input's sub-score; the figure is the points it added to the 100-point composite (weight × sub-score).
- Cash flow +25.5/30.0
- DSCR +8.4/10.0
- ARV discount +7.5/15.0
- 1% rule +5.4/10.0
- Schools +5.0/10.0
- Livability +3.5/5.0
- Rent growth +2.5/5.0
- Condition / age +2.5/5.0
- Appreciation +0.0/10.0
$195,000
🖨 Deal sheet 📄 Offer letter ✓ Due diligence
Listing remarks MLS
Where to begin with this property! This 6 bedroom 3 bathroom home has all the room! This could be the ideal investment property or an amazing primary residence! This home has brand new tile and paint as well as a full renovation! Call your favorite realtor for your showing ASAP!
Key facts
- Built 1991
- Listed 159 days
Neighborhood map
What this means for you Summary
Snapshot
- This is a 6-bed/3.0-bath single-family listed at $195k.
Deal economics
- At list price, monthly cash flow is $453 ($5k/yr) — positive.
- The deal already cash-flows at list — no discount required.
- Meets the 1% rule at list price ($2k rent vs $195k).
- Recommended offer: $172k (12.0% below list) — sets the bar for market timing.
Location & tenants
- Location reads 70/100 on livability (#20 in NM) — a middle-class / working-renter tenant base. Strengths: cost of living A+, housing A+, employment A; Watch: commute C-, health & safety C-, schools D.
- Market conditions: 363 active listings in the ZIP; solid renter incomes; 156 units permitted in Eddy County in 2024 (0 in 5+ unit buildings).
- This rent runs 31% of the median local income ($78k/yr) — at the standard rent-burdened threshold; future hikes will face affordability resistance.
Forward outlook
- Local home prices are declining (-3.0%/yr); year-one equity from $1k of loan paydown is wiped out by about $6k of value loss. Plan a longer hold.
- Eddy County population projected at +36% by 2050 — long-run rental-demand tailwind backs the buy-and-hold thesis.
Negotiation context
- It's been on market 160 days — a 12% lower offer ($172k) is reasonable based on typical stale-listing flexibility.
- 2 sale attempts since 8y ago with the ask held roughly flat each time — persistent listings suggest the price (not the market) is what's stuck; bring a comps-based counter.
Risks & watch-outs
- Climate carrying-cost: major wildfire risk; extreme-heat days projected 7→21/yr by 2055 (HVAC capex compounding) — expect insurance premiums to compound above CPI over the hold.
Questions for the listing agent
- It's been on market 160 days. Have you received any prior offers? Is the seller open to a 12% concession, seller financing, or rate buy-down credit?
- Why hasn't it sold? Are there any deal-killer items the seller is aware of (foundation, flood, title, zoning, code violations)?
- Is there a deadline driving the sale (1031 exchange, divorce, estate, relocation)? That informs how much negotiation room exists.
- Schools are D-rated, which usually means shorter tenancies and higher turnover. Who's the typical renter profile here, and what's been the actual vacancy rate?
- Crime grade is F in this area — have there been break-ins, vandalism, or insurance claims at this property in the last 3 years? What carrier currently insures it and at what premium?
- What's the average days-on-market for RENTAL listings here right now (not sales)? A rising rental-DOM trend means longer vacancies and softer asking-rent achievability than the comps imply.
- What's the recent tenant-quality profile in this submarket — average credit score on applications, eviction rate, late-payment / NSF rate, and stable-employment percentage? A property-management company in the area should have these aggregated.
- How much new for-sale + rental construction is in the pipeline within 1–3 miles? Heavy new supply typically softens prices + rents 12–24 months out; constrained supply supports both.
Investment metrics
- 1% rule
- 1.04% ✓
- Cap rate
- 9.08%
- Cash-on-cash
- 9.95%
- DSCR
- 1.44
- GRM
- 8.0
CMA / ARV
No comps found within radius.
Projected returns pro-forma
-3.0% appreciation · 3.0% rent growth · sell at horizon
- IRR
- -1.4%
- Equity multiple
- 0.95×
- Total profit
- $-2,864
- Equity at exit
- $29,075
- IRR
- 8.3%
- Equity multiple
- 1.63×
- Total profit
- $34,249
- Equity at exit
- $16,860
Cash invested: $54,600 (down + closing). Projections, not guarantees.
Landlord ↔ Tenant lean methodology
- Overall (STATE)
- 55 Moderately Landlord-Leaning
- State New Mexico
- 55 Moderately Landlord-Leaning · D+3
- County
- — inherits STATE
- City
- — inherits STATE
ZIP-level market 88220
- Active inventory
- 363
- Price-to-rent
- 8.0×
Monthly cashflow live
- Estimated rent
- $2,026 medium interval (Pro) →
- Mortgage (P&I)
- −$1,023
- Tax from tax record
- −$44 /mo · $526/yr
- Insurance
- −$81
- HOA
- −$0
- Vacancy / Maint / Mgmt
- −$425
- Net cashflow
- $453
Break-even live
UW: 25.0% down · 7.5% · 30yr · 1.5% tax · 5.0% vac · 8.0% maint · 8.0% mgmt
Financing live
Cash to close
- Down payment
- $48,750
- Closing costs
- $5,850
- Reserves months
- —
- Total cash needed
- —
Loan-product check · same deal, 3 products live
Conventional
25% down · 7.5% · 30yr
- Down + closing
- —
- Monthly P&I
- —
- Monthly cashflow
- —
- DSCR
- —
- Eligible?
- —
Personal DTI + credit; lowest rate.
DSCR
20% down · 8.5% · 30yr
- Down + closing
- —
- Monthly P&I
- —
- Monthly cashflow
- —
- DSCR
- —
- Eligible?
- —
No personal income docs; deal must DSCR.
Hard money
10% down · 12.0% · 12mo
- Down + closing
- —
- Monthly P&I
- —
- Monthly cashflow
- —
- DSCR
- —
- Eligible?
- —
Short-term bridge; refi at stabilization.
Listing history 22 events
-
2026-06-18days on market $195,000 Active 160 DOM
-
2026-06-17days on market $195,000 Active 159 DOM
-
2026-06-16days on market $195,000 Active 158 DOM
-
2026-06-15days on market $195,000 Active 157 DOM
-
2026-06-14days on market $195,000 Active 155 DOM
-
2026-06-13days on market $195,000 Active 154 DOM
-
2026-06-10days on market $195,000 Active 152 DOM
-
2026-06-09days on market $195,000 Active 151 DOM
-
2026-06-08days on market $195,000 Active 150 DOM
-
2026-06-07days on market $195,000 Active 149 DOM
-
2026-06-05days on market $195,000 Active 146 DOM
-
2026-06-03days on market $195,000 Active 145 DOM
-
2026-06-02days on market $195,000 Active 144 DOM
-
2026-06-01days on market $195,000 Active 143 DOM
-
2026-05-31days on market $195,000 Active 142 DOM
-
2026-05-30days on market $195,000 Active 141 DOM
-
2026-01-09$195,000 Active 280-char remark
Show marketing remark (280 chars)
Where to begin with this property! This 6 bedroom 3 bathroom home has all the room! This could be the ideal investment property or an amazing primary residence! This home has brand new tile and paint as well as a full renovation! Call your favorite realtor for your showing ASAP!
-
2019-08-15soldstatus
-
2019-01-09soldstatus 103-char remark
Show marketing remark (103 chars)
Have you heard of Fixer Uppers? This is one!!! Several Levels, Needs Paint and Carpet and You have it!
-
2018-07-06$100,000 103-char remark
Show marketing remark (103 chars)
Have you heard of Fixer Uppers? This is one!!! Several Levels, Needs Paint and Carpet and You have it!
-
2007-04-18soldstatus
-
2006-03-20soldstatus
ⓘ Source: listings_history table (triggers on properties + properties_extension) + one-shot
backfill from property_details.listing_events for pre-trigger history.
Tax reassessment forecast NM · Resets to sale price
- Current annual tax
- $526 · $44/mo
- Projected year-2 tax
- $1,560 · $130/mo
- Expected delta
- +$1,034/yr (+$86/mo · 196.5%)
ⓘ Screening estimate from a state-policy table — verify with the county assessor before closing.
Climate risk First Street
- Flood 1/10 Low FEMA zone X (unshaded) · 0% chance over 30 yrs
- Wildfire 7/10 Severe
- Heat 6/10 Major 7 d/yr ≥102°F today · 21 d/yr by 30 yrs out
- Wind 2/10 Low
- Air quality 1/10 Low 0 unhealthy d/yr today · 0 by 30 yrs out
Nearby sold comps map
Loading sold comps map…
Walkable amenities ~0.75 mi
Loading nearby amenities…
Taxation est. · year 1
- Rental income
- $24,308
- − Mortgage interest
- −$10,923
- − Property taxes
- −$526
- − Insurance
- −$975
- − Repairs & maintenance
- −$1,945
- − Management
- −$1,945
- − Depreciation
- −$5,673
- Taxable income
- $2,322
- Est. tax owed @ 24.0%
- −$557
- After-tax cash flow
- $4,874/yr
For passive investors: Depreciation is non-cash, so a rental often shows a tax loss while cash-flowing — sheltering income. Rental losses are passive: they offset passive income freely, and up to $25,000/yr can offset ordinary (W-2) income if you actively participate and your MAGI is under $100k (phasing out to $0 by $150k); unused losses carry forward. On sale, claimed depreciation is recaptured at up to 25%, and gains may owe capital-gains tax (a 1031 exchange can defer both). Figures are a year-1 estimate at your 24.0% rate — not tax advice; consult a CPA.
Schools (NCES district)
No district data.
Livability — Carlsbad
- Score
- 70/100
- State rank
- #20
- US rank
- #7925
Category grades
Schools grade is shown separately in the Schools card above.
Census & demographics
- Census place
- Carlsbad, NM
- County
- Eddy County · 58,370 people
- City population
- 39,828
- Metro
- Carlsbad-Artesia, NM
- Population (ZIP)
- 39,828
- Household income
- $78,162
- Rent vs Own
- Severe rent burden
- 661.0
Population outlook (Eddy County) Hauer SSP2
- Today (2025)
- 65,505 people
- By 2030
- 69,797 · +6.6%
- By 2040
- 79,191 · +20.9%
- By 2050
- 89,199 · +36.2%
- By 2075
- 115,829 · +76.8%
- By 2100
- 129,336 · +97.4%
Race, ethnicity, and origin ACS 2023
- Neighborhood character
- Diverse neighborhood (Simpson 0.56)
- Race & ethnicity
- Hispanic / Latino 48% White 46% Two or more races 22% Black 2% Native American 1%
- Hispanic origin (detail)
- Mexican 41%
- Common ancestry
- Lithuanian 1% Slovak 1% Serbian 1%
- Foreign-born
- 6% · Canada
- Languages at home
- 76% English-only · Spanish 24%
Political lean MEDSL · Eddy
- 2024 margin
- Solid R (+55.9) · D 21.4% · R 77.3% · Other 1.3%
- 2008→2024 swing
- -30.2pp toward R · 2008: -25.6pp · 2024: -55.9pp
- All cycles
- 2024: R+55.9 2020: R+51.8 2016: R+41.6 2012: R+33.5 2008: R+25.6
Not yet ingested
- Civics
- —
Market trends
- HPI YoY
- ▼ -283.72%
- Current HPI
- 114.115
- Rent YoY
- —
- Metro
- Carlsbad-Artesia, NM
- State GDP YoY
- —
- F500 in state
- 0
Price history
+95.0% since first listed6 events — show timeline
- 2026-01-09 Listed $195,000 NMMLS
- 2019-08-15 Sold (Public Records) — Public Records
- 2019-01-09 Sold (MLS) — NMMLS
- 2018-07-06 Listed $100,000 NMMLS
- 2007-04-18 Sold (Public Records) — Public Records
- 2006-03-20 Sold (Public Records) — Public Records
Property tax history
-1.0%/yrLatest (2025): $526 · +1.8% YoY. Source: county tax records.
Cash-flow waterfall
monthlySold comps — $/sqft
last 12 mo · ≤1 miLoading sold comps…