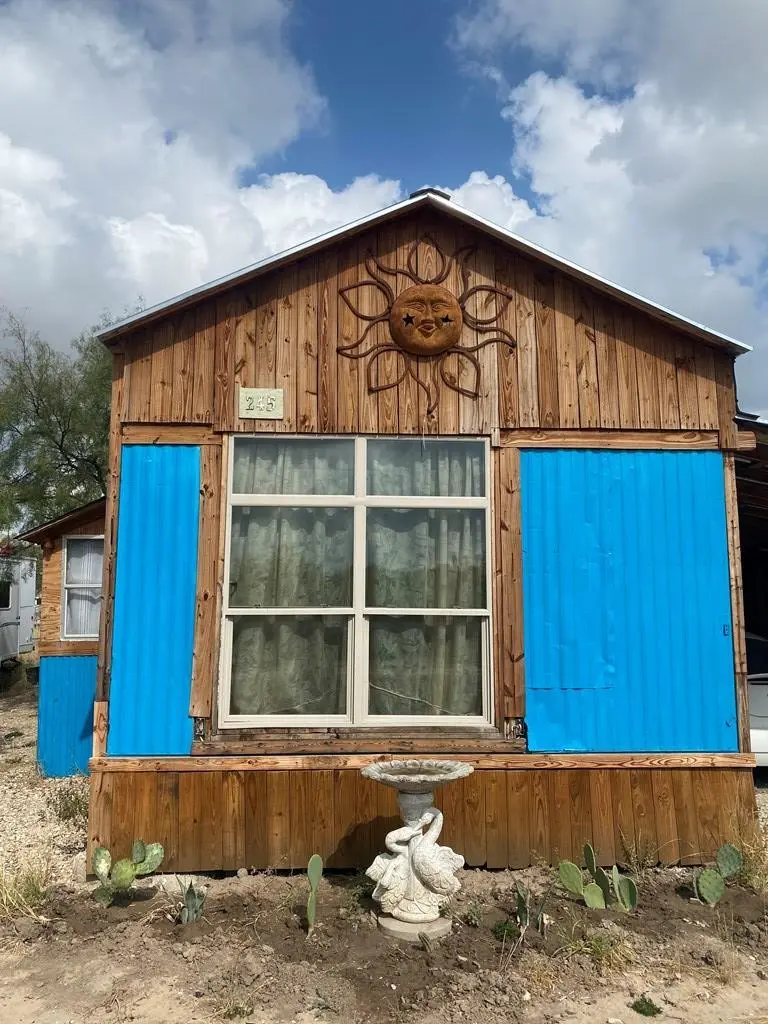
245 Maverick · El Indio, TX
Flood risk 1/10 · Minimal
- FEMA flood zone
- X (unshaded)
- Chance of flooding over 30 yrs
- 0.0%
- Est. flood insurance / yr
- $507 – $1,088
Fire risk 2/10 · Minimal
- Est. fire insurance / yr
- $1,222 – $2,270
Heat risk 8/10 · Major
- Hot days now (above 111°F)
- 5 days/yr
- Hot days in 30 yrs
- 16 days/yr
Wind risk 6/10 · Moderate
- Chance of severe wind over 30 yrs
- 27.0%
Air-quality risk 1/10 · Minimal
- Unhealthy air days now
- 0 days/yr
- Unhealthy air days in 30 yrs
- 0 days/yr
Risk factors via First Street. Map © Google.
Why this score? — see what drove the B- grade
The composite is a weighted blend of 9 inputs, each scored 0–100. Each bar is that input's sub-score; the figure is the points it added to the 100-point composite (weight × sub-score).
- Cash flow +30.0/30.0
- DSCR +10.0/10.0
- 1% rule +7.6/10.0
- ARV discount +7.5/15.0
- Appreciation +5.0/10.0
- Rent growth +2.5/5.0
- Condition / age +2.5/5.0
- Schools +1.7/10.0
- Livability +1.7/5.0
$89,000
🖨 Deal sheet (PDF) 📄 Offer letter ✓ Due diligence
Listing remarks
Nicely Remodeled 3 bedroom 2 bath Mobile Home. Need to see to appreciate the extras, , This mobile newly remodeled and was designed with 2 kitchens and 2 dinning/living areas. Has a wall that divides the mobile home into 2 bedrooms, 1 bath with full kitchen and dining/ Living and the other side 1 bedroom 1 bathroom with Kitchen and dinning /living . Each Kitchen has refrigerator, one has a free range stove and the other kitchen has a cook top. Also New 2 2-ton Minisplits. This home is ready for New owners to move in. Very Peaceful and siren area, 2 front patios to enjoying the morning coffee. Added cement slab laundry room with/ storage room , 2 boilers , fenced , 3 car carport attached. A
Key facts
- 2 kitchens
- Fenced
- Newly remodeled
Tags
Property features AI
Exterior
- Parking: Attached 2-car garage
- Utilities: Septic; City water
- Home design: Single-family property
- Construction: Metal roof
- Exterior features: Covered patio; Dirt improvements
Interior
- Kitchen: Stove/Range; Cooktop
- Bathrooms: Two full bathrooms
- Interior features: Two living areas; Living/dining room combination; Eat-in kitchen; Laundry room; Two water heater units
- Laundry & utility: Laundry room
Neighborhood map
What this means for you Summary
Snapshot
- This is a 3-bed/2.0-bath manufactured listed at $89k.
Deal economics
- At list price, monthly cash flow is $343 ($4k/yr) — positive.
- The deal already cash-flows at list — no discount required.
- Meets the 1% rule at list price ($1k rent vs $89k).
Location & tenants
- Location reads 33/100 on livability (#1,679 in TX) — a limited-amenity area; tenant pool skews transient or value-seeking. Strengths: cost of living A+, crime A; Watch: health & safety C-, amenities F, commute F.
- Eagle Pass ISD (town): math 15% / reading 28% proficiency, ranked #774 of 826 in TX (top 94%) — low school quality limits family demand, transient renter base, plan for 1-2y turnover.
- Zoned schools: Rosita Valley El (math 7% / reading 16%, grade F, #4,225 of 4,322 statewide, top 98%, 454 students, 94% FRL); Memorial J H (math 12% / reading 27%, grade F, #1,445 of 1,662 statewide, top 88%, 976 students, 90% FRL); C C Winn H S (math 16% / reading 40%, grade F, #1,170 of 1,632 statewide, top 72%, 2,001 students, 86% FRL) — zoned schools average 90% FRL vs 32% district-wide (58 pts higher); higher-poverty schools than district average — tighter screening recommended.
- Market conditions: 8 active listings in the ZIP; 66 units permitted in Maverick County in 2024 (0 in 5+ unit buildings).
Forward outlook
- In year one you build about $3k of equity ($615 loan paydown + $3k appreciation (3.0% local appreciation)).
- Maverick County population projected at +18% by 2050 — long-run rental-demand tailwind backs the buy-and-hold thesis.
- At projected returns (3.0% appreciation + 3.0% rent growth), your $25k cash investment doubles in ~4 years — after that, you're playing with house money.
- By year 10, paydown + projected appreciation supports a ~$32k cash-out refi (75% LTV) — recoverable capital for the next deal without selling this one.
Negotiation context
- Only 13 days on market — expect competitive offers; lowballing is unlikely to land.
Risks & watch-outs
- Climate carrying-cost: major wind risk, 27% chance of damaging wind over 30y; extreme-heat days projected 5→16/yr by 2055 (HVAC capex compounding) — expect insurance premiums to compound above CPI over the hold.
Questions for the listing agent
- Is there a deadline driving the sale (1031 exchange, divorce, estate, relocation)? That informs how much negotiation room exists.
- Schools are F-rated, which usually means shorter tenancies and higher turnover. Who's the typical renter profile here, and what's been the actual vacancy rate?
- What's the average days-on-market for RENTAL listings here right now (not sales)? A rising rental-DOM trend means longer vacancies and softer asking-rent achievability than the comps imply.
- What's the recent tenant-quality profile in this submarket — average credit score on applications, eviction rate, late-payment / NSF rate, and stable-employment percentage? A property-management company in the area should have these aggregated.
- How much new for-sale + rental construction is in the pipeline within 1–3 miles? Heavy new supply typically softens prices + rents 12–24 months out; constrained supply supports both.
Investment metrics
- 1% rule
- 1.26% ✓
- Cap rate
- 10.91%
- Cash-on-cash
- 16.50%
- DSCR
- 1.73
- GRM
- 6.6
CMA / ARV
No comps found within radius.
Projected returns pro-forma
3.0% appreciation · 3.0% rent growth · sell at horizon
- IRR
- 23.0%
- Equity multiple
- 2.30×
- Total profit
- $32,518
- Equity at exit
- $40,018
- IRR
- 23.9%
- Equity multiple
- 4.42×
- Total profit
- $85,152
- Equity at exit
- $61,673
Cash invested: $24,920 (down + closing). Projections, not guarantees.
Landlord ↔ Tenant lean methodology
- Overall (STATE)
- 87 Strongly Landlord-Friendly
- State Texas
- 87 Strongly Landlord-Friendly · R+5
- County
- — inherits STATE
- City
- — inherits STATE
ZIP-level market 78860
- Active inventory
- 8
- Price-to-rent
- 6.6×
Monthly cashflow live
- Estimated rent
- $1,122 medium interval (Pro) →
- Mortgage (P&I)
- −$467
- Tax from tax record
- −$40 /mo · $476/yr
- Insurance
- −$37
- HOA
- −$0
- Vacancy / Maint / Mgmt
- −$236
- Net cashflow
- $343
Break-even live
Sensitivity live
| Price | -10% $393 | -5% $368 | +0% $343 | +5% $317 | +10% $292 |
|---|---|---|---|---|---|
| Rent | -10% $254 | -5% $298 | +0% $343 | +5% $387 | +10% $431 |
| Rate | -1.0pp $387 | -0.5pp $365 | base $343 | +0.5pp $320 | +1.0pp $296 |
UW: 25.0% down · 7.5% · 30yr · 1.5% tax · 5.0% vac · 8.0% maint · 8.0% mgmt
Financing live
Cash to close
- Down payment
- $22,250
- Closing costs
- $2,670
- Reserves months
- —
- Total cash needed
- —
Loan-product check · same deal, 3 products live
Conventional
25% down · 7.5% · 30yr
- Down + closing
- —
- Monthly P&I
- —
- Monthly cashflow
- —
- DSCR
- —
- Eligible?
- —
Personal DTI + credit; lowest rate.
DSCR
20% down · 8.5% · 30yr
- Down + closing
- —
- Monthly P&I
- —
- Monthly cashflow
- —
- DSCR
- —
- Eligible?
- —
No personal income docs; deal must DSCR.
Hard money
10% down · 12.0% · 12mo
- Down + closing
- —
- Monthly P&I
- —
- Monthly cashflow
- —
- DSCR
- —
- Eligible?
- —
Short-term bridge; refi at stabilization.
Listing history 22 events
-
2026-06-21days on market $89,000 Active 13 DOM
-
2026-06-19days on market $89,000 Active 11 DOM
-
2026-06-18days on market $89,000 Active 10 DOM
-
2026-06-17days on market $89,000 Active 9 DOM
-
2026-06-16days on market $89,000 Active 8 DOM
-
2026-06-15days on market $89,000 Active 7 DOM
-
2026-06-14days on market $89,000 Active 5 DOM
-
2026-06-13days on market $89,000 Active 4 DOM
-
2026-06-10days on market $89,000 Active 2 DOM
-
2026-06-09days on market $89,000 Active 1 DOM
-
2026-06-08days on market $89,000 Active 580 DOM
-
2026-06-07days on market $89,000 Active 579 DOM
-
2026-06-05days on market $89,000 Active 576 DOM
-
2026-06-02days on market $89,000 Active 574 DOM
-
2026-06-01days on market $89,000 Active 573 DOM
-
2026-05-31days on market $89,000 Active 572 DOM
-
2026-05-30days on market $89,000 Active 571 DOM
-
2026-04-16price $89,000 993-char remark
-
2026-01-31price $89,900 993-char remark
-
2025-09-11price $99,900 993-char remark
-
2025-06-06price $105,000 993-char remark
-
2024-11-04$110,000 Active 993-char remark
ⓘ Source: listings_history table (triggers on properties + properties_extension) + one-shot
backfill from property_details.listing_events for pre-trigger history.
Tax reassessment forecast TX · Resets to sale price
- Current annual tax
- $476 · $40/mo
- Projected year-2 tax
- $1,629 · $136/mo
- Expected delta
- +$1,153/yr (+$96/mo · 242.2%)
ⓘ Screening estimate from a state-policy table — verify with the county assessor before closing.
Climate risk First Street
- Flood 1/10 Low FEMA zone X (unshaded) · 0% chance over 30 yrs
- Wildfire 2/10 Low
- Heat 8/10 Severe 5 d/yr ≥111°F today · 16 d/yr by 30 yrs out
- Wind 6/10 Major 27% chance of damaging wind over 30 yrs
- Air quality 1/10 Low 0 unhealthy d/yr today · 0 by 30 yrs out
Nearby sold comps map
Loading sold comps map…
Walkable amenities ~0.75 mi
Loading nearby amenities…
Taxation est. · year 1
- Rental income
- $13,460
- − Mortgage interest
- −$4,985
- − Property taxes
- −$476
- − Insurance
- −$445
- − Repairs & maintenance
- −$1,077
- − Management
- −$1,077
- − Depreciation
- −$2,589
- Taxable income
- $2,811
- Est. tax owed @ 24.0%
- −$675
- After-tax cash flow
- $3,437/yr
For passive investors: Depreciation is non-cash, so a rental often shows a tax loss while cash-flowing — sheltering income. Rental losses are passive: they offset passive income freely, and up to $25,000/yr can offset ordinary (W-2) income if you actively participate and your MAGI is under $100k (phasing out to $0 by $150k); unused losses carry forward. On sale, claimed depreciation is recaptured at up to 25%, and gains may owe capital-gains tax (a 1031 exchange can defer both). Figures are a year-1 estimate at your 24.0% rate — not tax advice; consult a CPA.
Schools (NCES district)
- District
- Eagle Pass ISD
- NCES district ID
- 4817730
- Math proficiency
- 15% ▼ -41.00%
- Reading proficiency
- 28% ▼ -18.00%
- Median HH income
- $32,967
- Composite
- 17.48/100
- National rank
- #9057
- State rank
- #774 of 826 in TX
Livability — El Indio
- Score
- 33/100
- State rank
- #1679
- US rank
- #27811
Category grades
Schools grade is shown separately in the Schools card above.
Census & demographics
- Census place
- El Indio, TX
Population outlook (Maverick County) Hauer SSP2
- Today (2025)
- 62,919 people
- By 2030
- 65,440 · +4.0%
- By 2040
- 70,229 · +11.6%
- By 2050
- 74,218 · +18.0%
- By 2075
- 80,765 · +28.4%
- By 2100
- 76,268 · +21.2%
Not yet ingested
- Political lean
- —
- Race & ethnicity
- —
- Common origin
- —
- Civics
- —
Market trends
- HPI YoY
- —
- Current HPI
- —
- Rent YoY
- —
- Metro
- —
- State GDP YoY
- ▲ 3.95%
- F500 in state
- 110
Industry mix (Fortune 500 HQ in TX)
| Industry | F500 HQs | Revenue |
|---|---|---|
| Energy | 16 | $1,198B |
|
||
| Technology | 5 | $198B |
|
||
| Engineering / Construction | 4 | $72B |
|
||
| Energy Services | 3 | $60B |
|
||
| Utilities | 3 | $41B |
|
||
| Healthcare | 2 | $330B |
|
||
Price history
1 event — show timeline
- 2024-11-04 Listed $89,000 LERA
Property tax history
+29.5%/yrLatest (2025): $476 · +8.6% YoY. Source: county tax records.
Cash-flow waterfall
monthlySold comps — $/sqft
last 12 mo · ≤1 miLoading sold comps…