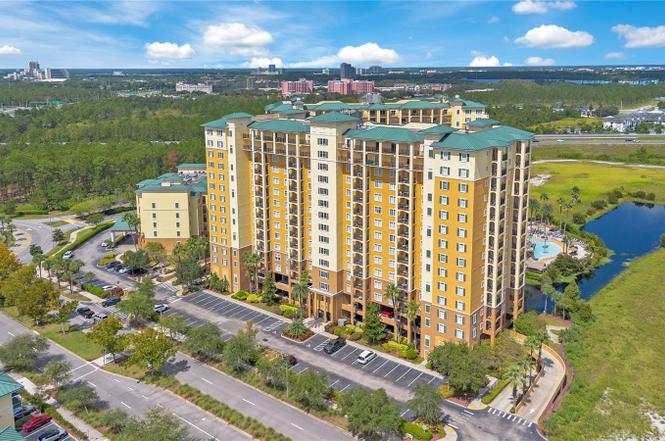
8101 Resort Vlg Dr #31004 · Hunters Creek, FL
Flood risk No data
- FEMA flood zone
- —
- Chance of flooding over 30 yrs
- —
- Est. flood insurance / yr
- —
Fire risk No data
- Est. fire insurance / yr
- —
Heat risk No data
- Hot days now (above threshold)
- —
- Hot days in 30 yrs
- —
Wind risk No data
- Chance of severe wind over 30 yrs
- —
Air-quality risk No data
- Unhealthy air days now
- —
- Unhealthy air days in 30 yrs
- —
Risk factors via First Street. Map © Google.
Why this score? — see what drove the D grade
The composite is a weighted blend of 9 inputs, each scored 0–100. Each bar is that input's sub-score; the figure is the points it added to the 100-point composite (weight × sub-score).
- 1% rule +8.6/10.0
- ARV discount +7.5/15.0
- Cash flow +7.1/30.0
- Appreciation +5.1/10.0
- Schools +4.1/10.0
- Livability +3.8/5.0
- Condition / age +2.5/5.0
- Rent growth +1.7/5.0
- DSCR +1.3/10.0
$160,000
🖨 Deal sheet (PDF) 📄 Offer letter ✓ Due diligence
Listing remarks
Amazing resort style condo just minutes from Disney World. Welcome to Lake Buena Vista Resort Village and Spa. This prime 2br/2ba unit is located on the 10th floor and overlooks the famous pirate ship pool. If you like vacationing in Orlando, and who doesn't, why pack into a small hotel room when you have your own spacious condo. The units feature a full kitchen with granite countertops, a large primary suite complete with a King size bed and walk in bath with separate shower and jacuzzi tub. The second bedroom has two full size beds and the living room has a sleeper sofa. The unit also has a washer dryer and separate storage closet. When you are not using it, let the onsite management comp
Key facts
- Walk in bath
- Washer dryer
- Resort style condo
Tags
Neighborhood map
What this means for you Summary
Snapshot
- This is a 2-bed/2.0-bath condo listed at $160k.
Deal economics
- At list price, monthly cash flow is $-229 ($-3k/yr) — negative.
- To cash-flow at today's rent, offer at most $120k (25.3% below list).
- Meets the 1% rule at list price ($2k rent vs $160k).
- Recommended offer: $120k (25.3% below list) — sets the bar for cash-flow.
- Cap rate 4.6% vs local median 3.0% in Hunters Creek — top-decile yield for the area; either an underpriced asset or a hidden risk that comps aren't pricing in. Stress-test before assuming the spread holds.
Location & tenants
- Location reads 76/100 on livability (#222 in FL, #3,277 nationally) — a middle-class / working-renter tenant base. Strengths: crime A+, housing A+, employment A; Watch: commute D, amenities F.
- Orange (suburban): math 46% / reading 51% proficiency, ranked #43 of 73 in FL (top 59%) — families likely to look elsewhere, expect single-tenant / working-renter base with shorter leases.
- Zoned schools: Tangelo Park Elementary (math 17% / reading 17%, grade F, #2,121 of 2,144 statewide, top 99%, 457 students, 83% FRL); Freedom Middle (math 43% / reading 43%, grade D-, #331 of 571 statewide, top 59%, 1,159 students, 44% FRL); Freedom High (math 28% / reading 43%, grade F, #367 of 667 statewide, top 57%, 2,623 students, 53% FRL) — zoned schools at 60% FRL track the district average.
- Zoned-school proficiency averages 32% at this address vs 48% district-wide (-17 pts) — the specific schools serving this property underperform the Orange average; the district grade overstates school quality for this exact location.
- Market conditions: Rents falling (-3.2%/yr); 281 active listings in the ZIP; 40 comparable units currently listed for rent nearby; rentals leasing fast (median 13d on market — plan ~1-2 weeks tenant-placement turnaround); 8,053 units permitted in Orange County in 2024 (3,133 in 5+ unit buildings).
- This rent runs 38% of the median local income ($69k/yr) — at the standard rent-burdened threshold; future hikes will face affordability resistance.
Forward outlook
- In year one you build about $2k of equity ($1k loan paydown + $475 appreciation (0.3% local appreciation)).
- Orange County population projected at +52% by 2050 — long-run rental-demand tailwind backs the buy-and-hold thesis.
Negotiation context
- It's been on market 198 days — a 12% lower offer ($141k) is reasonable based on typical stale-listing flexibility.
- Current owner paid $137k; 17% above their basis — modest negotiation headroom, anchor on the comps not their cost.
Risks & watch-outs
- Watch-outs: HOA is 37% of rent.
Questions for the listing agent
- What do current leases actually rent for vs. the listed asking? Can we see a recent rent roll and the last 12 months of T-12 income?
- It's been on market 198 days. Have you received any prior offers? Is the seller open to a 25% concession, seller financing, or rate buy-down credit?
- What does the HOA fee cover, when was the last increase, and are there any pending special assessments or reserve-fund shortfalls?
- Any open or pending special assessments — roof, HVAC, plumbing, elevator, façade? What's the per-unit balance and payoff schedule, and is the seller paying it off at close or rolling it to the buyer?
- Why hasn't it sold? Are there any deal-killer items the seller is aware of (foundation, flood, title, zoning, code violations)?
- Is there a deadline driving the sale (1031 exchange, divorce, estate, relocation)? That informs how much negotiation room exists.
- Schools are B-rated — typically a magnet for longer-tenancy family renters. What's the average tenant stay here, and is there a school-zone premium baked into asking?
- The area grade is low — what's the realistic commute time and amenity access for the typical tenant pool here? Any planned neighborhood developments (good or bad) we should know about?
- What's the average days-on-market for RENTAL listings here right now (not sales)? A rising rental-DOM trend means longer vacancies and softer asking-rent achievability than the comps imply.
- What's the recent tenant-quality profile in this submarket — average credit score on applications, eviction rate, late-payment / NSF rate, and stable-employment percentage? A property-management company in the area should have these aggregated.
- How much new apartment / multifamily construction is in the pipeline within 1–3 miles? Heavy new supply (>2% of stock underway) typically softens rents 12–24 months out; light construction supports rent growth.
Investment metrics
- 1% rule
- 1.36% ✓
- Cap rate
- 4.57%
- Cash-on-cash
- -6.14%
- DSCR
- 0.73
- GRM
- 6.1
CMA / ARV
No comps found within radius.
Projected returns pro-forma
0.3% appreciation · 0.0% rent growth · sell at horizon
- IRR
- -11.0%
- Equity multiple
- 0.49×
- Total profit
- $-22,870
- Equity at exit
- $48,848
- IRR
- -8.4%
- Equity multiple
- 0.16×
- Total profit
- $-37,620
- Equity at exit
- $60,659
Cash invested: $44,800 (down + closing). Projections, not guarantees.
Landlord ↔ Tenant lean methodology
- Overall (STATE)
- 87 Strongly Landlord-Friendly
- State Florida
- 87 Strongly Landlord-Friendly · R+3
- County
- — inherits STATE
- City
- — inherits STATE
ZIP-level market 32821
- Home prices YoY
- 0.1%
- Rents YoY
- -3.2%
- Active inventory
- 281
- Price-to-rent
- 6.1×
Monthly cashflow live
- Estimated rent
- $2,183 high interval (Pro) →
- Mortgage (P&I)
- −$839
- Tax from tax record
- −$235 /mo · $2,822/yr
- Insurance
- −$67
- HOA
- −$813
- Vacancy / Maint / Mgmt
- −$458
- Net cashflow
- $-229
Break-even live
Sensitivity live
| Price | -10% $-139 | -5% $-184 | +0% $-229 | +5% $-274 | +10% $-320 |
|---|---|---|---|---|---|
| Rent | -10% $-402 | -5% $-315 | +0% $-229 | +5% $-143 | +10% $-57 |
| Rate | -1.0pp $-149 | -0.5pp $-188 | base $-229 | +0.5pp $-271 | +1.0pp $-313 |
UW: 25.0% down · 7.5% · 30yr · 1.5% tax · 5.0% vac · 8.0% maint · 8.0% mgmt
Financing live
Cash to close
- Down payment
- $40,000
- Closing costs
- $4,800
- Reserves months
- —
- Total cash needed
- —
Loan-product check · same deal, 3 products live
Conventional
25% down · 7.5% · 30yr
- Down + closing
- —
- Monthly P&I
- —
- Monthly cashflow
- —
- DSCR
- —
- Eligible?
- —
Personal DTI + credit; lowest rate.
DSCR
20% down · 8.5% · 30yr
- Down + closing
- —
- Monthly P&I
- —
- Monthly cashflow
- —
- DSCR
- —
- Eligible?
- —
No personal income docs; deal must DSCR.
Hard money
10% down · 12.0% · 12mo
- Down + closing
- —
- Monthly P&I
- —
- Monthly cashflow
- —
- DSCR
- —
- Eligible?
- —
Short-term bridge; refi at stabilization.
Rent comps 40 comps
| Address | Beds | Baths | Sqft | Rent | $/sqft | DOM | Units | Dist |
|---|---|---|---|---|---|---|---|---|
| 8097 Poinciana Blvd Orlando, FL | 1.0–3.0 | 1.0–2.0 | 1075 | $2,394 | $2.23 | 0d | 29 | 0.07mi |
| 6011 Vineland Resort Way Orlando, FL | 1.0–3.0 | 1.0–2.0 | 1082 | $2,146 | $1.98 | 0d | 14 | 0.11mi |
| 7261 Crossroads Garden Dr Orlando, FL | 3.0 | 1.0–2.0 | 981 | $2,280 | $2.32 | 0d | 20 | 0.38mi |
| 4950 Lunar Ln Kissimmee, FL | 3.0 | 1.0–3.0 | 981 | $2,961 | $3.02 | 0d | 42 | 0.57mi |
| 14051 International Dr Orlando, FL | 1.0–3.0 | 1.0–2.0 | 1115 | $2,444 | $2.19 | 0d | 48 | 0.57mi |
| 3285 Peace Pipe Dr Kissimmee, FL | 3.0 | 2.0 | 1377 | $1,900 | $1.38 | 25d | 1 | 0.57mi |
| 5270 Warrior Ln Kissimmee, FL | 3.0 | 2.0 | 1123 | $1,995 | $1.78 | 25d | 1 | 0.67mi |
| 5212 Broken Arrow Dr Kissimmee, FL | 3.0 | 2.0 | 1377 | $2,250 | $1.63 | 25d | 1 | 0.71mi |
| 3251 Prime Park Cir Kissimmee, FL | 1.0–3.0 | 1.0–2.0 | 1020 | $2,096 | $2.05 | 0d | 21 | 0.82mi |
| 4865 Big Pine Loop Kissimmee, FL | 3.0 | 1.0–2.0 | 1023 | $2,827 | $2.76 | 4d | 320 | 0.83mi |
| 4865 Big Pine Loop Kissimmee, FL | 3.0 | 1.0–2.0 | 1023 | $2,955 | $2.89 | 16d | 127 | 0.83mi |
| 14501 Gateway Point Cir Orlando, FL | 1.0–4.0 | 1.0–2.0 | 1023 | $1,849 | $1.81 | 0d | 19 | 0.85mi |
| 5316 Barefoot Path Kissimmee, FL | 3.0 | 2.0 | 1410 | $2,100 | $1.49 | 25d | 1 | 0.91mi |
| 4741 Clock Tower Dr #107 Kissimmee, FL | 2.0 | 2.0 | 1186 | $2,800 | $2.36 | 25d | 1 | 0.98mi |
| 4701 Luminous Loop Kissimmee, FL | 1.0–3.0 | 1.0–2.0 | 973 | $1,978 | $2.03 | 0d | 34 | 1.01mi |
| 5087 Dominica Dr Kissimmee, FL | 2.0 | 2.5 | 1304 | $1,650 | $1.27 | 25d | 1 | 1.01mi |
| 5279 Images Cir #207 Kissimmee, FL | 2.0 | 1.0 | 774 | $979 | $1.26 | 25d | 1 | 1.02mi |
| 5095 Dominica Dr Kissimmee, FL | 2.0 | 3.0 | 1304 | $2,400 | $1.84 | 0d | 1 | 1.02mi |
| 5095 Dominica Dr Kissimmee, FL | 2.0 | 3.0 | 1304 | $2,400 | $1.84 | 12d | 1 | 1.02mi |
| 3111 Paradox Cir Unit 1018148P Kissimmee, FL | 3.0 | 2.0 | 1184 | $3,391 | $2.86 | 0d | 1 | 1.03mi |
| 3087 Seaview Castle Dr Unit 1549038P Kissimmee, FL | 3.0 | 3.0 | 1463 | $3,742 | $2.56 | 5d | 1 | 1.04mi |
| 4721 Clock Tower Dr Unit 1359866P Kissimmee, FL | 2.0 | 2.0 | 1184 | $3,280 | $2.77 | 4d | 1 | 1.04mi |
| 5283 Images Cir #304 Kissimmee, FL | 2.0 | 2.0 | 969 | $1,600 | $1.65 | 12d | 1 | 1.05mi |
| 5283 Images Cir #304 Kissimmee, FL | 2.0 | 2.0 | 969 | $1,600 | $1.65 | 25d | 1 | 1.05mi |
| 5002 Mangrove Aly #104 Kissimmee, FL | 2.0 | 2.0 | 1066 | $1,749 | $1.64 | 12d | 1 | 1.05mi |
| 5116 Dominica Dr Kissimmee, FL | 3.0 | 3.0 | 1394 | $2,100 | $1.51 | 0d | 1 | 1.06mi |
| 3120 Paradox Cir #108 Kissimmee, FL | 3.0 | 2.0 | 1329 | $2,600 | $1.96 | 25d | 1 | 1.08mi |
| 5299 Images Cir Kissimmee, FL | 1.0–3.0 | 1.0–3.0 | 1027 | $1,592 | $1.55 | 0d | 14 | 1.10mi |
| 3191 Paradox Cir Unit 205 Kissimmee, FL | 2.0 | 2.5 | 1126 | $2,500 | $2.22 | 25d | 1 | 1.10mi |
| 2954 Sadina St Kissimmee, FL | 2.0 | 2.5 | 885 | $1,500 | $1.69 | 5d | 2 | 1.12mi |
| 5404 Paradise Cay Cir Kissimmee, FL | 3.0 | 2.5 | 1364 | $2,000 | $1.47 | 25d | 1 | 1.13mi |
| 3171 Paradox Cir Unit 1UNIT 103 Kissimmee, FL | 2.0 | 2.0 | 1181 | $2,250 | $1.91 | 25d | 1 | 1.14mi |
| 3151 Paradox Cir Unit 1UNIT 202 Kissimmee, FL | 2.0 | 2.0 | 1181 | $2,700 | $2.29 | 25d | 1 | 1.16mi |
| 5492 Paradise Cay Cir Kissimmee, FL | 3.0 | 3.0 | 1337 | $2,200 | $1.65 | 25d | 1 | 1.21mi |
| 1110 Spaceport Ct Kissimmee, FL | 2.0 | 2.0 | 1052 | $2,000 | $1.90 | 25d | 1 | 1.21mi |
| 5311 Paradise Cay Cir Kissimmee, FL | 3.0 | 3.0 | 1187 | $1,700 | $1.43 | 9d | 1 | 1.21mi |
| 1024 Baseball and Boardwalk Ct Kissimmee, FL | 2.0 | 2.0 | 1052 | $2,000 | $1.90 | 25d | 1 | 1.23mi |
| 8815 Worldquest Blvd #2403 Orlando, FL | 2.0 | 2.0 | 1178 | $2,100 | $1.78 | 19d | 1 | 1.25mi |
| 15050 Ember Springs Cir Orlando, FL | 1.0–3.0 | 1.0–3.0 | 1066 | $1,938 | $1.82 | 0d | 29 | 1.33mi |
| 2904 Edenshire Way #106 Kissimmee, FL | 3.0 | 2.0 | 1300 | $2,650 | $2.04 | 25d | 1 | 1.35mi |
HOA detail condo
- Monthly dues
- $813 · $9,756/yr
- Likely covers
- pool
- Assessments
- None detected in remarks — confirm with the listing agent.
Listing history 5 events
-
2026-04-22status Pending
-
2026-03-23price $160,000
-
2025-12-22price $169,900
-
2025-10-05$175,000 Active
-
2009-12-02soldstatus $137,000
ⓘ Source: listings_history table (triggers on properties + properties_extension) + one-shot
backfill from property_details.listing_events for pre-trigger history.
Tax reassessment forecast FL · Resets to sale price
- Current annual tax
- $2,822 · $235/mo
- Projected year-2 tax
- $2,822 · $235/mo
- Expected delta
- $0/yr ($0/mo · 0.0%)
ⓘ Screening estimate from a state-policy table — verify with the county assessor before closing.
Nearby sold comps map
Loading sold comps map…
Walkable amenities ~0.75 mi
Loading nearby amenities…
Taxation est. · year 1
- Rental income
- $26,200
- − Mortgage interest
- −$8,962
- − Property taxes
- −$2,822
- − Insurance
- −$800
- − Repairs & maintenance
- −$2,096
- − Management
- −$2,096
- − HOA
- −$9,756
- − Depreciation
- −$4,655
- Taxable loss
- −$4,987
- Est. tax savings @ 24.0%
- +$1,197
- After-tax cash flow
- $-1,552/yr
For passive investors: Depreciation is non-cash, so a rental often shows a tax loss while cash-flowing — sheltering income. Rental losses are passive: they offset passive income freely, and up to $25,000/yr can offset ordinary (W-2) income if you actively participate and your MAGI is under $100k (phasing out to $0 by $150k); unused losses carry forward. On sale, claimed depreciation is recaptured at up to 25%, and gains may owe capital-gains tax (a 1031 exchange can defer both). Figures are a year-1 estimate at your 24.0% rate — not tax advice; consult a CPA.
Schools (NCES district)
- District
- Orange
- NCES district ID
- 1201440
- Math proficiency
- 46% ▼ -9.00%
- Reading proficiency
- 51% ▼ -2.00%
- Median HH income
- $49,350
- Composite
- 41.47/100
- National rank
- #3461
- State rank
- #43 of 73 in FL
Livability — Hunters Creek
- Score
- 76/100
- State rank
- #222
- US rank
- #3277
Category grades
Schools grade is shown separately in the Schools card above.
Census & demographics
- County
- Orange County · 1,471,359 people
- Metro
- Orlando-Kissimmee-Sanford, FL
- Population (ZIP)
- 26,161
- Household income
- $69,348
- Rent vs Own
- Severe rent burden
- 1840.0
Population outlook (Orange County) Hauer SSP2
- Today (2025)
- 1,618,226 people
- By 2030
- 1,787,404 · +10.5%
- By 2040
- 2,125,621 · +31.4%
- By 2050
- 2,454,016 · +51.6%
- By 2075
- 3,173,711 · +96.1%
- By 2100
- 3,607,781 · +122.9%
Race, ethnicity, and origin ACS 2023
- Neighborhood character
- Diverse neighborhood (Simpson 0.65)
- Race & ethnicity
- White 43% Hispanic / Latino 41% Two or more races 19% Black 6% Asian 3% Pacific Islander 1% Native American 1%
- Hispanic origin (detail)
- Mexican 3% Puerto Rican 11% Cuban 1% Dominican 4%
- Common ancestry
- Romanian 3% Lithuanian 2% Estonian 2%
- Foreign-born
- 29% · Canada, Jamaica, China
- Languages at home
- 58% English-only · Spanish 32% Other Indo-European 4% Other Asian/Pacific 2%
Political lean MEDSL · Orange
- 2024 margin
- D (+13.6) · D 56.1% · R 42.5% · Other 1.3%
- 2008→2024 swing
- -5.0pp toward R · 2008: 18.6pp · 2024: 13.6pp
- All cycles
- 2024: D+13.6 2020: D+23.1 2016: D+24.6 2012: D+18.2 2008: D+18.6
Not yet ingested
- Civics
- —
Market trends
- HPI YoY
- ▲ 0.30%
- Current HPI
- 300.2268
- Rent YoY
- ▼ -3.20%
- Metro
- Orlando-Kissimmee-Sanford, FL
- State GDP YoY
- ▲ 3.28%
- F500 in state
- 36
Industry mix (Fortune 500 HQ in FL)
| Industry | F500 HQs | Revenue |
|---|---|---|
| Industrial Technology | 2 | $29B |
|
||
| Insurance | 2 | $17B |
|
||
| Retail | 1 | $60B |
|
||
| Technology Distribution | 1 | $58B |
|
||
| Homebuilding | 1 | $35B |
|
||
| Technology Manufacturing | 1 | $35B |
|
||
Price history
+16.8% since first listed5 events — show timeline
- 2026-04-22 Pending — Stellar MLS as Distributed by MLS Grid
- 2026-03-23 Price Changed $160,000 Stellar MLS as Distributed by MLS Grid
- 2025-12-22 Price Changed $169,900 Stellar MLS as Distributed by MLS Grid
- 2025-10-05 Listed $175,000 Stellar MLS as Distributed by MLS Grid
- 2009-12-02 Sold (Public Records) $137,000 Public Records
Property tax history
+3.4%/yrLatest (2025): $2,822 · -4.1% YoY. Source: county tax records.
Cash-flow waterfall
monthlySold comps — $/sqft
last 12 mo · ≤1 miLoading sold comps…