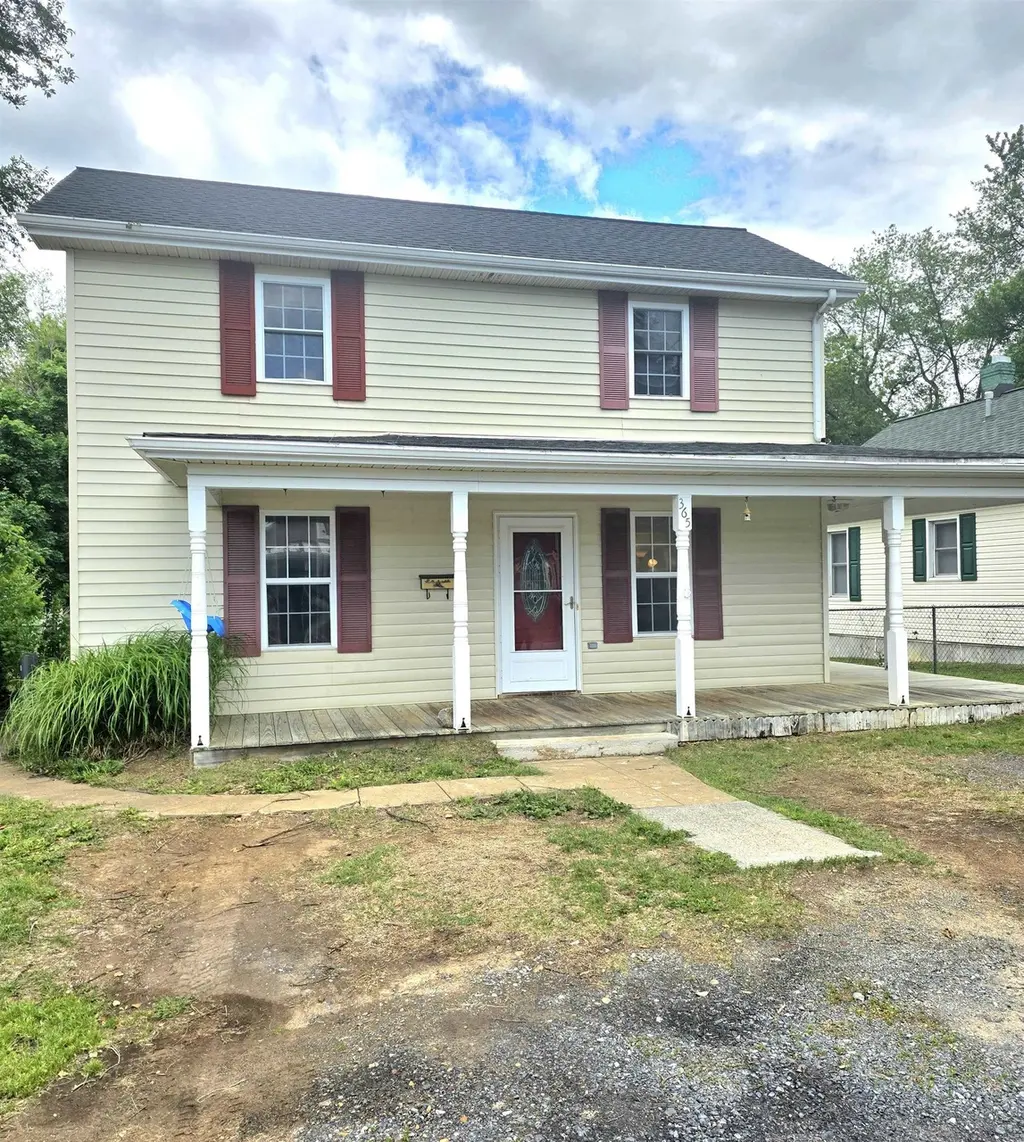
365 Magnolia Ave S · Waynesboro, VA
Flood risk 1/10 · Minimal
- FEMA flood zone
- X (unshaded)
- Chance of flooding over 30 yrs
- 0.0%
- Est. flood insurance / yr
- $507 – $1,088
Fire risk 2/10 · Minimal
- Est. fire insurance / yr
- $666 – $1,236
Heat risk 5/10 · Moderate
- Hot days now (above 100°F)
- 7 days/yr
- Hot days in 30 yrs
- 19 days/yr
Wind risk 2/10 · Minimal
- Chance of severe wind over 30 yrs
- 1.0%
Air-quality risk 1/10 · Minimal
- Unhealthy air days now
- 0 days/yr
- Unhealthy air days in 30 yrs
- 0 days/yr
Risk factors via First Street. Map © Google.
Why this score? — see what drove the D grade
The composite is a weighted blend of 9 inputs, each scored 0–100. Each bar is that input's sub-score; the figure is the points it added to the 100-point composite (weight × sub-score).
- Cash flow +12.5/30.0
- ARV discount +10.3/15.0
- Rent growth +4.7/5.0
- Schools +3.9/10.0
- DSCR +3.7/10.0
- Livability +3.7/5.0
- 1% rule +2.7/10.0
- Condition / age +2.5/5.0
- Appreciation +0.0/10.0
$260,000
🖨 Deal sheet (PDF) 📄 Offer letter ✓ Due diligence
Listing remarks MLS
ENTERED FOR COMPS ONLY.
Key facts
- Spacious deck
- Storage shed
- Roof replacement
Tags
Property features AI
Exterior
- Security: Surveillance system
- Utilities: Public water; Public sewer; Cable available; Fiber optic available
- Home design: Detached property; Two stories; Below-grade unfinished area present
- Construction: Stick-built construction; Block foundation; Built with above-grade finished area reported
- Exterior features: Deck; Lot approximately 0.17 acres
Interior
- Bathrooms: 2 full bathrooms; 1 half bathroom; 1 main-level bathroom
- Heating & cooling: Central heating; Central air conditioning
- Interior features: Surveillance system
Neighborhood map
What this means for you Summary
Snapshot
- This is a 3-bed/2.5-bath other listed at $260k.
Deal economics
- At list price, monthly cash flow is $-39 ($-466/yr) — negative.
- To cash-flow at today's rent, offer at most $253k (2.6% below list).
- To meet the 1% rule (rent ≥ 1% of price), the offer needs to be $199k (23.4% below list).
- Recommended offer: $199k (23.4% below list) — sets the bar for 1% rule.
- Cap rate 6.1% vs local median 3.3% in Waynesboro — top-decile yield for the area; either an underpriced asset or a hidden risk that comps aren't pricing in. Stress-test before assuming the spread holds.
Location & tenants
- Location reads 74/100 on livability (#155 in VA, #4,902 nationally) — a middle-class / working-renter tenant base. Strengths: cost of living A+, health & safety A+, housing A; Watch: employment D, commute F.
- Waynesboro City Public School District (urban): math 35% / reading 57% proficiency, ranked #108 of 131 in VA (top 82%) — families likely to look elsewhere, expect single-tenant / working-renter base with shorter leases.
- Zoned schools: Westwood Hills Elementary (math 42% / reading 67%, grade C, #650 of 1,108 statewide, top 62%, 384 students, 87% FRL); Kate Collins Middle (math 28% / reading 57%, grade D-, #291 of 342 statewide, top 86%, 644 students, 86% FRL); Waynesboro High (math 47% / reading 72%, grade C+, #247 of 319 statewide, top 80%, 905 students, 87% FRL) — zoned schools average 86% FRL vs 50% district-wide (36 pts higher); higher-poverty schools than district average — tighter screening recommended.
- Market conditions: Rents rising fast (+8.9%/yr); 304 active listings in the ZIP; 4 comparable units currently listed for rent nearby; rentals lingering (median 46d on market — plan ~5-8 weeks vacancy on turnover, expect pricing pressure); 100% of comp listings sitting > 30 days — soft ceiling on asking rent; 138 units permitted in Waynesboro city in 2024 (0 in 5+ unit buildings).
- This rent runs 37% of the median local income ($64k/yr) — at the standard rent-burdened threshold; future hikes will face affordability resistance.
Forward outlook
- Local home prices are declining (-3.0%/yr); year-one equity from $2k of loan paydown is wiped out by about $8k of value loss. Plan a longer hold.
- Waynesboro County population projected at +3% by 2050 — modest demand growth; plan on rents tracking national, not racing it.
Negotiation context
- It's been on market 37 days — a 3% lower offer ($252k) is reasonable based on typical stale-listing flexibility.
- 4 sale attempts since 16y ago; this cycle's ask has dropped $20k (7%) from the opening price — seller is motivated, your offer sets the floor, not the list.
- Current owner paid $140k; list at $260k implies a 86% gain — meaningful room to come down on a strong offer.
Risks & watch-outs
- Watch-outs: built in 1900 — expect roof / HVAC / electrical / plumbing capex.
- Climate carrying-cost: extreme-heat days projected 7→19/yr by 2055 (HVAC capex compounding) — expect insurance premiums to compound above CPI over the hold.
Questions for the listing agent
- What do current leases actually rent for vs. the listed asking? Can we see a recent rent roll and the last 12 months of T-12 income?
- It's been on market 37 days. Have you received any prior offers? Is the seller open to a 23% concession, seller financing, or rate buy-down credit?
- Built in 1900 — when were the roof, HVAC, electrical panel, plumbing, and water heater last replaced?
- Is there a deadline driving the sale (1031 exchange, divorce, estate, relocation)? That informs how much negotiation room exists.
- Schools are B-rated — typically a magnet for longer-tenancy family renters. What's the average tenant stay here, and is there a school-zone premium baked into asking?
- The area grade is low — what's the realistic commute time and amenity access for the typical tenant pool here? Any planned neighborhood developments (good or bad) we should know about?
- What's the average days-on-market for RENTAL listings here right now (not sales)? A rising rental-DOM trend means longer vacancies and softer asking-rent achievability than the comps imply.
- What's the recent tenant-quality profile in this submarket — average credit score on applications, eviction rate, late-payment / NSF rate, and stable-employment percentage? A property-management company in the area should have these aggregated.
- How much new for-sale + rental construction is in the pipeline within 1–3 miles? Heavy new supply typically softens prices + rents 12–24 months out; constrained supply supports both.
Investment metrics
- 1% rule
- 0.77% ✗
- Cap rate
- 6.11%
- Cash-on-cash
- -0.64%
- DSCR
- 0.97
- GRM
- 10.9
CMA / ARV
- ARV (median comp)
- $277,551
- List price
- $260,000
- Delta
- -6.32%
- Verdict
- FAIR
- Comps
- 20 within 1.0 mi
Projected returns pro-forma
-3.0% appreciation · 8.0% rent growth · sell at horizon
- IRR
- -12.5%
- Equity multiple
- 0.53×
- Total profit
- $-34,154
- Equity at exit
- $38,767
- IRR
- 2.4%
- Equity multiple
- 1.20×
- Total profit
- $14,674
- Equity at exit
- $22,480
Cash invested: $72,800 (down + closing). Projections, not guarantees.
Landlord ↔ Tenant lean methodology
- Overall (STATE)
- 55 Moderately Landlord-Leaning
- State Virginia
- 55 Moderately Landlord-Leaning · D+2
- County
- — inherits STATE
- City
- — inherits STATE
ZIP-level market 22980
- Rents YoY
- 8.9%
- Active inventory
- 304
- Price-to-rent
- 10.9×
Monthly cashflow live
- Estimated rent
- $1,993 medium interval (Pro) →
- Mortgage (P&I)
- −$1,363
- Tax from tax record
- −$141 /mo · $1,697/yr
- Insurance
- −$108
- HOA
- −$0
- Vacancy / Maint / Mgmt
- −$419
- Net cashflow
- $-39
Break-even live
Sensitivity live
| Price | -10% $108 | -5% $35 | +0% $-39 | +5% $-112 | +10% $-186 |
|---|---|---|---|---|---|
| Rent | -10% $-196 | -5% $-118 | +0% $-39 | +5% $40 | +10% $119 |
| Rate | -1.0pp $92 | -0.5pp $27 | base $-39 | +0.5pp $-106 | +1.0pp $-175 |
UW: 25.0% down · 7.5% · 30yr · 1.5% tax · 5.0% vac · 8.0% maint · 8.0% mgmt
Financing live
Cash to close
- Down payment
- $65,000
- Closing costs
- $7,800
- Reserves months
- —
- Total cash needed
- —
Loan-product check · same deal, 3 products live
Conventional
25% down · 7.5% · 30yr
- Down + closing
- —
- Monthly P&I
- —
- Monthly cashflow
- —
- DSCR
- —
- Eligible?
- —
Personal DTI + credit; lowest rate.
DSCR
20% down · 8.5% · 30yr
- Down + closing
- —
- Monthly P&I
- —
- Monthly cashflow
- —
- DSCR
- —
- Eligible?
- —
No personal income docs; deal must DSCR.
Hard money
10% down · 12.0% · 12mo
- Down + closing
- —
- Monthly P&I
- —
- Monthly cashflow
- —
- DSCR
- —
- Eligible?
- —
Short-term bridge; refi at stabilization.
Rent comps 4 comps
| Address | Beds | Baths | Sqft | Rent | $/sqft | DOM | Units | Dist |
|---|---|---|---|---|---|---|---|---|
| 129 Forever Ct Waynesboro, VA | 4.0 | 2.5 | 2014 | $2,195 | $1.09 | 45d | 1 | 0.99mi |
| 236 Willowshire Ct Waynesboro, VA | 3.0 | 3.0 | 1851 | $2,100 | $1.13 | 45d | 1 | 1.11mi |
| 113 Oakshire Ct Waynesboro, VA | 4.0 | 3.5 | 1851 | $2,285 | $1.23 | 45d | 1 | 1.15mi |
| 1048 Bridge Ave Waynesboro, VA | 2.0 | 2.0 | 1400 | $1,750 | $1.25 | 45d | 1 | 1.27mi |
Listing history 23 events
-
2026-06-21days on market $260,000 Active 37 DOM
-
2026-06-19days on market $260,000 Active 35 DOM
-
2026-06-18days on market $260,000 Active 34 DOM
-
2026-06-18price $260,000 Active 33 DOM
-
2026-06-17days on market $270,000 Active 33 DOM
-
2026-06-16days on market $270,000 Active 32 DOM
-
2026-06-15days on market $270,000 Active 31 DOM
-
2026-06-14days on market $270,000 Active 29 DOM
-
2026-06-13days on market $270,000 Active 28 DOM
-
2026-06-10days on market $270,000 Active 26 DOM
-
2026-06-09days on market $270,000 Active 25 DOM
-
2026-06-08days on market $270,000 Active 24 DOM
-
2026-06-07days on market $270,000 Active 23 DOM
-
2026-06-02days on market $270,000 Active 18 DOM
-
2026-06-01days on market $270,000 Active 17 DOM
-
2026-05-31days on market $270,000 Active 16 DOM
-
2026-05-30days on market $270,000 Active 15 DOM
-
2026-05-14$280,000 Active 845-char remark
-
2014-09-04soldstatus $140,000
Show marketing remark (23 chars)
ENTERED FOR COMPS ONLY.
-
2014-09-04$140,000
Show marketing remark (23 chars)
ENTERED FOR COMPS ONLY.
-
2014-09-04$140,000
Show marketing remark (23 chars)
ENTERED FOR COMPS ONLY.
-
2010-10-11historical
-
2010-04-10$149,400
ⓘ Source: listings_history table (triggers on properties + properties_extension) + one-shot
backfill from property_details.listing_events for pre-trigger history.
Tax reassessment forecast VA · Resets to sale price
- Current annual tax
- $1,697 · $141/mo
- Projected year-2 tax
- $2,132 · $178/mo
- Expected delta
- +$435/yr (+$36/mo · 25.7%)
ⓘ Screening estimate from a state-policy table — verify with the county assessor before closing.
Climate risk First Street
- Flood 1/10 Low FEMA zone X (unshaded) · 0% chance over 30 yrs
- Wildfire 2/10 Low
- Heat 5/10 Major 7 d/yr ≥100°F today · 19 d/yr by 30 yrs out
- Wind 2/10 Low 100% chance of damaging wind over 30 yrs
- Air quality 1/10 Low 0 unhealthy d/yr today · 0 by 30 yrs out
Nearby sold comps map
Loading sold comps map…
Walkable amenities ~0.75 mi
Loading nearby amenities…
Taxation est. · year 1
- Rental income
- $23,914
- − Mortgage interest
- −$14,564
- − Property taxes
- −$1,697
- − Insurance
- −$1,300
- − Repairs & maintenance
- −$1,913
- − Management
- −$1,913
- − Depreciation
- −$7,564
- Taxable loss
- −$5,036
- Est. tax savings @ 24.0%
- +$1,209
- After-tax cash flow
- $743/yr
For passive investors: Depreciation is non-cash, so a rental often shows a tax loss while cash-flowing — sheltering income. Rental losses are passive: they offset passive income freely, and up to $25,000/yr can offset ordinary (W-2) income if you actively participate and your MAGI is under $100k (phasing out to $0 by $150k); unused losses carry forward. On sale, claimed depreciation is recaptured at up to 25%, and gains may owe capital-gains tax (a 1031 exchange can defer both). Figures are a year-1 estimate at your 24.0% rate — not tax advice; consult a CPA.
Schools (NCES district)
- District
- Waynesboro City Public School District
- NCES district ID
- 5103930
- Math proficiency
- 35% ▼ -36.00%
- Reading proficiency
- 57% ▼ -10.00%
- Median HH income
- $43,171
- Composite
- 38.73/100
- National rank
- #4131
- State rank
- #108 of 131 in VA
Livability — Waynesboro
- Score
- 74/100
- State rank
- #155
- US rank
- #4902
Category grades
Schools grade is shown separately in the Schools card above.
Census & demographics
- Census place
- Waynesboro, VA
- County
- Waynesboro City · 32,965 people
- City population
- 32,965
- Metro
- Staunton, VA
- Population (ZIP)
- 32,965
- Household income
- $63,943
- Rent vs Own
- Severe rent burden
- 858.0
Population outlook (Waynesboro County) Hauer SSP2
- Today (2025)
- 22,329 people
- By 2030
- 22,567 · +1.1%
- By 2040
- 22,947 · +2.8%
- By 2050
- 23,061 · +3.3%
- By 2075
- 22,739 · +1.8%
- By 2100
- 21,058 · -5.7%
Race, ethnicity, and origin ACS 2023
- Neighborhood character
- Predominantly White (77%)
- Race & ethnicity
- White 77% Hispanic / Latino 9% Black 8% Two or more races 7% Asian 1%
- Hispanic origin (detail)
- Mexican 6% Puerto Rican 1%
- Common ancestry
- Slovak 2% Italian 2% Serbian 2%
- Foreign-born
- 5% · Canada, Vietnam
- Languages at home
- 93% English-only · Spanish 5% Vietnamese 1% Other Indo-European 1%
Political lean MEDSL · Waynesboro
- 2024 margin
- Lean R (+5.7) · D 46.5% · R 52.2% · Other 1.4%
- 2008→2024 swing
- +4.6pp toward D · 2008: -10.3pp · 2024: -5.7pp
- All cycles
- 2024: R+5.7 2020: R+5.1 2016: R+11.4 2012: R+10.9 2008: R+10.3
Not yet ingested
- Civics
- —
Market trends
- HPI YoY
- ▼ -216.72%
- Current HPI
- 183.3216
- Rent YoY
- ▲ 8.88%
- Metro
- Staunton, VA
- State GDP YoY
- ▲ 2.40%
- F500 in state
- 50
Industry mix (Fortune 500 HQ in VA)
| Industry | F500 HQs | Revenue |
|---|---|---|
| Aerospace / Defense | 4 | $236B |
|
||
| Technology / Defense | 3 | $32B |
|
||
| Financial Services | 2 | $176B |
|
||
| Utilities | 2 | $27B |
|
||
| Insurance | 2 | $25B |
|
||
| Technology | 2 | $15B |
|
||
Price history
+74.0% since first listed8 events — show timeline
- 2026-06-17 Price Changed $260,000 GAAR
- 2026-05-25 Price Changed $270,000 GAAR
- 2026-05-14 Listed $280,000 GAAR
- 2014-09-04 Listed $140,000 CAAR
- 2014-09-04 Listed $140,000 GAAR
- 2014-09-04 Sold (MLS) $140,000 GAAR
- 2010-10-11 Listing Removed — CAAR
- 2010-04-10 Listed $149,400 CAAR
Property tax history
+5.3%/yrLatest (2025): $1,697 · +13.8% YoY. Source: county tax records.
Cash-flow waterfall
monthlySold comps — $/sqft
last 12 mo · ≤1 miLoading sold comps…