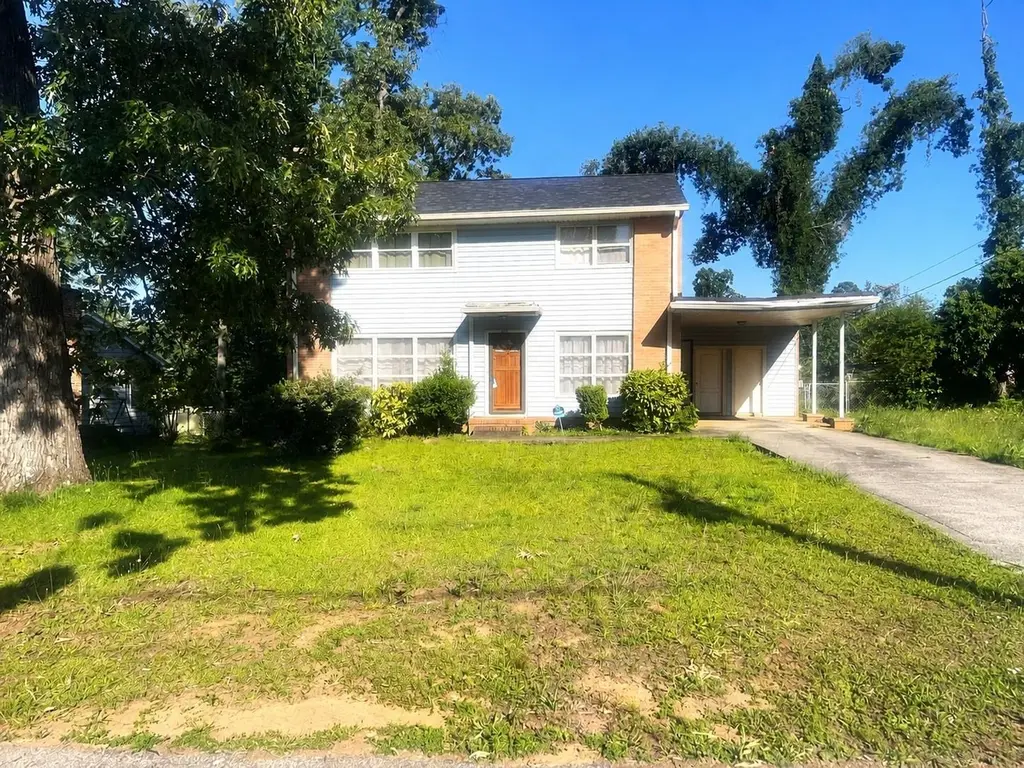
819 Pine Creek Dr · Gantt, SC
Flood risk 1/10 · Minimal
- FEMA flood zone
- X (unshaded)
- Chance of flooding over 30 yrs
- 0.0%
- Est. flood insurance / yr
- $507 – $1,088
Fire risk 1/10 · Minimal
- Est. fire insurance / yr
- $783 – $1,453
Heat risk 6/10 · Moderate
- Hot days now (above 102°F)
- 7 days/yr
- Hot days in 30 yrs
- 17 days/yr
Wind risk 2/10 · Minimal
- Chance of severe wind over 30 yrs
- 1.0%
Air-quality risk 4/10 · Minor
- Unhealthy air days now
- 4 days/yr
- Unhealthy air days in 30 yrs
- 4 days/yr
Risk factors via First Street. Map © Google.
Why this score? — see what drove the B- grade
The composite is a weighted blend of 9 inputs, each scored 0–100. Each bar is that input's sub-score; the figure is the points it added to the 100-point composite (weight × sub-score).
- Cash flow +24.5/30.0
- ARV discount +15.0/15.0
- DSCR +7.9/10.0
- 1% rule +5.1/10.0
- Schools +4.2/10.0
- Livability +3.5/5.0
- Rent growth +3.4/5.0
- Condition / age +2.5/5.0
- Appreciation +0.0/10.0
$175,000
🖨 Deal sheet 📄 Offer letter ✓ Due diligence
Listing remarks
This two story home is full of potential for buyers and investors alike! Formal living room with lots of sunlight and a fireplace. Formal dining room. Cozy second living room with built in cabinetry. Kitchen features real wood cabinetry. Half bathroom located downstairs. Up the stairs you will find three spacious bedrooms with overhead lighting share the hall bathroom. Attached carport. Partially fenced backyard. This home is waiting for someone to transform it! Property is being sold as-is, where-is via cash with a clear and marketable title. Reach out for more info today!
Key facts
- Real wood cabinetry
- Formal dining room
- Formal living room
Tags
Property features AI
Finance
- Other: Lot dimensions approximately 5.66 x 134 (approx. 0.24 acre)
- Financial info: Details not provided
- HOA & community: Details not provided
Exterior
- Parking: Attached parking; Carport; Driveway; Paved parking; One garage space
- Security: Details not provided
- Utilities: Public water; Public sewer
- Home design: Single-family residence; Two stories; Residential property
- Construction: Brick veneer; Vinyl siding; Wood siding; Slab foundation
- Exterior features: Fenced yard
Interior
- Kitchen: Details not provided
- Bedrooms: Details not provided
- Flooring: Carpet; Vinyl; Hardwood; See remarks
- Bathrooms: One full bathroom; One half bathroom
- Heating & cooling: Details not provided
- Interior features: Laminate counters; Built-in bookcases; One fireplace
- Laundry & utility: Details not provided
Neighborhood map
What this means for you Summary
Snapshot
- This is a 3-bed/1.5-bath single-family listed at $175k.
Deal economics
- At list price, monthly cash flow is $359 ($4k/yr) — positive.
- The deal already cash-flows at list — no discount required.
- Meets the 1% rule at list price ($2k rent vs $175k).
- Cap rate 8.8% vs local median 4.1% in Gantt — top-decile yield for the area; either an underpriced asset or a hidden risk that comps aren't pricing in. Stress-test before assuming the spread holds.
Location & tenants
- Location reads 69/100 on livability (#73 in SC) — a middle-class / working-renter tenant base. Strengths: cost of living A+, housing A+, commute B+; Watch: crime D+, amenities F, employment F.
- Greenville 01 (suburban): math 44% / reading 54% proficiency, ranked #10 of 80 in SC (top 12%) — families likely to look elsewhere, expect single-tenant / working-renter base with shorter leases.
- Zoned schools: Southside High (math 25% / reading 64%, grade F, #166 of 196 statewide, top 87%, 1,041 students, 100% FRL) — zoned schools average 100% FRL vs 42% district-wide (58 pts higher); higher-poverty schools than district average — tighter screening recommended.
- Market conditions: Rents rising (+3.7%/yr); 398 active listings in the ZIP; 10 comparable units currently listed for rent nearby; rentals at typical pace (median 14d on market — plan ~3-4 weeks tenant-placement turnaround); 5,595 units permitted in Greenville County in 2024 (566 in 5+ unit buildings).
- This rent runs 32% of the median local income ($66k/yr) — at the standard rent-burdened threshold; future hikes will face affordability resistance.
Forward outlook
- Local home prices are declining (-3.0%/yr); year-one equity from $1k of loan paydown is wiped out by about $5k of value loss. Plan a longer hold.
- Greenville County population projected at +34% by 2050 — long-run rental-demand tailwind backs the buy-and-hold thesis.
Negotiation context
- Only 2 days on market — expect competitive offers; lowballing is unlikely to land.
- Current owner paid $46k; list at $175k implies a 285% gain — meaningful room to come down on a strong offer.
Risks & watch-outs
- Climate carrying-cost: extreme-heat days projected 7→17/yr by 2055 (HVAC capex compounding) — expect insurance premiums to compound above CPI over the hold.
Questions for the listing agent
- Built in 1962 — when were the roof, HVAC, electrical panel, plumbing, and water heater last replaced?
- Is there a deadline driving the sale (1031 exchange, divorce, estate, relocation)? That informs how much negotiation room exists.
- Schools are F-rated, which usually means shorter tenancies and higher turnover. Who's the typical renter profile here, and what's been the actual vacancy rate?
- Crime grade is D in this area — have there been break-ins, vandalism, or insurance claims at this property in the last 3 years? What carrier currently insures it and at what premium?
- What's the average days-on-market for RENTAL listings here right now (not sales)? A rising rental-DOM trend means longer vacancies and softer asking-rent achievability than the comps imply.
- What's the recent tenant-quality profile in this submarket — average credit score on applications, eviction rate, late-payment / NSF rate, and stable-employment percentage? A property-management company in the area should have these aggregated.
- How much new for-sale + rental construction is in the pipeline within 1–3 miles? Heavy new supply typically softens prices + rents 12–24 months out; constrained supply supports both.
Investment metrics
- 1% rule
- 1.01% ✓
- Cap rate
- 8.75%
- Cash-on-cash
- 8.79%
- DSCR
- 1.39
- GRM
- 8.3
CMA / ARV
- ARV (on-the-fly)
- $253,968
- Comps found
- 4
Show comp detail 4 sales within ~0.75 mi
| Address | Dist | Beds/Ba | Sqft | Sold | Price | $/sf | Match |
|---|---|---|---|---|---|---|---|
| 813 Pine Creek Dr | 0.05mi | 3/1.5 | 1,713 (-0%) | 13mo | $214,000 | $125 | 86 |
| 8 Cliffside Dr | 0.51mi | 3/1.5 | 1,828 (+6%) | 16mo | $215,000 | $118 | 52 |
| 504 Mills Hill Way | 0.69mi | 4/2.5 (+1) | 1,900 (+11%) | 4mo | $282,000 | $148 | 38 |
| 1019 Jacobs Rd | 0.66mi | 3/2.5 | 1,973 (+15%) | 19mo | $529,900 | $269 | 24 |
Match score weights: distance 35% · size 25% · config 20% · recency 20%. Top-matched comps best support the ARV.
Projected returns pro-forma
-3.0% appreciation · 3.72% rent growth · sell at horizon
- IRR
- -2.3%
- Equity multiple
- 0.91×
- Total profit
- $-4,305
- Equity at exit
- $26,093
- IRR
- 8.0%
- Equity multiple
- 1.63×
- Total profit
- $30,687
- Equity at exit
- $15,131
Cash invested: $49,000 (down + closing). Projections, not guarantees.
Landlord ↔ Tenant lean methodology
- Overall (STATE)
- 90 Strongly Landlord-Friendly
- State South Carolina
- 90 Strongly Landlord-Friendly · R+6
- County
- — inherits STATE
- City
- — inherits STATE
ZIP-level market 29605
- Rents YoY
- 3.7%
- Active inventory
- 398
- Price-to-rent
- 8.3×
Monthly cashflow live
- Estimated rent
- $1,760 high interval (Pro) →
- Mortgage (P&I)
- −$918
- Tax from tax record
- −$41 /mo · $492/yr
- Insurance
- −$73
- HOA
- −$0
- Vacancy / Maint / Mgmt
- −$370
- Net cashflow
- $359
Break-even live
UW: 25.0% down · 7.5% · 30yr · 1.5% tax · 5.0% vac · 8.0% maint · 8.0% mgmt
Financing live
Cash to close
- Down payment
- $43,750
- Closing costs
- $5,250
- Reserves months
- —
- Total cash needed
- —
Loan-product check · same deal, 3 products live
Conventional
25% down · 7.5% · 30yr
- Down + closing
- —
- Monthly P&I
- —
- Monthly cashflow
- —
- DSCR
- —
- Eligible?
- —
Personal DTI + credit; lowest rate.
DSCR
20% down · 8.5% · 30yr
- Down + closing
- —
- Monthly P&I
- —
- Monthly cashflow
- —
- DSCR
- —
- Eligible?
- —
No personal income docs; deal must DSCR.
Hard money
10% down · 12.0% · 12mo
- Down + closing
- —
- Monthly P&I
- —
- Monthly cashflow
- —
- DSCR
- —
- Eligible?
- —
Short-term bridge; refi at stabilization.
Rent comps 10 comps
| Address | Beds | Baths | Sqft | Rent | $/sqft | DOM | Units | Dist |
|---|---|---|---|---|---|---|---|---|
| 304 Harvest Hill Ln Greenville, SC | 4.0 | 2.5 | 1900 | $1,900 | $1.00 | 11d | 1 | 0.69mi |
| 31 Foxhall Rd Greenville, SC | 3.0 | 1.0 | 1088 | $1,300 | $1.19 | 23d | 1 | 0.71mi |
| 15 Tasha Dr Greenville, SC | 3.0 | 1.5 | 1200 | $1,595 | $1.33 | 3d | 1 | 0.83mi |
| 41 E Castle Dr Greenville, SC | 4.0 | 2.5 | 1824 | $1,844 | $1.01 | 23d | 1 | 0.87mi |
| 429 Potomac Ave Greenville, SC | 3.0 | 1.0 | 1063 | $1,400 | $1.32 | 14d | 1 | 1.06mi |
| 9 Alpha Dr Greenville, SC | 3.0 | 2.0 | 1400 | $1,756 | $1.25 | 3d | 1 | 1.06mi |
| 608 S Fairfield Rd Greenville, SC | 3.0 | 2.0 | 1399 | $1,706 | $1.22 | 23d | 1 | 1.14mi |
| 32 Kay Dr Greenville, SC | 3.0 | 1.0 | 1073 | $1,549 | $1.44 | 3d | 1 | 1.27mi |
| 20 Eastview Dr Greenville, SC | 3.0 | 2.0 | 1299 | $1,600 | $1.23 | 23d | 1 | 1.31mi |
| 3104 Augusta St Greenville, SC | 2.0–3.0 | 2.0 | 1134 | $1,359 | $1.20 | 14d | 2 | 1.43mi |
Listing history 4 events
-
2026-06-13status $175,000 Pending 2 DOM
-
2026-06-10days on market $175,000 Active 2 DOM
-
2026-06-08remarks 580-char remark
-
2026-06-08$175,000 Active 1 DOM
ⓘ Source: listings_history table (triggers on properties + properties_extension) + one-shot
backfill from property_details.listing_events for pre-trigger history.
Tax reassessment forecast SC · Resets to sale price
- Current annual tax
- $492 · $41/mo
- Projected year-2 tax
- $998 · $83/mo
- Expected delta
- +$505/yr (+$42/mo · 102.7%)
ⓘ Screening estimate from a state-policy table — verify with the county assessor before closing.
Climate risk First Street
- Flood 1/10 Low FEMA zone X (unshaded) · 0% chance over 30 yrs
- Wildfire 1/10 Low
- Heat 6/10 Major 7 d/yr ≥102°F today · 17 d/yr by 30 yrs out
- Wind 2/10 Low 100% chance of damaging wind over 30 yrs
- Air quality 4/10 Moderate 4 unhealthy d/yr today · 4 by 30 yrs out
Nearby sold comps map
Loading sold comps map…
Walkable amenities ~0.75 mi
Loading nearby amenities…
Taxation est. · year 1
- Rental income
- $21,120
- − Mortgage interest
- −$9,803
- − Property taxes
- −$492
- − Insurance
- −$875
- − Repairs & maintenance
- −$1,690
- − Management
- −$1,690
- − Depreciation
- −$5,091
- Taxable income
- $1,480
- Est. tax owed @ 24.0%
- −$355
- After-tax cash flow
- $3,950/yr
For passive investors: Depreciation is non-cash, so a rental often shows a tax loss while cash-flowing — sheltering income. Rental losses are passive: they offset passive income freely, and up to $25,000/yr can offset ordinary (W-2) income if you actively participate and your MAGI is under $100k (phasing out to $0 by $150k); unused losses carry forward. On sale, claimed depreciation is recaptured at up to 25%, and gains may owe capital-gains tax (a 1031 exchange can defer both). Figures are a year-1 estimate at your 24.0% rate — not tax advice; consult a CPA.
Schools (NCES district)
- District
- Greenville 01
- NCES district ID
- 4502310
- Math proficiency
- 44% ▼ -10.00%
- Reading proficiency
- 54% ▼ -2.00%
- Median HH income
- $49,596
- Composite
- 41.88/100
- National rank
- #3370
- State rank
- #10 of 80 in SC
Livability — Gantt
- Score
- 69/100
- State rank
- #73
- US rank
- #8663
Category grades
Schools grade is shown separately in the Schools card above.
Census & demographics
- Census place
- Gantt, SC
- County
- Greenville County · 573,815 people
- City population
- 40,161
- Metro
- Greenville-Anderson, SC
- Population (ZIP)
- 40,717
- Household income
- $65,648
- Rent vs Own
- Severe rent burden
- 978.0
Population outlook (Greenville County) Hauer SSP2
- Today (2025)
- 574,580 people
- By 2030
- 615,615 · +7.1%
- By 2040
- 695,373 · +21.0%
- By 2050
- 769,367 · +33.9%
- By 2075
- 933,296 · +62.4%
- By 2100
- 1,029,196 · +79.1%
Race, ethnicity, and origin ACS 2023
- Neighborhood character
- Diverse neighborhood (Simpson 0.66)
- Race & ethnicity
- White 45% Black 32% Hispanic / Latino 17% Two or more races 8%
- Hispanic origin (detail)
- Mexican 11%
- Common ancestry
- Slovak 3% Serbian 2% Italian 2%
- Foreign-born
- 9% · Canada, Jamaica
- Languages at home
- 85% English-only · Spanish 13% Other Indo-European 1%
Political lean MEDSL · Greenville
- 2024 margin
- Strong R (+22.2) · D 38.0% · R 60.2% · Other 1.8%
- 2008→2024 swing
- +1.7pp toward D · 2008: -23.9pp · 2024: -22.2pp
- All cycles
- 2024: R+22.2 2020: R+18.2 2016: R+24.7 2012: R+27.8 2008: R+23.9
Not yet ingested
- Civics
- —
Market trends
- HPI YoY
- ▼ -591.71%
- Current HPI
- 231.6906
- Rent YoY
- ▲ 3.72%
- Metro
- Greenville-Anderson, SC
- State GDP YoY
- ▲ 4.51%
- F500 in state
- 2
Industry mix (Fortune 500 HQ in SC)
| Industry | F500 HQs | Revenue |
|---|---|---|
| Packaging | 1 | $7B |
|
||
Price history
+603.3% since first listed3 events — show timeline
- 2026-06-08 Listed $175,000 SPMLS
- 1987-07-14 Sold (Public Records) $45,500 Public Records
- 1987-06-01 Sold (Public Records) $24,883 Public Records
Property tax history
+2.3%/yrLatest (2025): $492 · +17.0% YoY. Source: county tax records.
Cash-flow waterfall
monthlySold comps — $/sqft
last 12 mo · ≤1 miLoading sold comps…