2015 Cains Mill Rd · Privateer, SC
Flood risk No data
- FEMA flood zone
- —
- Chance of flooding over 30 yrs
- —
- Est. flood insurance / yr
- —
Fire risk No data
- Est. fire insurance / yr
- —
Heat risk No data
- Hot days now (above threshold)
- —
- Hot days in 30 yrs
- —
Wind risk No data
- Chance of severe wind over 30 yrs
- —
Air-quality risk No data
- Unhealthy air days now
- —
- Unhealthy air days in 30 yrs
- —
Risk factors via First Street. Map © Google.
Why this score? — see what drove the F grade
The composite is a weighted blend of 9 inputs, each scored 0–100. Each bar is that input's sub-score; the figure is the points it added to the 100-point composite (weight × sub-score).
- Cash flow +8.8/30.0
- ARV discount +7.5/15.0
- Rent growth +3.5/5.0
- Livability +3.0/5.0
- 1% rule +2.7/10.0
- DSCR +2.4/10.0
- Schools +1.9/10.0
- Condition / age +0.5/5.0
- Appreciation +0.0/10.0
$199,999
🖨 Deal sheet (PDF) 📄 Offer letter ✓ Due diligence
Listing remarks
This house is built exclusively for the SC Housing "Made it Home! Program" Eligible home buyers may receive up to $25,000 in forgivable down payment and closing cost assistance through one of SC Housing's approved lending partners. Contact an approved SC Housing Lender for more info.
Key facts
- 1.02 acre lot
- Parking
- Built 2026
Neighborhood map
What this means for you Summary
Snapshot
- This is a 3-bed/2.0-bath other listed at $200k. Condition is rated poor.
Deal economics
- At list price, monthly cash flow is $-163 ($-2k/yr) — negative.
- To cash-flow at today's rent, offer at most $176k (11.8% below list).
- To meet the 1% rule (rent ≥ 1% of price), the offer needs to be $154k (22.9% below list).
- Recommended offer: $154k (22.9% below list) — sets the bar for 1% rule.
Location & tenants
- Location reads 59/100 on livability (#258 in SC) — a working-class tenant base; expect higher turnover. Strengths: cost of living A+, crime A-, housing A-; Watch: amenities F, commute F, employment F.
- Sumter 01 (urban): math 18% / reading 28% proficiency, ranked #64 of 80 in SC (top 80%) — low school quality limits family demand, transient renter base, plan for 1-2y turnover; 64% free/reduced lunch — lower-income household profile, screen leases tightly.
- Zoned schools: Pocalla Springs Elementary (math 14% / reading 17%, grade F, #539 of 597 statewide, top 91%, 652 students, 100% FRL); Furman Middle (math 9% / reading 23%, grade F, #196 of 229 statewide, top 87%, 729 students, 100% FRL); Lakewood High (math 12% / reading 67%, grade F, #180 of 196 statewide, top 93%, 1,036 students, 100% FRL) — zoned schools average 100% FRL vs 64% district-wide (36 pts higher); higher-poverty schools than district average — tighter screening recommended.
- Market conditions: Rents rising fast (+4.2%/yr); 238 active listings in the ZIP; 386 units permitted in Sumter County in 2024 (0 in 5+ unit buildings).
Forward outlook
- Local home prices are declining (-3.0%/yr); year-one equity from $1k of loan paydown is wiped out by about $6k of value loss. Plan a longer hold.
- Sumter County population projected at -14% by 2050 — secular population decline; favor cash flow + early exit over multi-decade hold.
Negotiation context
- Only 0 days on market — expect competitive offers; lowballing is unlikely to land.
Questions for the listing agent
- What do current leases actually rent for vs. the listed asking? Can we see a recent rent roll and the last 12 months of T-12 income?
- Have any recent inspections been done? Can we get a copy of the seller's disclosures and any deferred-maintenance estimates?
- Is there a deadline driving the sale (1031 exchange, divorce, estate, relocation)? That informs how much negotiation room exists.
- Schools are F-rated, which usually means shorter tenancies and higher turnover. Who's the typical renter profile here, and what's been the actual vacancy rate?
- The area grade is low — what's the realistic commute time and amenity access for the typical tenant pool here? Any planned neighborhood developments (good or bad) we should know about?
- What's the average days-on-market for RENTAL listings here right now (not sales)? A rising rental-DOM trend means longer vacancies and softer asking-rent achievability than the comps imply.
- What's the recent tenant-quality profile in this submarket — average credit score on applications, eviction rate, late-payment / NSF rate, and stable-employment percentage? A property-management company in the area should have these aggregated.
- How much new for-sale + rental construction is in the pipeline within 1–3 miles? Heavy new supply typically softens prices + rents 12–24 months out; constrained supply supports both.
Investment metrics
- 1% rule
- 0.77% ✗
- Cap rate
- 5.31%
- Cash-on-cash
- -3.50%
- DSCR
- 0.84
- GRM
- 10.8
CMA / ARV
No comps found within radius.
Projected returns pro-forma
-3.0% appreciation · 4.19% rent growth · sell at horizon
- IRR
- -20.8%
- Equity multiple
- 0.27×
- Total profit
- $-40,920
- Equity at exit
- $29,821
- IRR
- -11.7%
- Equity multiple
- 0.27×
- Total profit
- $-41,077
- Equity at exit
- $17,292
Cash invested: $56,000 (down + closing). Projections, not guarantees.
Landlord ↔ Tenant lean methodology
- Overall (STATE)
- 90 Strongly Landlord-Friendly
- State South Carolina
- 90 Strongly Landlord-Friendly · R+6
- County
- — inherits STATE
- City
- — inherits STATE
ZIP-level market 29154
- Home prices YoY
- -32.7%
- Rents YoY
- 4.2%
- Active inventory
- 238
- Price-to-rent
- 10.8×
Monthly cashflow live
- Estimated rent
- $1,543 medium interval (Pro) →
- Mortgage (P&I)
- −$1,049
- Tax est. 1.5%
- −$250 /mo · $3,000/yr
- Insurance
- −$83
- HOA
- −$0
- Vacancy / Maint / Mgmt
- −$324
- Net cashflow
- $-163
Break-even live
Sensitivity live
| Price | -10% $-25 | -5% $-94 | +0% $-163 | +5% $-232 | +10% $-302 |
|---|---|---|---|---|---|
| Rent | -10% $-285 | -5% $-224 | +0% $-163 | +5% $-102 | +10% $-41 |
| Rate | -1.0pp $-63 | -0.5pp $-112 | base $-163 | +0.5pp $-215 | +1.0pp $-268 |
UW: 25.0% down · 7.5% · 30yr · 1.5% tax · 5.0% vac · 8.0% maint · 8.0% mgmt
Financing live
Cash to close
- Down payment
- $50,000
- Closing costs
- $6,000
- Reserves months
- —
- Total cash needed
- —
Loan-product check · same deal, 3 products live
Conventional
25% down · 7.5% · 30yr
- Down + closing
- —
- Monthly P&I
- —
- Monthly cashflow
- —
- DSCR
- —
- Eligible?
- —
Personal DTI + credit; lowest rate.
DSCR
20% down · 8.5% · 30yr
- Down + closing
- —
- Monthly P&I
- —
- Monthly cashflow
- —
- DSCR
- —
- Eligible?
- —
No personal income docs; deal must DSCR.
Hard money
10% down · 12.0% · 12mo
- Down + closing
- —
- Monthly P&I
- —
- Monthly cashflow
- —
- DSCR
- —
- Eligible?
- —
Short-term bridge; refi at stabilization.
Listing history 2 events
-
2026-05-29$199,999
-
2026-05-29historical
ⓘ Source: listings_history table (triggers on properties + properties_extension) + one-shot
backfill from property_details.listing_events for pre-trigger history.
Nearby sold comps map
Loading sold comps map…
Walkable amenities ~0.75 mi
Loading nearby amenities…
Taxation est. · year 1
- Rental income
- $18,513
- − Mortgage interest
- −$11,203
- − Property taxes
- −$3,000
- − Insurance
- −$1,000
- − Repairs & maintenance
- −$1,481
- − Management
- −$1,481
- − Depreciation
- −$5,818
- Taxable loss
- −$5,470
- Est. tax savings @ 24.0%
- +$1,313
- After-tax cash flow
- $-647/yr
For passive investors: Depreciation is non-cash, so a rental often shows a tax loss while cash-flowing — sheltering income. Rental losses are passive: they offset passive income freely, and up to $25,000/yr can offset ordinary (W-2) income if you actively participate and your MAGI is under $100k (phasing out to $0 by $150k); unused losses carry forward. On sale, claimed depreciation is recaptured at up to 25%, and gains may owe capital-gains tax (a 1031 exchange can defer both). Figures are a year-1 estimate at your 24.0% rate — not tax advice; consult a CPA.
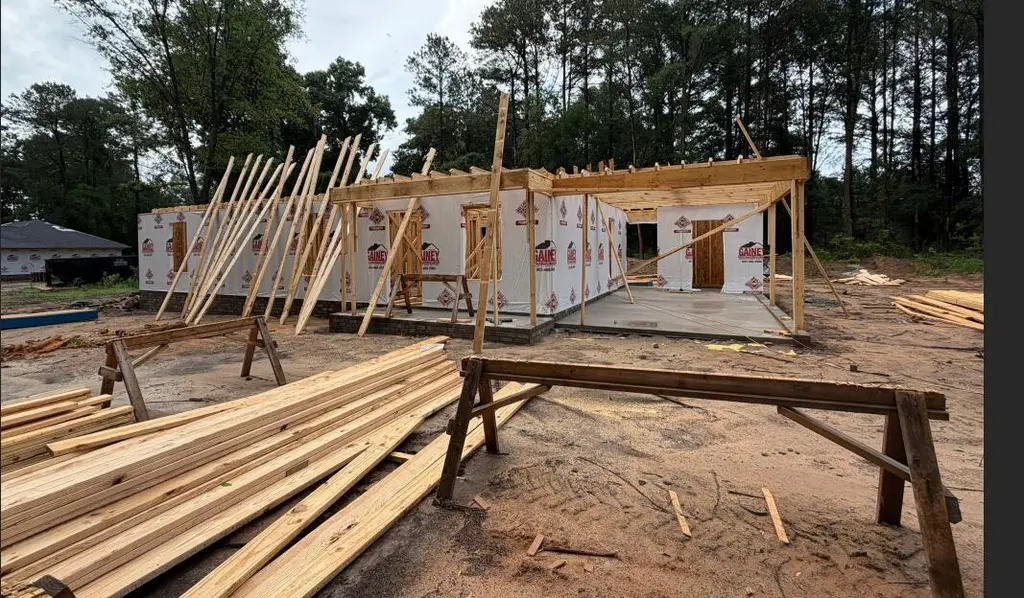
Condition & rehab AI · 4 photos
This property is under construction and requires extensive renovation to become move-in ready. The highest-ROI updates include completing the construction, finishing the interior, and enhancing the curb appeal.
Repairs flagged
- Major roof — Frame structure visible
- Major exterior — Frame structure visible
- Major interior walls — Frame structure visible
- Major HVAC/mechanicals — Frame structure visible
Value-add opportunities
- Both Complete construction and finish interior walls, flooring, and HVAC — Completion of construction will make the property move-in ready and suitable for both resale and rental
- Both Landscaping and curb appeal improvements — Enhanced curb appeal will attract more buyers and renters
- Both Kitchen and bathroom finishes — Completed kitchen and bathrooms will increase the property's appeal and functionality
- Both HVAC and electrical upgrades — Upgraded systems will improve comfort and energy efficiency, attracting more buyers and renters
Renovation cost estimate screening
| Repair item | Severity | Est. cost |
|---|---|---|
| roof · Frame structure visible | Major | $15,000–50,000 |
| exterior · Frame structure visible | Major | $15,000–50,000 |
| interior walls · Frame structure visible | Major | $15,000–50,000 |
| HVAC/mechanicals · Frame structure visible | Major | $15,000–50,000 |
| Total estimated repair cost · 4 items | $60,000–200,000 |
Value-add ROI direction
- Both Complete construction and finish interior walls, flooring, and HVAC — Completion of construction will make the property move-in ready and suitable for both resale and rental ↑
- Both Landscaping and curb appeal improvements — Enhanced curb appeal will attract more buyers and renters ↑
- Both Kitchen and bathroom finishes — Completed kitchen and bathrooms will increase the property's appeal and functionality ↑
- Both HVAC and electrical upgrades — Upgraded systems will improve comfort and energy efficiency, attracting more buyers and renters ↑
ⓘ Cost ranges are severity-bucket heuristics (US national rule-of-thumb). Get contractor quotes + a written scope before underwriting a rehab budget.
Schools (NCES district)
- District
- Sumter 01
- NCES district ID
- 4503902
- Math proficiency
- 18% ▼ -13.00%
- Reading proficiency
- 28% ▼ -6.00%
- Median HH income
- $40,423
- Composite
- 19.45/100
- National rank
- #8775
- State rank
- #64 of 80 in SC
Livability — Privateer
- Score
- 59/100
- State rank
- #258
- US rank
- #20541
Category grades
Schools grade is shown separately in the Schools card above.
Census & demographics
- County
- Sumter County · 76,912 people
- Metro
- Sumter, SC
- Population (ZIP)
- 29,454
- Household income
- $62,772
- Rent vs Own
- Severe rent burden
- 338.0
Population outlook (Sumter County) Hauer SSP2
- Today (2025)
- 104,585 people
- By 2030
- 102,282 · -2.2%
- By 2040
- 96,258 · -8.0%
- By 2050
- 89,592 · -14.3%
- By 2075
- 74,715 · -28.6%
- By 2100
- 60,235 · -42.4%
Race, ethnicity, and origin ACS 2023
- Neighborhood character
- Diverse neighborhood (Simpson 0.59)
- Race & ethnicity
- White 53% Black 36% Two or more races 8% Hispanic / Latino 4% Asian 1%
- Common ancestry
- Italian 2% Serbian 2% Slovak 2%
- Foreign-born
- 2% · Canada
- Languages at home
- 96% English-only · Spanish 2% Tagalog/Filipino 1%
Political lean MEDSL · Sumter
- 2024 margin
- Toss-up / Even · D 51.9% · R 47.0% · Other 1.2%
- 2008→2024 swing
- -10.6pp toward R · 2008: 15.4pp · 2024: 4.9pp
- All cycles
- 2024: D+4.9 2020: D+13.0 2016: D+12.0 2012: D+17.5 2008: D+15.4
Not yet ingested
- Civics
- —
Market trends
- HPI YoY
- ▼ -76.65%
- Current HPI
- 157.8545
- Rent YoY
- ▲ 4.19%
- Metro
- Sumter, SC
- State GDP YoY
- ▲ 4.51%
- F500 in state
- 2
Industry mix (Fortune 500 HQ in SC)
| Industry | F500 HQs | Revenue |
|---|---|---|
| Packaging | 1 | $7B |
|
||
Price history
2 events — show timeline
- 2026-05-29 Delisted — SBOR
- 2026-05-29 Listed $199,999 SBOR
Cash-flow waterfall
monthlySold comps — $/sqft
last 12 mo · ≤1 miLoading sold comps…