 Fourplex
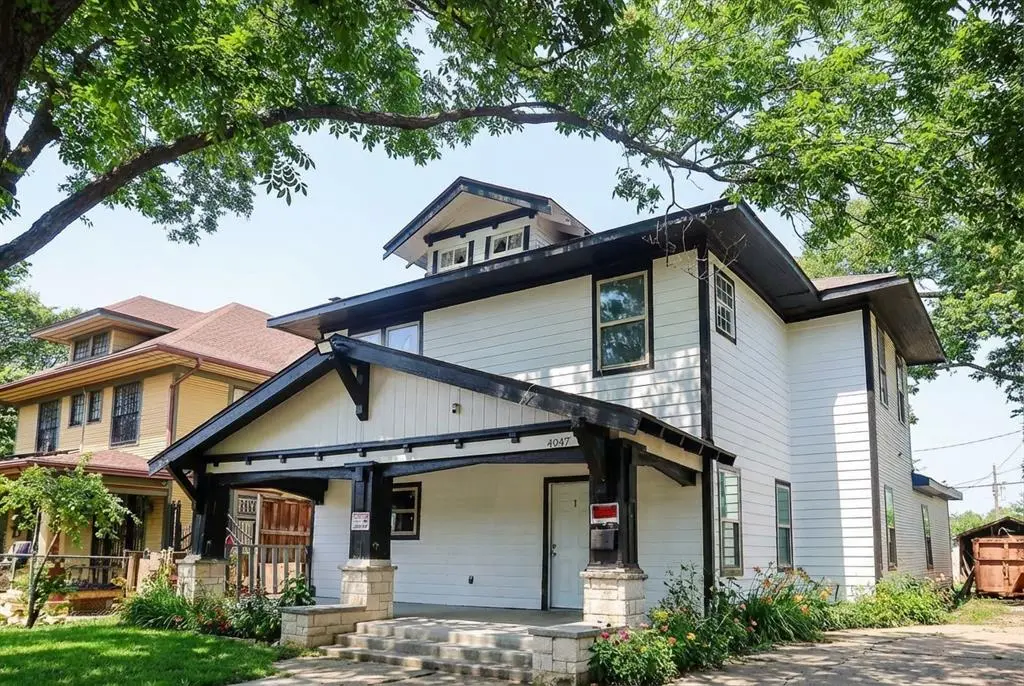
4947 E Side Ave · Dallas, TX
Flood risk 1/10 · Minimal
- FEMA flood zone
- X (unshaded)
- Chance of flooding over 30 yrs
- 0.0%
- Est. flood insurance / yr
- $507 – $1,088
Fire risk 1/10 · Minimal
- Est. fire insurance / yr
- $1,222 – $2,270
Heat risk 7/10 · Major
- Hot days now (above 109°F)
- 7 days/yr
- Hot days in 30 yrs
- 23 days/yr
Wind risk 6/10 · Moderate
- Chance of severe wind over 30 yrs
- 27.0%
Air-quality risk 3/10 · Minor
- Unhealthy air days now
- 2 days/yr
- Unhealthy air days in 30 yrs
- 3 days/yr
Risk factors via First Street. Map © Google.
Why this score? — see what drove the C+ grade
The composite is a weighted blend of 9 inputs, each scored 0–100. Each bar is that input's sub-score; the figure is the points it added to the 100-point composite (weight × sub-score).
- Cash flow +26.1/30.0
- DSCR +8.8/10.0
- ARV discount +7.5/15.0
- 1% rule +6.4/10.0
- Livability +4.0/5.0
- Rent growth +3.0/5.0
- Schools +2.8/10.0
- Condition / age +2.5/5.0
- Appreciation +0.0/10.0
$860,000
🖨 Deal sheet 📄 Offer letter ✓ Due diligence
Multi-family units
County records classify this as Multi-Family (5+ Unit). Listing-text estimate: 4 units. estimate disagrees with records
5+ unit building — per-unit beds/baths from public records are typically unavailable; the breakdown below (if shown) is an estimate from the listing text.
Listing remarks MLS
Completely remodeled quadruplex property in the heart of Old East Dallas! This 4-unit multi-family home was thoroughly updated in 2024 with nearly everything replaced or modernized, including a new HVAC system, foundation leveled and repaired, new siding, roof, decking, fresh interior and exterior paint, flooring, drywall, upgraded electrical, new plumbing lines, water heaters, kitchen cabinets, and interior doors. Excellent opportunity for long-term rental income or a value-add investor — all major systems have been refreshed for years of return potential.
Key facts
- New drywall
- New siding
- New flooring
Tags
Neighborhood map
What this means for you Summary
Snapshot
- This is a 4 × 5-bed/5.0-bath units multifamily listed at $860k.
Deal economics
- At list price, monthly cash flow is $2k ($26k/yr) — positive. Per door: $540/mo.
- The deal already cash-flows at list — no discount required.
- Meets the 1% rule at list price ($10k rent vs $860k).
- Recommended offer: $757k (12.0% below list) — sets the bar for market timing.
- Cap rate 9.3% vs local median 2.3% in Dallas — top-decile yield for the area; either an underpriced asset or a hidden risk that comps aren't pricing in. Stress-test before assuming the spread holds.
Location & tenants
- Location reads 81/100 on livability (#24 in TX, #1,380 nationally) — a professional / high-income tenant draw. Strengths: amenities A+, commute A+, housing A+; Watch: schools C-, crime F.
- Dallas ISD (urban): math 31% / reading 36% proficiency, ranked #559 of 826 in TX (top 68%) — families likely to look elsewhere, expect single-tenant / working-renter base with shorter leases; 83% free/reduced lunch — lower-income household profile, screen leases tightly.
- Market conditions: Rents rising (+1.8%/yr); 270 active listings in the ZIP; 40 comparable units currently listed for rent nearby; rentals at typical pace (median 24d on market — plan ~3-4 weeks tenant-placement turnaround); 45% of comp listings sitting > 30 days — soft ceiling on asking rent; high-income renter base; 12,577 units permitted in Dallas County in 2024 (6,829 in 5+ unit buildings).
- At $9,764/mo this rent would consume 89% of the median local household income ($132k/yr) (locally 1464% of renters already pay >50% of income on rent) — very limited rent-growth headroom before tenants either downsize or default.
Forward outlook
- Local home prices are declining (-3.0%/yr); year-one equity from $6k of loan paydown is wiped out by about $26k of value loss. Plan a longer hold.
- Dallas County population projected at +35% by 2050 — long-run rental-demand tailwind backs the buy-and-hold thesis.
Negotiation context
- It's been on market 292 days — a 12% lower offer ($757k) is reasonable based on typical stale-listing flexibility.
- 5 sale attempts since 2y ago with the ask held roughly flat each time — persistent listings suggest the price (not the market) is what's stuck; bring a comps-based counter.
Risks & watch-outs
- Watch-outs: built in 1912 — expect roof / HVAC / electrical / plumbing capex.
- Climate carrying-cost: major wind risk, 27% chance of damaging wind over 30y; extreme-heat days projected 7→23/yr by 2055 (HVAC capex compounding) — expect insurance premiums to compound above CPI over the hold.
Questions for the listing agent
- It's been on market 292 days. Have you received any prior offers? Is the seller open to a 12% concession, seller financing, or rate buy-down credit?
- Can we see the unit-by-unit rent roll, current vacancy, and any below-market leases? What's the average tenancy length?
- What capital expenditures (roof, boiler, parking lot, exteriors) have been made in the last 5 years, and what's planned in the next 2?
- Built in 1912 — when were the roof, HVAC, electrical panel, plumbing, and water heater last replaced?
- Why hasn't it sold? Are there any deal-killer items the seller is aware of (foundation, flood, title, zoning, code violations)?
- Is there a deadline driving the sale (1031 exchange, divorce, estate, relocation)? That informs how much negotiation room exists.
- Crime grade is F in this area — have there been break-ins, vandalism, or insurance claims at this property in the last 3 years? What carrier currently insures it and at what premium?
- What's the average days-on-market for RENTAL listings here right now (not sales)? A rising rental-DOM trend means longer vacancies and softer asking-rent achievability than the comps imply.
- What's the recent tenant-quality profile in this submarket — average credit score on applications, eviction rate, late-payment / NSF rate, and stable-employment percentage? A property-management company in the area should have these aggregated.
- How much new apartment / multifamily construction is in the pipeline within 1–3 miles? Heavy new supply (>2% of stock underway) typically softens rents 12–24 months out; light construction supports rent growth.
Investment metrics
- 1% rule
- 1.14% ✓
- Cap rate
- 9.30%
- Cash-on-cash
- 10.76%
- DSCR
- 1.48
- GRM
- 7.3
CMA / ARV
- ARV (median comp)
- $561,101
- List price
- $860,000
- Delta
- 53.27%
- Verdict
- OVERPRICED
- Comps
- 20 within 1.0 mi
Show comp detail 4 sales within ~0.75 mi
| Address | Dist | Beds/Ba | Sqft | Sold | Price | $/sf | Match |
|---|---|---|---|---|---|---|---|
| 4742 Victor St | 0.31mi | 4/4.0 | 3,120 (+5%) | 11mo | $999,000 | $320 | 64 |
| 4814 Reiger Ave | 0.21mi | 5/4.0 (+1) | 3,188 (+7%) | 17mo | $750,000 | $235 | 55 |
| 5018 Victor St | 0.24mi | 4/2.0 | 2,842 (-4%) | 19mo | $579,000 | $204 | 54 |
| 5019 Worth St | 0.41mi | 4/4.0 | 2,560 (-14%) | 17mo | $485,000 | $189 | 40 |
Match score weights: distance 35% · size 25% · config 20% · recency 20%. Top-matched comps best support the ARV.
Projected returns pro-forma
-3.0% appreciation · 1.82% rent growth · sell at horizon
- IRR
- -1.5%
- Equity multiple
- 0.94×
- Total profit
- $-13,431
- Equity at exit
- $128,229
- IRR
- 6.9%
- Equity multiple
- 1.49×
- Total profit
- $119,042
- Equity at exit
- $74,357
Cash invested: $240,800 (down + closing). Projections, not guarantees.
Landlord ↔ Tenant lean methodology
- Overall (STATE)
- 87 Strongly Landlord-Friendly
- State Texas
- 87 Strongly Landlord-Friendly · R+5
- County
- — inherits STATE
- City
- — inherits STATE
ZIP-level market 75214
- Rents YoY
- 1.8%
- Active inventory
- 270
- Price-to-rent
- 29.4×
Monthly cashflow live
- Estimated rent
- $9,764 medium interval (Pro) →
- Mortgage (P&I)
- −$4,510
- Tax from tax record
- −$687 /mo · $8,242/yr
- Insurance
- −$358
- HOA
- −$0
- Vacancy / Maint / Mgmt
- −$2,050
- Net cashflow
- $2,159
Break-even live
4-unit breakdown (identical units grouped — click to expand)
| Units | Beds | Baths | Est. rent |
|---|---|---|---|
| 4× units | 5 | 5 | $9,764 |
| #1 | 5 | 5 | $2,441 |
| #2 | 5 | 5 | $2,441 |
| #3 | 5 | 5 | $2,441 |
| #4 | 5 | 5 | $2,441 |
| Total (4 units) | $9,764 | ||
UW: 25.0% down · 7.5% · 30yr · 1.5% tax · 5.0% vac · 8.0% maint · 8.0% mgmt
Financing live
Cash to close
- Down payment
- $215,000
- Closing costs
- $25,800
- Reserves months
- —
- Total cash needed
- —
Loan-product check · same deal, 3 products live
Conventional
25% down · 7.5% · 30yr
- Down + closing
- —
- Monthly P&I
- —
- Monthly cashflow
- —
- DSCR
- —
- Eligible?
- —
Personal DTI + credit; lowest rate.
DSCR
20% down · 8.5% · 30yr
- Down + closing
- —
- Monthly P&I
- —
- Monthly cashflow
- —
- DSCR
- —
- Eligible?
- —
No personal income docs; deal must DSCR.
Hard money
10% down · 12.0% · 12mo
- Down + closing
- —
- Monthly P&I
- —
- Monthly cashflow
- —
- DSCR
- —
- Eligible?
- —
Short-term bridge; refi at stabilization.
Rent comps 40 comps
| Address | Beds | Baths | Sqft | Rent | $/sqft | DOM | Units | Dist |
|---|---|---|---|---|---|---|---|---|
| 5316 East Side Ave Dallas, TX | 3.0 | 2.5 | 2000 | $3,900 | $1.95 | 7d | 1 | 0.27mi |
| 402 S Henderson Ave Dallas, TX | 4.0 | 4.0 | 2200 | $4,250 | $1.93 | 24d | 1 | 0.29mi |
| 4526 Reiger Ave Dallas, TX | 4.0 | 2.5 | 2728 | $3,000 | $1.10 | 24d | 1 | 0.39mi |
| 4717 Garland Ave Dallas, TX | 3.0 | 2.5 | 2356 | $3,000 | $1.27 | 43d | 1 | 0.42mi |
| 5227 Lindsley Ave Dallas, TX | 3.0 | 2.5 | 2250 | $3,999 | $1.78 | 43d | 1 | 0.45mi |
| 4807 Parry Ave Dallas, TX | 4.0 | 3.0 | 2024 | $2,800 | $1.38 | 43d | 1 | 0.53mi |
| 317 Alcalde St Unit 1018276P Dallas, TX | 4.0 | 2.5 | 2292 | $22,489 | $9.81 | 24d | 1 | 0.56mi |
| 4511 Junius St Dallas, TX | 3.0 | 3.5 | 2400 | $3,000 | $1.25 | 14d | 1 | 0.60mi |
| 4602 Sycamore St Dallas, TX | 4.0 | 3.5 | 3000 | $6,790 | $2.26 | 43d | 1 | 0.74mi |
| 4904 Live Oak St #1 Dallas, TX | 3.0 | 3.5 | 1961 | $2,599 | $1.33 | 43d | 1 | 0.74mi |
| 1005 Cavour Pl Unit 1 Dallas, TX | 3.0 | 3.5 | 2492 | $4,485 | $1.80 | 43d | 1 | 0.85mi |
| 312 S Glasgow Dr Dallas, TX | 3.0 | 2.5 | 2017 | $3,750 | $1.86 | 18d | 1 | 0.92mi |
| 4005 Gaston Ave Dallas, TX | 3.0 | 3.5 | 3400 | $8,000 | $2.35 | 43d | 1 | 0.95mi |
| 4005 Gaston Ave Ph 1 Dallas, TX | 3.0 | 3.5 | 3600 | $12,000 | $3.33 | 43d | 1 | 0.95mi |
| 807 S Glasgow Dr Dallas, TX | 3.0 | 2.5 | 2342 | $3,950 | $1.69 | 5d | 1 | 0.98mi |
| 805 S Glasgow Dr Dallas, TX | 3.0 | 2.5 | 2342 | $3,850 | $1.64 | 5d | 1 | 0.98mi |
| 1514 Holly Ave Dallas, TX | 3.0 | 3.5 | 2826 | $5,250 | $1.86 | 7d | 1 | 1.02mi |
| 6132 Victor St Dallas, TX | 3.0 | 2.0 | 1956 | $3,000 | $1.53 | 24d | 1 | 1.09mi |
| 4315 San Jacinto St Unit 101 Dallas, TX | 3.0 | 3.5 | 2700 | $3,900 | $1.44 | 43d | 1 | 1.14mi |
| 5713 Lewis St Dallas, TX | 3.0 | 3.0 | 2401 | $3,950 | $1.65 | 7d | 1 | 1.18mi |
| 1323 Saint Joseph St #19 Dallas, TX | 3.0 | 3.0 | 2150 | $2,750 | $1.28 | 43d | 1 | 1.21mi |
| 1913 Dowgate Ct Dallas, TX | 3.0 | 3.5 | 1982 | $4,200 | $2.12 | 24d | 1 | 1.25mi |
| 1961 Dowgate Ct Dallas, TX | 3.0 | 4.0 | 1984 | $4,000 | $2.02 | 43d | 1 | 1.25mi |
| 1952 Kearney Ct Dallas, TX | 3.0 | 3.5 | 2178 | $4,700 | $2.16 | 6d | 1 | 1.30mi |
| 4303 Roseland Ave Dallas, TX | 4.0 | 4.0 | 2436 | $6,950 | $2.85 | 16d | 1 | 1.30mi |
| 1910 N Carroll Ave Dallas, TX | 3.0 | 2.0 | 2448 | $2,995 | $1.22 | 43d | 1 | 1.32mi |
| 1910 N Carroll Ave Dallas, TX | 3.0 | 2.0 | 2448 | $2,550 | $1.04 | 20d | 1 | 1.32mi |
| 2011 Kirby St #105 Dallas, TX | 3.0 | 3.5 | 2530 | $4,390 | $1.74 | 43d | 1 | 1.32mi |
| 1847 Euclid Ave Dallas, TX | 3.0 | 2.5 | 2811 | $5,595 | $1.99 | 43d | 1 | 1.35mi |
| 4954 Camdale Ct Dallas, TX | 3.0 | 3.5 | 2392 | $5,200 | $2.17 | 6d | 1 | 1.35mi |
| 1907 Summit Ave #3 Dallas, TX | 3.0 | 3.0 | 2168 | $4,500 | $2.08 | 3d | 1 | 1.36mi |
| 4944 Camdale Ct Dallas, TX | 3.0 | 3.5 | 1936 | $3,995 | $2.06 | 43d | 1 | 1.36mi |
| 1512 Villars St Dallas, TX | 4.0 | 2.5 | 3009 | $8,000 | $2.66 | 20d | 1 | 1.39mi |
| 4119 Munger Ave Dallas, TX | 3.0 | 3.5 | 2341 | $4,399 | $1.88 | 43d | 1 | 1.40mi |
| 1922 Euclid Ave Unit C Dallas, TX | 3.0 | 2.5 | 2015 | $6,000 | $2.98 | 18d | 1 | 1.41mi |
| 4007 Brownstone Ct Dallas, TX | 3.0 | 3.5 | 2413 | $4,800 | $1.99 | 43d | 1 | 1.41mi |
| 3816 Roseland Ave Unit A200 Dallas, TX | 3.0 | 2.5 | 2150 | $3,950 | $1.84 | 15d | 1 | 1.42mi |
| 2211 Eriksson Ln Dallas, TX | 3.0 | 2.5 | 2000 | $4,500 | $2.25 | 43d | 1 | 1.43mi |
| 3028 Carmel St Dallas, TX | 3.0 | 3.5 | 1947 | $3,450 | $1.77 | 24d | 1 | 1.46mi |
| 3012 Carmel St Dallas, TX | 3.0 | 2.5 | 2024 | $3,500 | $1.73 | 11d | 1 | 1.49mi |
Listing history 33 events
-
2026-06-18days on market $860,000 Active 292 DOM
-
2026-06-17days on market $860,000 Active 291 DOM
-
2026-06-16days on market $860,000 Active 290 DOM
-
2026-06-15days on market $860,000 Active 289 DOM
-
2026-06-13days on market $860,000 Active 287 DOM
-
2026-06-09days on market $860,000 Active 283 DOM
-
2026-06-08days on market $860,000 Active 282 DOM
-
2026-06-07days on market $860,000 Active 281 DOM
-
2026-06-04days on market $860,000 Active 278 DOM
-
2026-06-03days on market $860,000 Active 277 DOM
-
2026-06-02days on market $860,000 Active 276 DOM
-
2026-06-02days on market $860,000 Active 275 DOM
-
2026-05-31days on market $860,000 Active 274 DOM
-
2026-01-05price $860,000 569-char remark
Show marketing remark (569 chars)
Completely remodeled quadruplex property in the heart of Old East Dallas! This 4-unit multi-family home was thoroughly updated in 2024 with nearly everything replaced or modernized, including a new HVAC system, foundation leveled and repaired, new siding, roof, decking, fresh interior and exterior paint, flooring, drywall, upgraded electrical, new plumbing lines, water heaters, kitchen cabinets, and interior doors. Excellent opportunity for long-term rental income or a value-add investor — all major systems have been refreshed for years of return potential.
-
2025-10-29price $889,999 569-char remark
Show marketing remark (569 chars)
Completely remodeled quadruplex property in the heart of Old East Dallas! This 4-unit multi-family home was thoroughly updated in 2024 with nearly everything replaced or modernized, including a new HVAC system, foundation leveled and repaired, new siding, roof, decking, fresh interior and exterior paint, flooring, drywall, upgraded electrical, new plumbing lines, water heaters, kitchen cabinets, and interior doors. Excellent opportunity for long-term rental income or a value-add investor — all major systems have been refreshed for years of return potential.
-
2025-10-18price $890,000 569-char remark
Show marketing remark (569 chars)
Completely remodeled quadruplex property in the heart of Old East Dallas! This 4-unit multi-family home was thoroughly updated in 2024 with nearly everything replaced or modernized, including a new HVAC system, foundation leveled and repaired, new siding, roof, decking, fresh interior and exterior paint, flooring, drywall, upgraded electrical, new plumbing lines, water heaters, kitchen cabinets, and interior doors. Excellent opportunity for long-term rental income or a value-add investor — all major systems have been refreshed for years of return potential.
-
2025-10-06price $895,000 569-char remark
Show marketing remark (569 chars)
Completely remodeled quadruplex property in the heart of Old East Dallas! This 4-unit multi-family home was thoroughly updated in 2024 with nearly everything replaced or modernized, including a new HVAC system, foundation leveled and repaired, new siding, roof, decking, fresh interior and exterior paint, flooring, drywall, upgraded electrical, new plumbing lines, water heaters, kitchen cabinets, and interior doors. Excellent opportunity for long-term rental income or a value-add investor — all major systems have been refreshed for years of return potential.
-
2025-09-25price $899,000 569-char remark
Show marketing remark (569 chars)
Completely remodeled quadruplex property in the heart of Old East Dallas! This 4-unit multi-family home was thoroughly updated in 2024 with nearly everything replaced or modernized, including a new HVAC system, foundation leveled and repaired, new siding, roof, decking, fresh interior and exterior paint, flooring, drywall, upgraded electrical, new plumbing lines, water heaters, kitchen cabinets, and interior doors. Excellent opportunity for long-term rental income or a value-add investor — all major systems have been refreshed for years of return potential.
-
2025-08-30$900,000 Active 569-char remark
Show marketing remark (569 chars)
Completely remodeled quadruplex property in the heart of Old East Dallas! This 4-unit multi-family home was thoroughly updated in 2024 with nearly everything replaced or modernized, including a new HVAC system, foundation leveled and repaired, new siding, roof, decking, fresh interior and exterior paint, flooring, drywall, upgraded electrical, new plumbing lines, water heaters, kitchen cabinets, and interior doors. Excellent opportunity for long-term rental income or a value-add investor — all major systems have been refreshed for years of return potential.
-
2025-08-25historical
-
2025-06-12$875,000 Active
-
2025-06-11historical
-
2025-03-02$895,000 Active
-
2025-03-01historical
-
2025-01-28price $865,000
-
2025-01-08price $785,000
-
2024-12-21$795,000 Active
-
2024-12-20historical
-
2024-11-05price $798,000
-
2024-07-24price $859,000
-
2024-06-28price $899,900
-
2024-06-20$975,000 Active
-
2023-02-22soldstatus
ⓘ Source: listings_history table (triggers on properties + properties_extension) + one-shot
backfill from property_details.listing_events for pre-trigger history.
Tax reassessment forecast TX · Resets to sale price
- Current annual tax
- $8,242 · $687/mo
- Projected year-2 tax
- $15,738 · $1,312/mo
- Expected delta
- +$7,496/yr (+$625/mo · 91.0%)
ⓘ Screening estimate from a state-policy table — verify with the county assessor before closing.
Climate risk First Street
- Flood 1/10 Low FEMA zone X (unshaded) · 0% chance over 30 yrs
- Wildfire 1/10 Low
- Heat 7/10 Severe 7 d/yr ≥109°F today · 23 d/yr by 30 yrs out
- Wind 6/10 Major 27% chance of damaging wind over 30 yrs
- Air quality 3/10 Moderate 2 unhealthy d/yr today · 3 by 30 yrs out
Nearby sold comps map
Loading sold comps map…
Walkable amenities ~0.75 mi
Loading nearby amenities…
Taxation est. · year 1
- Rental income
- $117,168
- − Mortgage interest
- −$48,173
- − Property taxes
- −$8,242
- − Insurance
- −$4,300
- − Repairs & maintenance
- −$9,373
- − Management
- −$9,373
- − Depreciation
- −$25,018
- Taxable income
- $12,688
- Est. tax owed @ 24.0%
- −$3,045
- After-tax cash flow
- $22,857/yr
For passive investors: Depreciation is non-cash, so a rental often shows a tax loss while cash-flowing — sheltering income. Rental losses are passive: they offset passive income freely, and up to $25,000/yr can offset ordinary (W-2) income if you actively participate and your MAGI is under $100k (phasing out to $0 by $150k); unused losses carry forward. On sale, claimed depreciation is recaptured at up to 25%, and gains may owe capital-gains tax (a 1031 exchange can defer both). Figures are a year-1 estimate at your 24.0% rate — not tax advice; consult a CPA.
Schools (NCES district)
- District
- Dallas ISD
- NCES district ID
- 4816230
- Math proficiency
- 31% ▼ -16.00%
- Reading proficiency
- 36% ▼ -4.00%
- Median HH income
- $42,881
- Composite
- 28.41/100
- National rank
- #6763
- State rank
- #559 of 826 in TX
Livability — Dallas
- Score
- 81/100
- State rank
- #24
- US rank
- #1380
Category grades
Schools grade is shown separately in the Schools card above.
Census & demographics
- Census place
- Dallas, TX
- County
- Dallas County · 2,612,404 people
- City population
- 1,168,437
- Metro
- Dallas-Fort Worth-Arlington, TX
- Population (ZIP)
- 34,274
- Household income
- $132,313
- Rent vs Own
- Severe rent burden
- 1464.0
Population outlook (Dallas County) Hauer SSP2
- Today (2025)
- 2,979,839 people
- By 2030
- 3,191,823 · +7.1%
- By 2040
- 3,619,611 · +21.5%
- By 2050
- 4,026,915 · +35.1%
- By 2075
- 4,957,073 · +66.4%
- By 2100
- 5,508,725 · +84.9%
Race, ethnicity, and origin ACS 2023
- Neighborhood character
- Predominantly White (71%)
- Race & ethnicity
- White 71% Hispanic / Latino 16% Two or more races 9% Black 7% Asian 2%
- Hispanic origin (detail)
- Mexican 11% Puerto Rican 1%
- Common ancestry
- Slovak 3% Italian 3% Serbian 3%
- Foreign-born
- 9% · Canada, China
- Languages at home
- 85% English-only · Spanish 12% Other Indo-European 1% French/Haitian/Cajun 1%
Political lean MEDSL · Dallas
- 2024 margin
- Strong D (+22.2) · D 60.2% · R 38.0% · Other 1.8%
- 2008→2024 swing
- +6.9pp toward D · 2008: 15.3pp · 2024: 22.2pp
- All cycles
- 2024: D+22.2 2020: D+31.6 2016: D+26.2 2012: D+15.4 2008: D+15.3
Not yet ingested
- Civics
- —
Market trends
- HPI YoY
- ▼ -988.15%
- Current HPI
- 320.9124
- Rent YoY
- ▲ 1.82%
- Metro
- Dallas-Fort Worth-Arlington, TX
- State GDP YoY
- ▲ 3.95%
- F500 in state
- 110
Industry mix (Fortune 500 HQ in TX)
| Industry | F500 HQs | Revenue |
|---|---|---|
| Energy | 16 | $1,198B |
|
||
| Technology | 5 | $198B |
|
||
| Engineering / Construction | 4 | $72B |
|
||
| Energy Services | 3 | $60B |
|
||
| Utilities | 3 | $41B |
|
||
| Healthcare | 2 | $330B |
|
||
Price history
-11.8% since first listed20 events — show timeline
- 2026-01-05 Price Changed $860,000 NTREIS
- 2025-10-29 Price Changed $889,999 NTREIS
- 2025-10-18 Price Changed $890,000 NTREIS
- 2025-10-06 Price Changed $895,000 NTREIS
- 2025-09-25 Price Changed $899,000 NTREIS
- 2025-08-30 Listed $900,000 NTREIS
- 2025-08-25 Listing Removed — NTREIS
- 2025-06-12 Listed $875,000 NTREIS
- 2025-06-11 Listing Removed — NTREIS
- 2025-03-02 Listed $895,000 NTREIS
- 2025-03-01 Listing Removed — NTREIS
- 2025-01-28 Price Changed $865,000 NTREIS
- 2025-01-08 Price Changed $785,000 NTREIS
- 2024-12-21 Listed $795,000 NTREIS
- 2024-12-20 Listing Removed — NTREIS
- 2024-11-05 Price Changed $798,000 NTREIS
- 2024-07-24 Price Changed $859,000 NTREIS
- 2024-06-28 Price Changed $899,900 NTREIS
- 2024-06-20 Listed $975,000 NTREIS
- 2023-02-22 Sold (Public Records) — Public Records
Property tax history
+5.0%/yrLatest (2025): $8,242 · -0.4% YoY. Source: county tax records.
Cash-flow waterfall
monthlySold comps — $/sqft
last 12 mo · ≤1 miLoading sold comps…