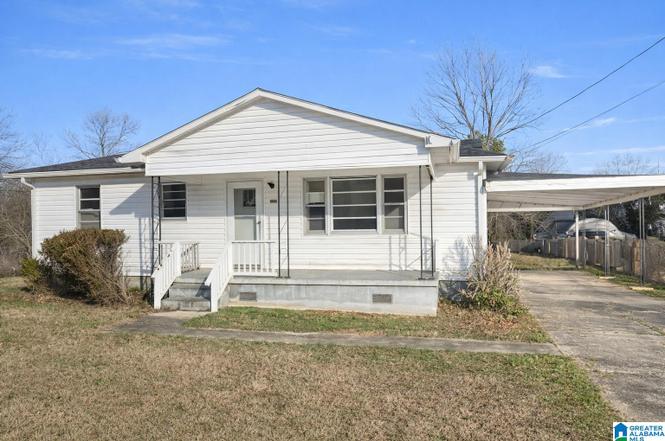
718 Bain Ave · Weaver, AL
Flood risk 1/10 · Minimal
- FEMA flood zone
- X (unshaded)
- Chance of flooding over 30 yrs
- 0.0%
- Est. flood insurance / yr
- $507 – $1,088
Fire risk 5/10 · Moderate
- Est. fire insurance / yr
- $916 – $1,700
Heat risk 6/10 · Moderate
- Hot days now (above 106°F)
- 7 days/yr
- Hot days in 30 yrs
- 19 days/yr
Wind risk 6/10 · Moderate
- Chance of severe wind over 30 yrs
- 27.0%
Air-quality risk 3/10 · Minor
- Unhealthy air days now
- 2 days/yr
- Unhealthy air days in 30 yrs
- 3 days/yr
Risk factors via First Street. Map © Google.
Why this score? — see what drove the B+ grade
The composite is a weighted blend of 9 inputs, each scored 0–100. Each bar is that input's sub-score; the figure is the points it added to the 100-point composite (weight × sub-score).
- Cash flow +30.0/30.0
- ARV discount +15.0/15.0
- 1% rule +10.0/10.0
- DSCR +10.0/10.0
- Livability +3.2/5.0
- Schools +2.9/10.0
- Rent growth +2.5/5.0
- Condition / age +2.5/5.0
- Appreciation +0.0/10.0
$70,759
🖨 Deal sheet (PDF) 📄 Offer letter ✓ Due diligence
Listing remarks
Value-add opportunity in an established Weaver neighborhood. This 2 bedroom 1 bath home offers a functional layout and presents potential for updates and improvements. Conveniently located near schools, shopping, dining, and major roadways. Ideal for buyers or investors looking to renovate and add value. Check it out!
Key facts
- Near schools
- Near dining
- Near shopping
Tags
Property features AI
Finance
- Other: Parcel ID available
- Financial info: Down payment assistance available
Exterior
- Parking: Attached parking; One carport space
- Utilities: Public water; Septic sewer; Electric water heater; Internet availability unknown
- Home design: Existing property (pre-built); Single-story living areas (main level rooms listed); No tri-level, split level, or split foyer
- Construction: Wood construction; Crawl space foundation
- Exterior features: Not waterfront; No pool; No patio, deck, or garden/patio listed; Lot view: none
Interior
- Kitchen: Laminate countertops; Electric oven
- Bedrooms: Two bedrooms on main level
- Flooring: Hardwood floors
- Bathrooms: One full bathroom with tub/shower combo
- Heating & cooling: Central heating; Central air conditioning
- Interior features: Smooth ceilings; No additional built-in interior features listed
- Laundry & utility: Main-level laundry room; Washer hookup; Electric dryer hookup; Electric water heater
Neighborhood map
What this means for you Summary
Snapshot
- This is a 2-bed/1.0-bath single-family listed at $71k.
Deal economics
- At list price, monthly cash flow is $488 ($6k/yr) — positive.
- The deal already cash-flows at list — no discount required.
- Meets the 1% rule at list price ($1k rent vs $71k).
- Recommended offer: $64k (9.0% below list) — sets the bar for market timing.
- Cap rate 14.6% vs local median 6.5% in Weaver — top-decile yield for the area; either an underpriced asset or a hidden risk that comps aren't pricing in. Stress-test before assuming the spread holds.
Location & tenants
- Location reads 63/100 on livability (#195 in AL) — a middle-class / working-renter tenant base. Strengths: cost of living A+, housing A+; Watch: employment C-, amenities F, commute F.
- Calhoun County (rural): math 19% / reading 49% proficiency, ranked #46 of 129 in AL (top 36%) — families likely to look elsewhere, expect single-tenant / working-renter base with shorter leases.
- Zoned schools: Weaver Elementary School (math 15% / reading 52%, grade F, #318 of 627 statewide, top 51%, 553 students, 73% FRL); Weaver High School (math 11% / reading 40%, grade F, #111 of 305 statewide, top 37%, 517 students, 67% FRL) — zoned schools average 70% FRL vs 49% district-wide (21 pts higher); higher-poverty schools than district average — tighter screening recommended.
- Market conditions: 31 active listings in the ZIP; 135 units permitted in Calhoun County in 2024 (0 in 5+ unit buildings).
Forward outlook
- Local home prices are declining (-3.0%/yr); year-one equity from $489 of loan paydown is wiped out by about $2k of value loss. Plan a longer hold.
- Calhoun County population projected at -21% by 2050 — secular population decline; favor cash flow + early exit over multi-decade hold.
- At projected returns (-3.0% appreciation + 3.0% rent growth), your $20k cash investment doubles in ~5 years — after that, you're playing with house money.
Negotiation context
- It's been on market 105 days — a 9% lower offer ($64k) is reasonable based on typical stale-listing flexibility.
- Current owner paid $60k; 18% above their basis — modest negotiation headroom, anchor on the comps not their cost.
Risks & watch-outs
- Climate carrying-cost: major wind risk, 27% chance of damaging wind over 30y; moderate wildfire risk; extreme-heat days projected 7→19/yr by 2055 (HVAC capex compounding) — expect insurance premiums to compound above CPI over the hold.
Questions for the listing agent
- It's been on market 105 days. Have you received any prior offers? Is the seller open to a 9% concession, seller financing, or rate buy-down credit?
- Built in 1960 — when were the roof, HVAC, electrical panel, plumbing, and water heater last replaced?
- Why hasn't it sold? Are there any deal-killer items the seller is aware of (foundation, flood, title, zoning, code violations)?
- Is there a deadline driving the sale (1031 exchange, divorce, estate, relocation)? That informs how much negotiation room exists.
- Schools are D-rated, which usually means shorter tenancies and higher turnover. Who's the typical renter profile here, and what's been the actual vacancy rate?
- What's the average days-on-market for RENTAL listings here right now (not sales)? A rising rental-DOM trend means longer vacancies and softer asking-rent achievability than the comps imply.
- What's the recent tenant-quality profile in this submarket — average credit score on applications, eviction rate, late-payment / NSF rate, and stable-employment percentage? A property-management company in the area should have these aggregated.
- How much new for-sale + rental construction is in the pipeline within 1–3 miles? Heavy new supply typically softens prices + rents 12–24 months out; constrained supply supports both.
Investment metrics
- 1% rule
- 1.63% ✓
- Cap rate
- 14.57%
- Cash-on-cash
- 29.57%
- DSCR
- 2.32
- GRM
- 5.1
CMA / ARV
- ARV (on-the-fly)
- $131,040
- Comps found
- 12
Show comp detail 12 sales within ~0.75 mi
| Address | Dist | Beds/Ba | Sqft | Sold | Price | $/sf | Match |
|---|---|---|---|---|---|---|---|
| 718 Bain Ave | 0.00mi | 2/1.0 | 1,040 (0%) | 1mo | $66,000 | $63 | 99 |
| 715 Cedar Springs Rd | 0.06mi | 3/1.0 (+1) | 1,066 (+2%) | 2mo | $133,500 | $125 | 86 |
| 603 Ledford St | 0.36mi | 3/1.0 (+1) | 1,044 (+0%) | 14mo | $115,000 | $110 | 66 |
| 707 Cedar Springs Rd | 0.10mi | 3/1.0 (+1) | 1,187 (+14%) | 6mo | $150,000 | $126 | 61 |
| 813 Cedar Springs Rd | 0.28mi | 2/1.0 | 960 (-8%) | 16mo | $115,000 | $120 | 61 |
| 504 Maumee Blvd | 0.38mi | 3/1.0 (+1) | 1,125 (+8%) | 6mo | $129,900 | $115 | 59 |
| 1027 Hillcrest Dr | 0.33mi | 3/2.0 (+1) | 1,140 (+10%) | 4mo | $173,400 | $152 | 56 |
| 807 Astor Ave | 0.71mi | 3/1.0 (+1) | 1,006 (-3%) | 2mo | $120,000 | $119 | 55 |
| 500 Maumee Blvd | 0.41mi | 3/1.5 (+1) | 1,161 (+12%) | 4mo | $174,800 | $151 | 51 |
| 717 Timber Way | 0.30mi | 3/2.0 (+1) | 1,142 (+10%) | 13mo | $180,000 | $158 | 50 |
| 1301 Hillcrest Dr | 0.73mi | 3/2.0 (+1) | 1,094 (+5%) | 0mo | $170,000 | $155 | 48 |
| 1205 Hillcrest Dr | 0.61mi | 3/1.5 (+1) | 1,104 (+6%) | 12mo | $148,000 | $134 | 44 |
Match score weights: distance 35% · size 25% · config 20% · recency 20%. Top-matched comps best support the ARV.
Projected returns pro-forma
-3.0% appreciation · 3.0% rent growth · sell at horizon
- IRR
- 24.0%
- Equity multiple
- 1.99×
- Total profit
- $19,602
- Equity at exit
- $10,550
- IRR
- 31.9%
- Equity multiple
- 3.88×
- Total profit
- $57,013
- Equity at exit
- $6,118
Cash invested: $19,813 (down + closing). Projections, not guarantees.
Landlord ↔ Tenant lean methodology
- Overall (STATE)
- 90 Strongly Landlord-Friendly
- State Alabama
- 90 Strongly Landlord-Friendly · R+15
- County
- — inherits STATE
- City
- — inherits STATE
ZIP-level market 36277
- Home prices YoY
- -17.7%
- Active inventory
- 31
- Price-to-rent
- 5.1×
Monthly cashflow live
- Estimated rent
- $1,156 medium interval (Pro) →
- Mortgage (P&I)
- −$371
- Tax from tax record
- −$25 /mo · $295/yr
- Insurance
- −$29
- HOA
- −$0
- Vacancy / Maint / Mgmt
- −$243
- Net cashflow
- $488
Break-even live
Sensitivity live
| Price | -10% $528 | -5% $508 | +0% $488 | +5% $468 | +10% $448 |
|---|---|---|---|---|---|
| Rent | -10% $397 | -5% $442 | +0% $488 | +5% $534 | +10% $579 |
| Rate | -1.0pp $524 | -0.5pp $506 | base $488 | +0.5pp $470 | +1.0pp $451 |
UW: 25.0% down · 7.5% · 30yr · 1.5% tax · 5.0% vac · 8.0% maint · 8.0% mgmt
Financing live
Cash to close
- Down payment
- $17,690
- Closing costs
- $2,123
- Reserves months
- —
- Total cash needed
- —
Loan-product check · same deal, 3 products live
Conventional
25% down · 7.5% · 30yr
- Down + closing
- —
- Monthly P&I
- —
- Monthly cashflow
- —
- DSCR
- —
- Eligible?
- —
Personal DTI + credit; lowest rate.
DSCR
20% down · 8.5% · 30yr
- Down + closing
- —
- Monthly P&I
- —
- Monthly cashflow
- —
- DSCR
- —
- Eligible?
- —
No personal income docs; deal must DSCR.
Hard money
10% down · 12.0% · 12mo
- Down + closing
- —
- Monthly P&I
- —
- Monthly cashflow
- —
- DSCR
- —
- Eligible?
- —
Short-term bridge; refi at stabilization.
Listing history 6 events
-
2026-04-27status Pending
-
2026-03-12price $70,759
-
2026-02-11price $76,912
-
2026-01-12$83,600 Active
-
2025-11-24price $93,600
-
2007-04-30soldstatus $60,000
ⓘ Source: listings_history table (triggers on properties + properties_extension) + one-shot
backfill from property_details.listing_events for pre-trigger history.
Tax reassessment forecast AL · Resets to sale price
- Current annual tax
- $295 · $25/mo
- Projected year-2 tax
- $295 · $25/mo
- Expected delta
- $0/yr ($0/mo · 0.0%)
ⓘ Screening estimate from a state-policy table — verify with the county assessor before closing.
Climate risk First Street
- Flood 1/10 Low FEMA zone X (unshaded) · 0% chance over 30 yrs
- Wildfire 5/10 Major
- Heat 6/10 Major 7 d/yr ≥106°F today · 19 d/yr by 30 yrs out
- Wind 6/10 Major 27% chance of damaging wind over 30 yrs
- Air quality 3/10 Moderate 2 unhealthy d/yr today · 3 by 30 yrs out
Nearby sold comps map
Loading sold comps map…
Walkable amenities ~0.75 mi
Loading nearby amenities…
Taxation est. · year 1
- Rental income
- $13,872
- − Mortgage interest
- −$3,964
- − Property taxes
- −$295
- − Insurance
- −$354
- − Repairs & maintenance
- −$1,110
- − Management
- −$1,110
- − Depreciation
- −$2,058
- Taxable income
- $4,982
- Est. tax owed @ 24.0%
- −$1,196
- After-tax cash flow
- $4,662/yr
For passive investors: Depreciation is non-cash, so a rental often shows a tax loss while cash-flowing — sheltering income. Rental losses are passive: they offset passive income freely, and up to $25,000/yr can offset ordinary (W-2) income if you actively participate and your MAGI is under $100k (phasing out to $0 by $150k); unused losses carry forward. On sale, claimed depreciation is recaptured at up to 25%, and gains may owe capital-gains tax (a 1031 exchange can defer both). Figures are a year-1 estimate at your 24.0% rate — not tax advice; consult a CPA.
Schools (NCES district)
- District
- Calhoun County
- NCES district ID
- 0100540
- Math proficiency
- 19% ▼ -26.00%
- Reading proficiency
- 49% ▬ 0.00%
- Median HH income
- $44,891
- Composite
- 28.91/100
- National rank
- #6635
- State rank
- #46 of 129 in AL
Livability — Weaver
- Score
- 63/100
- State rank
- #195
- US rank
- #15696
Category grades
Schools grade is shown separately in the Schools card above.
Census & demographics
- Census place
- Weaver, AL
- City population
- 5,153
- Population (ZIP)
- 5,153
Population outlook (Calhoun County) Hauer SSP2
- Today (2025)
- 109,765 people
- By 2030
- 105,708 · -3.7%
- By 2040
- 96,192 · -12.4%
- By 2050
- 86,413 · -21.3%
- By 2075
- 63,467 · -42.2%
- By 2100
- 44,704 · -59.3%
Race, ethnicity, and origin ACS 2023
- Neighborhood character
- Predominantly White (76%)
- Race & ethnicity
- White 76% Black 16% Hispanic / Latino 5% Two or more races 3%
- Hispanic origin (detail)
- Mexican 4%
- Common ancestry
- Italian 3% Portuguese 2% Slovak 2%
- Foreign-born
- 2% · Canada, South Korea
- Languages at home
- 97% English-only · Spanish 2%
Political lean MEDSL · Calhoun
- 2024 margin
- Solid R (+44.8) · D 27.2% · R 71.9%
- 2008→2024 swing
- -12.2pp toward R · 2008: -32.5pp · 2024: -44.8pp
- All cycles
- 2024: R+44.8 2020: R+39.0 2016: R+41.4 2012: R+31.9 2008: R+32.5
Not yet ingested
- Civics
- —
Market trends
- HPI YoY
- ▼ -41.96%
- Current HPI
- 195.0725
- Rent YoY
- —
- Metro
- —
- State GDP YoY
- ▲ 2.94%
- F500 in state
- 4
Industry mix (Fortune 500 HQ in AL)
| Industry | F500 HQs | Revenue |
|---|---|---|
| Financial Services | 1 | $8B |
|
||
| Healthcare | 1 | $5B |
|
||
Price history
+17.9% since first listed6 events — show timeline
- 2026-04-27 Pending — Greater Alabama MLS
- 2026-03-12 Price Changed $70,759 Greater Alabama MLS
- 2026-02-11 Price Changed $76,912 Greater Alabama MLS
- 2026-01-12 Listed $83,600 Greater Alabama MLS
- 2025-11-24 Price Changed $93,600 Greater Alabama MLS
- 2007-04-30 Sold (Public Records) $60,000 Public Records
Property tax history
-2.4%/yrLatest (2025): $295 · -4.7% YoY. Source: county tax records.
Cash-flow waterfall
monthlySold comps — $/sqft
last 12 mo · ≤1 miLoading sold comps…