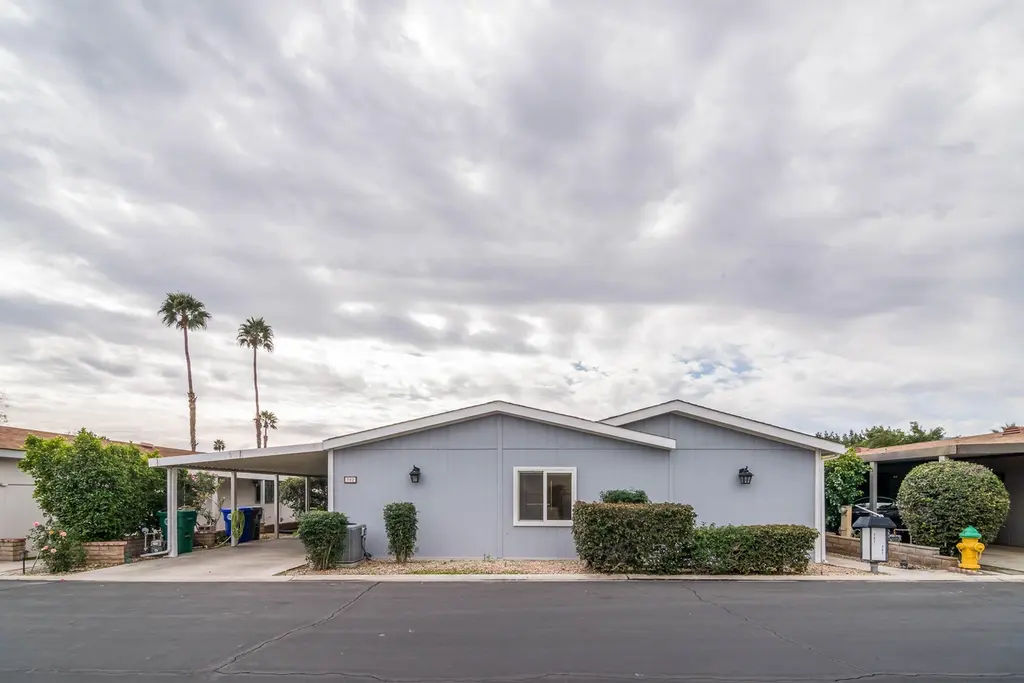
73450 Country Club Dr #302 · Palm Desert, CA
Flood risk 1/10 · Minimal
- FEMA flood zone
- X (unshaded)
- Chance of flooding over 30 yrs
- 0.0%
- Est. flood insurance / yr
- $507 – $1,088
Fire risk 1/10 · Minimal
- Est. fire insurance / yr
- $659 – $1,223
Heat risk 9/10 · Severe
- Hot days now (above 114°F)
- 5 days/yr
- Hot days in 30 yrs
- 15 days/yr
Wind risk 1/10 · Minimal
- Chance of severe wind over 30 yrs
- —
Air-quality risk 4/10 · Minor
- Unhealthy air days now
- 5 days/yr
- Unhealthy air days in 30 yrs
- 7 days/yr
Risk factors via First Street. Map © Google.
Why this score? — see what drove the B grade
The composite is a weighted blend of 9 inputs, each scored 0–100. Each bar is that input's sub-score; the figure is the points it added to the 100-point composite (weight × sub-score).
- Cash flow +30.0/30.0
- 1% rule +10.0/10.0
- DSCR +10.0/10.0
- ARV discount +9.4/15.0
- Schools +3.8/10.0
- Rent growth +2.9/5.0
- Livability +2.6/5.0
- Condition / age +2.5/5.0
- Appreciation +0.0/10.0
$219,000
🖨 Deal sheet 📄 Offer letter ✓ Due diligence
Listing remarks MLS
A Major price adjustment on the fairway! This is a wonderful opportunity to own a spacious, move in ready mobile home at the beautiful Suncrest CC. A 55 yr + community in Palm Desert which offers numerous social opportunities of 9-hole golf, pickleball, tennis, community pool and spas, dining and seasonal events at the clubhouse with resident discounts and annual memberships available. This could be the premier location in Suncrest CC as the home sits on the 4th hole by the green and faces south with unobstructed views of the majestic Santa Rosa Mountains! This popular triple-wide model has expansive postcard views from its living room and patios. Key features include * New roof (just completed Mar 2026) * Bonus room which makes a great BR 3 or Office * Skylights * Updated vinal windows and slider doors * Bright living spaces * Furnished as seen w kitchen fully stocked with appliances, dishes, silverware, pots and drinkware * expansive covered patios w furniture * lighted storage shed * cozy fireplace * separate laundry room w washer/dryer and custom workstation with cabinets * tandem 2 car carport * very quiet area in the park. Come see this home and community today!
Key facts
- Resident discounts
- Tennis
- Clubhouse
Tags
Neighborhood map
What this means for you Summary
Snapshot
- This is a 2-bed/2.0-bath manufactured listed at $219k.
Deal economics
- At list price, monthly cash flow is $1k ($17k/yr) — positive.
- The deal already cash-flows at list — no discount required.
- Meets the 1% rule at list price ($3k rent vs $219k).
- Recommended offer: $193k (12.0% below list) — sets the bar for market timing.
- Cap rate 14.1% vs local median 3.5% in Palm Desert — top-decile yield for the area; either an underpriced asset or a hidden risk that comps aren't pricing in. Stress-test before assuming the spread holds.
Location & tenants
- Location reads 51/100 on livability (#1,050 in CA) — a working-class tenant base; expect higher turnover. Strengths: schools A-, employment B+, housing B; Watch: crime D, amenities F, commute F.
- Desert Sands Unified (suburban): math 31% / reading 56% proficiency, ranked #199 of 517 in CA (top 38%) — families likely to look elsewhere, expect single-tenant / working-renter base with shorter leases.
- Market conditions: Rents rising (+1.6%/yr); 545 active listings in the ZIP; 40 comparable units currently listed for rent nearby; rentals lingering (median 44d on market — plan ~5-8 weeks vacancy on turnover, expect pricing pressure); 62% of comp listings sitting > 30 days — soft ceiling on asking rent; 9,195 units permitted in Riverside County in 2024 (1,512 in 5+ unit buildings).
- At $3,488/mo this rent would consume 60% of the median local household income ($70k/yr) (locally 1734% of renters already pay >50% of income on rent) — very limited rent-growth headroom before tenants either downsize or default.
Forward outlook
- Local home prices are declining (-3.0%/yr); year-one equity from $2k of loan paydown is wiped out by about $7k of value loss. Plan a longer hold.
- Riverside County population projected at +22% by 2050 — long-run rental-demand tailwind backs the buy-and-hold thesis.
- At projected returns (-3.0% appreciation + 1.6% rent growth), your $61k cash investment doubles in ~5 years — after that, you're playing with house money.
Negotiation context
- It's been on market 133 days — a 12% lower offer ($193k) is reasonable based on typical stale-listing flexibility.
- 2 sale attempts since 27y ago; this cycle's ask has dropped $40k (15%) from the opening price — seller is motivated, your offer sets the floor, not the list.
Risks & watch-outs
- Climate carrying-cost: extreme-heat days projected 5→15/yr by 2055 (HVAC capex compounding) — expect insurance premiums to compound above CPI over the hold.
Questions for the listing agent
- It's been on market 133 days. Have you received any prior offers? Is the seller open to a 12% concession, seller financing, or rate buy-down credit?
- Why hasn't it sold? Are there any deal-killer items the seller is aware of (foundation, flood, title, zoning, code violations)?
- Is there a deadline driving the sale (1031 exchange, divorce, estate, relocation)? That informs how much negotiation room exists.
- Schools are A-rated — typically a magnet for longer-tenancy family renters. What's the average tenant stay here, and is there a school-zone premium baked into asking?
- Crime grade is D in this area — have there been break-ins, vandalism, or insurance claims at this property in the last 3 years? What carrier currently insures it and at what premium?
- What's the average days-on-market for RENTAL listings here right now (not sales)? A rising rental-DOM trend means longer vacancies and softer asking-rent achievability than the comps imply.
- What's the recent tenant-quality profile in this submarket — average credit score on applications, eviction rate, late-payment / NSF rate, and stable-employment percentage? A property-management company in the area should have these aggregated.
- How much new for-sale + rental construction is in the pipeline within 1–3 miles? Heavy new supply typically softens prices + rents 12–24 months out; constrained supply supports both.
Investment metrics
- 1% rule
- 1.59% ✓
- Cap rate
- 14.12%
- Cash-on-cash
- 27.94%
- DSCR
- 2.24
- GRM
- 5.2
CMA / ARV
- ARV (median comp)
- $228,500
- List price
- $219,000
- Delta
- -4.16%
- Verdict
- FAIR
- Comps
- 20 within 1.0 mi
Show comp detail 12 sales within ~0.75 mi
| Address | Dist | Beds/Ba | Sqft | Sold | Price | $/sf | Match |
|---|---|---|---|---|---|---|---|
| 73450 Country Club Dr Unit Sp. 91 | 0.00mi | 2/2.0 | 1,788 (-6%) | 0mo | $255,000 | $143 | 90 |
| 73297 Highland Springs Dr #2 | 0.34mi | 2/2.0 | 1,800 (-5%) | 0mo | $275,000 | $153 | 76 |
| 73701 Half Way Dr | 0.49mi | 2/2.5 | 1,890 (-0%) | 2mo | $400,000 | $212 | 73 |
| 73450 Country Club Dr #87 | 0.00mi | 3/2.0 (+1) | 1,636 (-14%) | 1mo | $222,500 | $136 | 71 |
| 38785 Bautista Canyon Way | 0.46mi | 2/2.0 | 1,760 (-7%) | 2mo | $330,000 | $188 | 65 |
| 73045 Buck Springs Dr | 0.40mi | 2/2.0 | 1,680 (-11%) | 2mo | $468,000 | $279 | 61 |
| 39759 Manzanita Dr | 0.64mi | 3/2.0 (+1) | 1,940 (+2%) | 1mo | $449,900 | $232 | 60 |
| 38235 Poppet Canyon Dr | 0.50mi | 2/2.0 | 1,680 (-11%) | 0mo | $355,000 | $211 | 57 |
| 38251 Desert Greens Dr E | 0.72mi | 2/2.0 | 1,780 (-6%) | 1mo | $253,000 | $142 | 56 |
| 73330 Desert Greens Dr N | 0.67mi | 2/2.0 | 1,740 (-8%) | 1mo | $229,080 | $132 | 54 |
| 39800 Desert Greens Dr E | 0.72mi | 2/2.0 | 1,760 (-7%) | 1mo | $365,000 | $207 | 53 |
| 39700 E Desert Grns E | 0.71mi | 3/2.0 (+1) | 1,782 (-6%) | 2mo | $395,000 | $222 | 50 |
Match score weights: distance 35% · size 25% · config 20% · recency 20%. Top-matched comps best support the ARV.
Projected returns pro-forma
-3.0% appreciation · 1.6% rent growth · sell at horizon
- IRR
- 20.6%
- Equity multiple
- 1.82×
- Total profit
- $50,529
- Equity at exit
- $32,654
- IRR
- 27.8%
- Equity multiple
- 3.31×
- Total profit
- $141,497
- Equity at exit
- $18,935
Cash invested: $61,320 (down + closing). Projections, not guarantees.
Landlord ↔ Tenant lean methodology
- Overall (STATE)
- 18 Strongly Tenant-Friendly
- State California
- 18 Strongly Tenant-Friendly · D+13
- County
- — inherits STATE
- City
- — inherits STATE
ZIP-level market 92260
- Rents YoY
- 1.6%
- Active inventory
- 545
- Price-to-rent
- 5.2×
Monthly cashflow live
- Estimated rent
- $3,488 high interval (Pro) →
- Mortgage (P&I)
- −$1,148
- Tax from tax record
- −$89 /mo · $1,063/yr
- Insurance
- −$91
- HOA
- −$0
- Vacancy / Maint / Mgmt
- −$733
- Net cashflow
- $1,428
Break-even live
UW: 25.0% down · 7.5% · 30yr · 1.5% tax · 5.0% vac · 8.0% maint · 8.0% mgmt
Financing live
Cash to close
- Down payment
- $54,750
- Closing costs
- $6,570
- Reserves months
- —
- Total cash needed
- —
Loan-product check · same deal, 3 products live
Conventional
25% down · 7.5% · 30yr
- Down + closing
- —
- Monthly P&I
- —
- Monthly cashflow
- —
- DSCR
- —
- Eligible?
- —
Personal DTI + credit; lowest rate.
DSCR
20% down · 8.5% · 30yr
- Down + closing
- —
- Monthly P&I
- —
- Monthly cashflow
- —
- DSCR
- —
- Eligible?
- —
No personal income docs; deal must DSCR.
Hard money
10% down · 12.0% · 12mo
- Down + closing
- —
- Monthly P&I
- —
- Monthly cashflow
- —
- DSCR
- —
- Eligible?
- —
Short-term bridge; refi at stabilization.
Rent comps 40 comps
| Address | Beds | Baths | Sqft | Rent | $/sqft | DOM | Units | Dist |
|---|---|---|---|---|---|---|---|---|
| 73450 Country Club Dr #120 Palm Desert, CA | 2.0 | 2.0 | 1856 | $2,995 | $1.61 | 11d | 1 | 0.03mi |
| 4162 Via Mattina Palm Desert, CA | 2.0 | 2.0 | 1867 | $2,950 | $1.58 | 12d | 1 | 0.17mi |
| 4155 Via Mattina Palm Desert, CA | 3.0 | 3.0 | 2278 | $3,200 | $1.40 | 43d | 1 | 0.19mi |
| 4155 Via Mattina Palm Desert, CA | 3.0 | 3.0 | 2278 | $3,200 | $1.40 | 5d | 1 | 0.19mi |
| 4155 Via Mattina Unit 4155 Palm Desert, CA | 2.0 | 3.0 | 2278 | $3,500 | $1.54 | 43d | 1 | 0.19mi |
| 3253 Via Giorna Palm Desert, CA | 2.0 | 2.0 | 1961 | $4,500 | $2.29 | 24d | 1 | 0.22mi |
| 248 Strada Fortuna Palm Desert, CA | 2.0 | 2.0 | 1400 | $2,500 | $1.79 | 43d | 1 | 0.26mi |
| 170 Via Tramonto Palm Desert, CA | 3.0 | 2.0 | 1910 | $4,000 | $2.09 | 43d | 1 | 0.29mi |
| 170 Via Tramonto Palm Desert, CA | 3.0 | 2.0 | 1910 | $3,900 | $2.04 | 11d | 1 | 0.29mi |
| 73075 Buck Springs Dr Palm Desert, CA | 2.0 | 2.0 | 1440 | $1,950 | $1.35 | 43d | 1 | 0.36mi |
| 38520 Poppet Canyon Dr Palm Desert, CA | 2.0 | 2.0 | 1392 | $3,700 | $2.66 | 43d | 1 | 0.41mi |
| 40064 Silktree Ct Palm Desert, CA | 3.0 | 2.0 | 1712 | $3,200 | $1.87 | 24d | 1 | 0.45mi |
| 73639 Cabazon Peak Dr Palm Desert, CA | 2.0 | 2.0 | 1717 | $2,400 | $1.40 | 43d | 1 | 0.46mi |
| 40255 Sagewood Dr Palm Desert, CA | 3.0 | 2.0 | 1712 | $3,300 | $1.93 | 18d | 1 | 0.56mi |
| 38250 Azalea Dr Palm Desert, CA | 2.0 | 2.0 | 1806 | $5,500 | $3.05 | 43d | 1 | 0.56mi |
| 3443 Via Leonardo Palm Desert, CA | 3.0 | 2.0 | 2341 | $4,000 | $1.71 | 5d | 1 | 0.56mi |
| 73843 Line Canyon Ln Palm Desert, CA | 2.0 | 2.0 | 1570 | $2,100 | $1.34 | 11d | 1 | 0.57mi |
| 2701 Via Calderia Palm Desert, CA | 2.0 | 2.0 | 1559 | $2,850 | $1.83 | 24d | 1 | 0.59mi |
| 40605 Ventana Ct Palm Desert, CA | 3.0 | 2.5 | 2093 | $4,500 | $2.15 | 18d | 1 | 0.62mi |
| 40592 Palm Ct Palm Desert, CA | 3.0 | 2.5 | 2498 | $5,000 | $2.00 | 12d | 1 | 0.64mi |
| 40556 Clover Ln Palm Desert, CA | 3.0 | 2.5 | 1880 | $4,200 | $2.23 | 43d | 1 | 0.66mi |
| 1803 Via San Martino Palm Desert, CA | 2.0 | 2.0 | 1559 | $3,900 | $2.50 | 43d | 1 | 0.67mi |
| 40560 Glenwood Ln Palm Desert, CA | 3.0 | 3.0 | 2052 | $6,500 | $3.17 | 43d | 1 | 0.67mi |
| 41517 Armanac Ct Palm Desert, CA | 3.0 | 2.0 | 1537 | $3,400 | $2.21 | 3d | 1 | 0.71mi |
| 73983 Munn Cir Palm Desert, CA | 3.0 | 2.0 | 2064 | $3,400 | $1.65 | 43d | 1 | 0.75mi |
| 73750 Calle Bisque Palm Desert, CA | 3.0 | 2.0 | 1537 | $6,500 | $4.23 | 43d | 1 | 0.78mi |
| 217 Las Lomas Palm Desert, CA | 2.0 | 2.0 | 1656 | $6,300 | $3.80 | 43d | 1 | 0.88mi |
| 142 Lake Shore Dr Rancho Mirage, CA | 3.0 | 3.0 | 1888 | $4,850 | $2.57 | 43d | 1 | 0.88mi |
| 205 Las Lomas Palm Desert, CA | 2.0 | 2.0 | 1457 | $6,000 | $4.12 | 43d | 1 | 0.88mi |
| 255 San Remo St Palm Desert, CA | 2.0 | 2.0 | 1656 | $6,600 | $3.99 | 43d | 1 | 0.88mi |
| 72460 Rodeo Way Rancho Mirage, CA | 2.0 | 2.0 | 1851 | $2,500 | $1.35 | 5d | 1 | 0.89mi |
| 195 Desert Lakes Dr Rancho Mirage, CA | 2.0 | 2.0 | 2465 | $6,000 | $2.43 | 43d | 1 | 0.89mi |
| 177 Las Lomas Palm Desert, CA | 2.0 | 2.0 | 1800 | $7,500 | $4.17 | 43d | 1 | 0.89mi |
| 72385 Beverly Way Rancho Mirage, CA | 2.0 | 2.0 | 1851 | $2,500 | $1.35 | 18d | 1 | 0.92mi |
| 8 Las Cruces Ln Palm Desert, CA | 2.0 | 2.0 | 1705 | $5,000 | $2.93 | 43d | 1 | 0.92mi |
| 323 San Remo St Palm Desert, CA | 2.0 | 2.0 | 1556 | $8,500 | $5.46 | 43d | 1 | 0.94mi |
| 1701 Retreat Cir Palm Desert, CA | 3.0 | 2.5 | 2034 | $5,300 | $2.61 | 43d | 1 | 0.95mi |
| 264 Avenida del Sol Palm Desert, CA | 2.0 | 2.0 | 1800 | $6,000 | $3.33 | 43d | 1 | 0.95mi |
| 122 Kavenish Dr Rancho Mirage, CA | 3.0 | 3.0 | 2324 | $5,500 | $2.37 | 43d | 1 | 0.96mi |
| 37677 Emerson Dr Palm Desert, CA | 3.0 | 2.0 | 1896 | $3,600 | $1.90 | 43d | 1 | 0.97mi |
Listing history 17 events
-
2026-06-18days on market $219,000 Active 133 DOM
-
2026-06-17days on market $219,000 Active 132 DOM
-
2026-06-16days on market $219,000 Active 131 DOM
-
2026-06-15days on market $219,000 Active 130 DOM
-
2026-06-13days on market $219,000 Active 128 DOM
-
2026-06-09days on market $219,000 Active 124 DOM
-
2026-06-08days on market $219,000 Active 123 DOM
-
2026-06-07days on market $219,000 Active 122 DOM
-
2026-06-04days on market $219,000 Active 119 DOM
-
2026-06-03days on market $219,000 Active 118 DOM
-
2026-06-02days on market $219,000 Active 117 DOM
-
2026-06-01days on market $219,000 Active 116 DOM
-
2026-05-31days on market $219,000 Active 115 DOM
-
2026-03-19price $219,000 1210-char remark
Show marketing remark (1210 chars)
A Major price adjustment on the fairway! This is a wonderful opportunity to own a spacious, move in ready mobile home at the beautiful Suncrest CC. A 55 yr + community in Palm Desert which offers numerous social opportunities of 9-hole golf, pickleball, tennis, community pool and spas, dining and seasonal events at the clubhouse with resident discounts and annual memberships available. This could be the premier location in Suncrest CC as the home sits on the 4th hole by the green and faces south with unobstructed views of the majestic Santa Rosa Mountains! This popular triple-wide model has expansive postcard views from its living room and patios. Key features include * New roof (just completed Mar 2026) * Bonus room which makes a great BR 3 or Office * Skylights * Updated vinal windows and slider doors * Bright living spaces * Furnished as seen w kitchen fully stocked with appliances, dishes, silverware, pots and drinkware * expansive covered patios w furniture * lighted storage shed * cozy fireplace * separate laundry room w washer/dryer and custom workstation with cabinets * tandem 2 car carport * very quiet area in the park. Come see this home and community today!
-
2026-02-05$259,000 Active 1210-char remark
Show marketing remark (1210 chars)
A Major price adjustment on the fairway! This is a wonderful opportunity to own a spacious, move in ready mobile home at the beautiful Suncrest CC. A 55 yr + community in Palm Desert which offers numerous social opportunities of 9-hole golf, pickleball, tennis, community pool and spas, dining and seasonal events at the clubhouse with resident discounts and annual memberships available. This could be the premier location in Suncrest CC as the home sits on the 4th hole by the green and faces south with unobstructed views of the majestic Santa Rosa Mountains! This popular triple-wide model has expansive postcard views from its living room and patios. Key features include * New roof (just completed Mar 2026) * Bonus room which makes a great BR 3 or Office * Skylights * Updated vinal windows and slider doors * Bright living spaces * Furnished as seen w kitchen fully stocked with appliances, dishes, silverware, pots and drinkware * expansive covered patios w furniture * lighted storage shed * cozy fireplace * separate laundry room w washer/dryer and custom workstation with cabinets * tandem 2 car carport * very quiet area in the park. Come see this home and community today!
-
1999-02-05historical
-
1999-02-04$38,500
ⓘ Source: listings_history table (triggers on properties + properties_extension) + one-shot
backfill from property_details.listing_events for pre-trigger history.
Tax reassessment forecast CA · Resets to sale price
- Current annual tax
- $1,063 · $89/mo
- Projected year-2 tax
- $1,664 · $139/mo
- Expected delta
- +$602/yr (+$50/mo · 56.6%)
ⓘ Screening estimate from a state-policy table — verify with the county assessor before closing.
Climate risk First Street
- Flood 1/10 Low FEMA zone X (unshaded) · 0% chance over 30 yrs
- Wildfire 1/10 Low
- Heat 9/10 Extreme 5 d/yr ≥114°F today · 15 d/yr by 30 yrs out
- Wind 1/10 Low
- Air quality 4/10 Moderate 5 unhealthy d/yr today · 7 by 30 yrs out
Nearby sold comps map
Loading sold comps map…
Walkable amenities ~0.75 mi
Loading nearby amenities…
Taxation est. · year 1
- Rental income
- $41,861
- − Mortgage interest
- −$12,267
- − Property taxes
- −$1,063
- − Insurance
- −$1,095
- − Repairs & maintenance
- −$3,349
- − Management
- −$3,349
- − Depreciation
- −$6,371
- Taxable income
- $14,367
- Est. tax owed @ 24.0%
- −$3,448
- After-tax cash flow
- $13,683/yr
For passive investors: Depreciation is non-cash, so a rental often shows a tax loss while cash-flowing — sheltering income. Rental losses are passive: they offset passive income freely, and up to $25,000/yr can offset ordinary (W-2) income if you actively participate and your MAGI is under $100k (phasing out to $0 by $150k); unused losses carry forward. On sale, claimed depreciation is recaptured at up to 25%, and gains may owe capital-gains tax (a 1031 exchange can defer both). Figures are a year-1 estimate at your 24.0% rate — not tax advice; consult a CPA.
Schools (NCES district)
- District
- Desert Sands Unified
- NCES district ID
- 0611110
- Math proficiency
- 31% ▼ -4.00%
- Reading proficiency
- 56% ▲ 7.00%
- Median HH income
- $54,957
- Composite
- 37.77/100
- National rank
- #4346
- State rank
- #199 of 517 in CA
Livability — Palm Desert
- Score
- 51/100
- State rank
- #1050
- US rank
- #25164
Category grades
Schools grade is shown separately in the Schools card above.
Census & demographics
- Census place
- Palm Desert, CA
- County
- Riverside County · 2,287,001 people
- City population
- 58,615
- Metro
- Riverside-San Bernardino-Ontario, CA
- Population (ZIP)
- 30,523
- Household income
- $70,091
- Rent vs Own
- Severe rent burden
- 1734.0
Population outlook (Riverside County) Hauer SSP2
- Today (2025)
- 2,664,475 people
- By 2030
- 2,802,692 · +5.2%
- By 2040
- 3,050,904 · +14.5%
- By 2050
- 3,256,783 · +22.2%
- By 2075
- 3,655,058 · +37.2%
- By 2100
- 3,766,594 · +41.4%
Race, ethnicity, and origin ACS 2023
- Neighborhood character
- Majority White (61%)
- Race & ethnicity
- White 61% Hispanic / Latino 31% Two or more races 20% Asian 4% Black 2%
- Hispanic origin (detail)
- Mexican 25%
- Common ancestry
- Italian 4% Lithuanian 3% Slovak 2%
- Foreign-born
- 18% · Canada, South Korea, Vietnam
- Languages at home
- 73% English-only · Spanish 22% French/Haitian/Cajun 1% Other Indo-European 1%
Political lean MEDSL · Riverside
- 2024 margin
- Toss-up / Even · D 48.0% · R 49.3% · Other 2.6%
- 2008→2024 swing
- -3.6pp toward R · 2008: 2.3pp · 2024: -1.3pp
- All cycles
- 2024: R+1.3 2020: D+8.0 2016: D+4.3 2012: R+0.4 2008: D+2.3
Not yet ingested
- Civics
- —
Market trends
- HPI YoY
- ▼ -364.94%
- Current HPI
- 294.9425
- Rent YoY
- ▲ 1.60%
- Metro
- Riverside-San Bernardino-Ontario, CA
- State GDP YoY
- ▲ 3.21%
- F500 in state
- 116
Industry mix (Fortune 500 HQ in CA)
| Industry | F500 HQs | Revenue |
|---|---|---|
| Technology | 27 | $1,492B |
|
||
| Financial Services | 3 | $174B |
|
||
| Retail | 3 | $44B |
|
||
| Insurance | 3 | $26B |
|
||
| Media / Entertainment | 2 | $115B |
|
||
| Pharmaceuticals / Biotech | 2 | $62B |
|
||
Price history
+468.8% since first listed4 events — show timeline
- 2026-03-19 Price Changed $219,000 GPSMLS
- 2026-02-05 Listed $259,000 GPSMLS
- 1999-02-05 Listing Removed — GPSMLS
- 1999-02-04 Listed $38,500 GPSMLS
Property tax history
+1.9%/yrLatest (2025): $1,063 · +4.3% YoY. Source: county tax records.
Cash-flow waterfall
monthlySold comps — $/sqft
last 12 mo · ≤1 miLoading sold comps…