 Multi-family
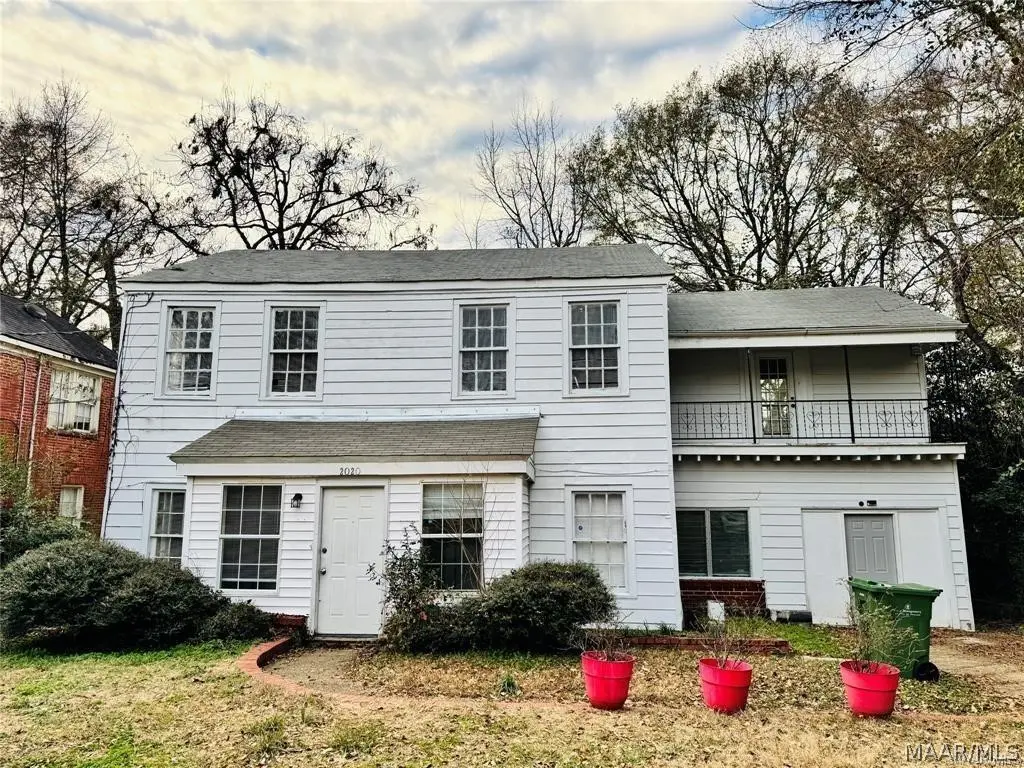
2020 Bullard St · Montgomery, AL
Flood risk 1/10 · Minimal
- FEMA flood zone
- X (unshaded)
- Chance of flooding over 30 yrs
- 0.0%
- Est. flood insurance / yr
- $507 – $1,088
Fire risk 1/10 · Minimal
- Est. fire insurance / yr
- $916 – $1,700
Heat risk 7/10 · Major
- Hot days now (above 108°F)
- 7 days/yr
- Hot days in 30 yrs
- 20 days/yr
Wind risk 8/10 · Major
- Chance of severe wind over 30 yrs
- 80.0%
Air-quality risk 3/10 · Minor
- Unhealthy air days now
- 4 days/yr
- Unhealthy air days in 30 yrs
- 4 days/yr
Risk factors via First Street. Map © Google.
Why this score? — see what drove the B+ grade
The composite is a weighted blend of 9 inputs, each scored 0–100. Each bar is that input's sub-score; the figure is the points it added to the 100-point composite (weight × sub-score).
- Cash flow +30.0/30.0
- ARV discount +15.0/15.0
- DSCR +10.0/10.0
- 1% rule +9.9/10.0
- Rent growth +4.1/5.0
- Livability +3.2/5.0
- Condition / age +2.5/5.0
- Schools +1.7/10.0
- Appreciation +0.0/10.0
$165,000
🖨 Deal sheet 📄 Offer letter ✓ Due diligence
Multi-family units
County records classify this as Multi-Family (2-4 Unit). Listing-text estimate: 1 unit. estimate disagrees with records
Listing remarks MLS
Corporate owned, NOT A SHORT SALE. Sold as is, where is. No seller disclosures available. Buyer to pay $2225 fee at closing. Investor financing available.
Key facts
- Laundry area
- Nice backyard
- Outdoor space
Tags
Property features AI
Finance
- Other: City lot in a subdivision; Lot dimensions approximately 60 x 170 (0.23 acres)
Exterior
- Parking: Driveway
- Utilities: Public water; Public sewer; Cable available; Electricity available
- Home design: 2 stories; Vinyl and wood siding; Slab foundation
- Construction: Vinyl siding; Wood siding; Built (year per public records)
- Exterior features: Balcony; Outdoor storage
Interior
- Flooring: Tile; Vinyl; Wood
- Bathrooms: Three full bathrooms
- Heating & cooling: Central heating (electric, multiple heating units); Central air conditioning (electric, multi units)
- Interior features: Tile, vinyl, and wood flooring; Multiple water heaters; Electric water heater
- Laundry & utility: Washer hookup; Dryer hookup
Neighborhood map
What this means for you Summary
Snapshot
- This is a 4-bed/2.0-bath multifamily listed at $165k.
Deal economics
- At list price, monthly cash flow is $896 ($11k/yr) — positive.
- The deal already cash-flows at list — no discount required.
- Meets the 1% rule at list price ($2k rent vs $165k).
- Recommended offer: $163k (1.5% below list) — sets the bar for market timing.
- Cap rate 12.8% vs local median 6.0% in Montgomery — top-decile yield for the area; either an underpriced asset or a hidden risk that comps aren't pricing in. Stress-test before assuming the spread holds.
Location & tenants
- Location reads 65/100 on livability (#138 in AL) — a middle-class / working-renter tenant base. Strengths: cost of living A+, housing A+; Watch: schools C-, employment D, crime F.
- Montgomery County (urban): math 9% / reading 31% proficiency, ranked #106 of 129 in AL (top 82%) — low school quality limits family demand, transient renter base, plan for 1-2y turnover; 70% free/reduced lunch — lower-income household profile, screen leases tightly.
- Market conditions: Rents rising fast (+6.3%/yr); 137 active listings in the ZIP; 21 comparable units currently listed for rent nearby; rentals at typical pace (median 21d on market — plan ~3-4 weeks tenant-placement turnaround); 460 units permitted in Montgomery County in 2024 (37 in 5+ unit buildings).
- This rent runs 43% of the median local income ($69k/yr) — at the standard rent-burdened threshold; future hikes will face affordability resistance.
Forward outlook
- Local home prices are declining (-3.0%/yr); year-one equity from $1k of loan paydown is wiped out by about $5k of value loss. Plan a longer hold.
- Montgomery County population projected to shrink 8% by 2050 — rents likely to lag national; underwrite the cash flow, not the appreciation.
- At projected returns (-3.0% appreciation + 6.3% rent growth), your $46k cash investment doubles in ~5 years — after that, you're playing with house money.
Negotiation context
- It's been on market 29 days — a 2% lower offer ($163k) is reasonable based on typical stale-listing flexibility.
- 5 sale attempts since 12y ago with the ask held roughly flat each time — persistent listings suggest the price (not the market) is what's stuck; bring a comps-based counter.
Risks & watch-outs
- Watch-outs: built in 1945 — expect roof / HVAC / electrical / plumbing capex.
- Climate carrying-cost: severe wind risk, 80% chance of damaging wind over 30y; extreme-heat days projected 7→20/yr by 2055 (HVAC capex compounding) — expect insurance premiums to compound above CPI over the hold.
Questions for the listing agent
- Built in 1945 — when were the roof, HVAC, electrical panel, plumbing, and water heater last replaced?
- Is there a deadline driving the sale (1031 exchange, divorce, estate, relocation)? That informs how much negotiation room exists.
- Crime grade is F in this area — have there been break-ins, vandalism, or insurance claims at this property in the last 3 years? What carrier currently insures it and at what premium?
- What's the average days-on-market for RENTAL listings here right now (not sales)? A rising rental-DOM trend means longer vacancies and softer asking-rent achievability than the comps imply.
- What's the recent tenant-quality profile in this submarket — average credit score on applications, eviction rate, late-payment / NSF rate, and stable-employment percentage? A property-management company in the area should have these aggregated.
- How much new apartment / multifamily construction is in the pipeline within 1–3 miles? Heavy new supply (>2% of stock underway) typically softens rents 12–24 months out; light construction supports rent growth.
Investment metrics
- 1% rule
- 1.49% ✓
- Cap rate
- 12.81%
- Cash-on-cash
- 23.29%
- DSCR
- 2.04
- GRM
- 5.6
CMA / ARV
- ARV (on-the-fly)
- $309,360
- Comps found
- 1
Show comp detail 1 sale within ~0.75 mi
| Address | Dist | Beds/Ba | Sqft | Sold | Price | $/sf | Match |
|---|---|---|---|---|---|---|---|
| 1131 Magnolia Curv | 0.71mi | 4/2.0 | 2,200 (-15%) | 3mo | $265,000 | $120 | 40 |
Match score weights: distance 35% · size 25% · config 20% · recency 20%. Top-matched comps best support the ARV.
Projected returns pro-forma
-3.0% appreciation · 6.29% rent growth · sell at horizon
- IRR
- 19.8%
- Equity multiple
- 1.84×
- Total profit
- $38,763
- Equity at exit
- $24,602
- IRR
- 30.2%
- Equity multiple
- 4.12×
- Total profit
- $144,178
- Equity at exit
- $14,266
Cash invested: $46,200 (down + closing). Projections, not guarantees.
Landlord ↔ Tenant lean methodology
- Overall (STATE)
- 90 Strongly Landlord-Friendly
- State Alabama
- 90 Strongly Landlord-Friendly · R+15
- County
- — inherits STATE
- City
- — inherits STATE
ZIP-level market 36106
- Home prices YoY
- -13.1%
- Rents YoY
- 6.3%
- Active inventory
- 137
- Price-to-rent
- 11.2×
Monthly cashflow live
- Estimated rent
- $2,463 high interval (Pro) →
- Mortgage (P&I)
- −$865
- Tax from tax record
- −$115 /mo · $1,383/yr
- Insurance
- −$69
- HOA
- −$0
- Vacancy / Maint / Mgmt
- −$517
- Net cashflow
- $896
Break-even live
2-unit breakdown (identical units grouped — click to expand)
| Units | Beds | Baths | Est. rent |
|---|---|---|---|
| 2× units | 2 | 1 | $2,464 |
| #1 | 2 | 1 | $1,232 |
| #2 | 2 | 1 | $1,232 |
| Total (2 units) | $2,463 | ||
UW: 25.0% down · 7.5% · 30yr · 1.5% tax · 5.0% vac · 8.0% maint · 8.0% mgmt
Financing live
Cash to close
- Down payment
- $41,250
- Closing costs
- $4,950
- Reserves months
- —
- Total cash needed
- —
Loan-product check · same deal, 3 products live
Conventional
25% down · 7.5% · 30yr
- Down + closing
- —
- Monthly P&I
- —
- Monthly cashflow
- —
- DSCR
- —
- Eligible?
- —
Personal DTI + credit; lowest rate.
DSCR
20% down · 8.5% · 30yr
- Down + closing
- —
- Monthly P&I
- —
- Monthly cashflow
- —
- DSCR
- —
- Eligible?
- —
No personal income docs; deal must DSCR.
Hard money
10% down · 12.0% · 12mo
- Down + closing
- —
- Monthly P&I
- —
- Monthly cashflow
- —
- DSCR
- —
- Eligible?
- —
Short-term bridge; refi at stabilization.
Rent comps 21 comps
| Address | Beds | Baths | Sqft | Rent | $/sqft | DOM | Units | Dist |
|---|---|---|---|---|---|---|---|---|
| 2009 Bullard St Montgomery, AL | 5.0 | 2.0 | 1992 | $1,975 | $0.99 | 21d | 1 | 0.05mi |
| 2045 Bullard St Unit 1043526P Montgomery, AL | 3.0 | 2.0 | 1797 | $2,198 | $1.22 | 43d | 1 | 0.09mi |
| 2053 Gorgas St Montgomery, AL | 3.0 | 1.0 | 1955 | $1,200 | $0.61 | 21d | 1 | 0.15mi |
| 2043 Hazel Hedge Ln Montgomery, AL | 4.0 | 3.0 | 2001 | $1,650 | $0.82 | 13d | 1 | 0.46mi |
| 1355 Magnolia Curv Montgomery, AL | 3.0 | 3.0 | 2260 | $1,800 | $0.80 | 13d | 1 | 0.53mi |
| 1827 Pinecrest Dr Montgomery, AL | 4.0 | 3.0 | 1893 | $1,550 | $0.82 | 13d | 1 | 0.59mi |
| 1121 Felder Ave Unit 1043909P Montgomery, AL | 4.0 | 2.5 | 2647 | $3,152 | $1.19 | 21d | 1 | 0.70mi |
| 1814 Sylvan Dr Montgomery, AL | 3.0 | 2.0 | 1785 | $1,400 | $0.78 | 21d | 1 | 0.75mi |
| 1029 Magnolia Curv Montgomery, AL | 3.0 | 2.5 | 3134 | $2,695 | $0.86 | 13d | 1 | 0.83mi |
| 2988 Old Farm Rd Montgomery, AL | 3.0 | 2.5 | 2314 | $1,900 | $0.82 | 43d | 1 | 0.87mi |
| 2983 Old Farm Rd Montgomery, AL | 3.0 | 2.0 | 2000 | $1,725 | $0.86 | 21d | 1 | 0.90mi |
| 2929 Canterbury Ct Unit 1043474P Montgomery, AL | 4.0 | 2.5 | 2464 | $2,667 | $1.08 | 21d | 1 | 0.90mi |
| 3332 Allendale Pl Montgomery, AL | 3.0 | 2.0 | 2741 | $2,250 | $0.82 | 13d | 1 | 1.02mi |
| 3359 Bedford Ln Montgomery, AL | 4.0 | 2.0 | 1786 | $1,600 | $0.90 | 13d | 1 | 1.31mi |
| 3510 Bankhead Ave Montgomery, AL | 3.0 | 3.0 | 2210 | $2,250 | $1.02 | 43d | 1 | 1.32mi |
| 640 Plymouth St Montgomery, AL | 5.0 | 3.0 | 3224 | $2,400 | $0.74 | 21d | 1 | 1.36mi |
| 334 Felder Ave Montgomery, AL | 3.0 | 2.0 | 2223 | $2,395 | $1.08 | 43d | 1 | 1.39mi |
| 3485 Wellington Rd Montgomery, AL | 3.0 | 2.0 | 2437 | $1,395 | $0.57 | 21d | 1 | 1.40mi |
| 3352 Ridgefield Dr Montgomery, AL | 3.0 | 2.0 | 1932 | $1,761 | $0.91 | 21d | 1 | 1.43mi |
| 3235 Norman Bridge Rd Montgomery, AL | 3.0 | 1.0 | 1873 | $900 | $0.48 | 43d | 1 | 1.43mi |
| 2004 Capitol Ave Unit 1043879P Montgomery, AL | 4.0 | 2.5 | 1797 | $3,518 | $1.96 | 13d | 1 | 1.45mi |
Listing history 28 events
-
2026-06-18days on market $165,000 Active 29 DOM
-
2026-06-17days on market $165,000 Active 28 DOM
-
2026-06-16days on market $165,000 Active 27 DOM
-
2026-06-15days on market $165,000 Active 26 DOM
-
2026-06-14days on market $165,000 Active 24 DOM
-
2026-06-13days on market $165,000 Active 23 DOM
-
2026-06-10days on market $165,000 Active 21 DOM
-
2026-06-09days on market $165,000 Active 20 DOM
-
2026-06-08days on market $165,000 Active 19 DOM
-
2026-06-07days on market $165,000 Active 18 DOM
-
2026-06-03days on market $165,000 Active 14 DOM
-
2026-06-02days on market $165,000 Active 13 DOM
-
2026-06-01days on market $165,000 Active 12 DOM
-
2026-05-31days on market $165,000 Active 11 DOM
-
2026-05-30days on market $165,000 Active 10 DOM
-
2026-05-20$165,000 Active
-
2024-05-23historical $675
-
2024-04-11$675
-
2024-04-10historical $675
-
2024-03-27price $675
-
2024-03-13$750
-
2023-09-23historical $995
-
2023-09-07$995
-
2023-08-11soldstatus $153,000
-
2022-12-07historical
-
2020-02-05soldstatus $35,000
-
2015-02-24soldstatus $15,000 156-char remark
Show marketing remark (156 chars)
Corporate owned, NOT A SHORT SALE. Sold as is, where is. No seller disclosures available. Buyer to pay $2225 fee at closing. Investor financing available.
-
2014-07-01$25,900 156-char remark
Show marketing remark (156 chars)
Corporate owned, NOT A SHORT SALE. Sold as is, where is. No seller disclosures available. Buyer to pay $2225 fee at closing. Investor financing available.
ⓘ Source: listings_history table (triggers on properties + properties_extension) + one-shot
backfill from property_details.listing_events for pre-trigger history.
Tax reassessment forecast AL · Resets to sale price
- Current annual tax
- $1,383 · $115/mo
- Projected year-2 tax
- $1,383 · $115/mo
- Expected delta
- $0/yr ($0/mo · 0.0%)
ⓘ Screening estimate from a state-policy table — verify with the county assessor before closing.
Climate risk First Street
- Flood 1/10 Low FEMA zone X (unshaded) · 0% chance over 30 yrs
- Wildfire 1/10 Low
- Heat 7/10 Severe 7 d/yr ≥108°F today · 20 d/yr by 30 yrs out
- Wind 8/10 Severe 80% chance of damaging wind over 30 yrs
- Air quality 3/10 Moderate 4 unhealthy d/yr today · 4 by 30 yrs out
Nearby sold comps map
Loading sold comps map…
Walkable amenities ~0.75 mi
Loading nearby amenities…
Taxation est. · year 1
- Rental income
- $29,556
- − Mortgage interest
- −$9,243
- − Property taxes
- −$1,383
- − Insurance
- −$825
- − Repairs & maintenance
- −$2,364
- − Management
- −$2,364
- − Depreciation
- −$4,800
- Taxable income
- $8,576
- Est. tax owed @ 24.0%
- −$2,058
- After-tax cash flow
- $8,699/yr
For passive investors: Depreciation is non-cash, so a rental often shows a tax loss while cash-flowing — sheltering income. Rental losses are passive: they offset passive income freely, and up to $25,000/yr can offset ordinary (W-2) income if you actively participate and your MAGI is under $100k (phasing out to $0 by $150k); unused losses carry forward. On sale, claimed depreciation is recaptured at up to 25%, and gains may owe capital-gains tax (a 1031 exchange can defer both). Figures are a year-1 estimate at your 24.0% rate — not tax advice; consult a CPA.
Schools (NCES district)
- District
- Montgomery County
- NCES district ID
- 0102430
- Math proficiency
- 9% ▼ -21.00%
- Reading proficiency
- 31% ▼ -1.00%
- Median HH income
- $43,902
- Composite
- 17.24/100
- National rank
- #9093
- State rank
- #106 of 129 in AL
Livability — Montgomery
- Score
- 65/100
- State rank
- #138
- US rank
- #13416
Category grades
Schools grade is shown separately in the Schools card above.
Census & demographics
- Census place
- Montgomery, AL
- County
- Montgomery County · 190,016 people
- City population
- 175,913
- Metro
- Montgomery, AL
- Population (ZIP)
- 14,065
- Household income
- $69,087
- Rent vs Own
- Severe rent burden
- 876.0
Population outlook (Montgomery County) Hauer SSP2
- Today (2025)
- 224,008 people
- By 2030
- 221,460 · -1.1%
- By 2040
- 214,179 · -4.4%
- By 2050
- 204,912 · -8.5%
- By 2075
- 177,821 · -20.6%
- By 2100
- 145,134 · -35.2%
Race, ethnicity, and origin ACS 2023
- Neighborhood character
- Diverse neighborhood (Simpson 0.58)
- Race & ethnicity
- White 47% Black 43% Hispanic / Latino 5% Two or more races 4% Asian 1%
- Hispanic origin (detail)
- Mexican 3%
- Common ancestry
- Serbian 2% Slovak 2% Italian 1%
- Foreign-born
- 4% · Canada, China, South Korea
- Languages at home
- 94% English-only · Spanish 3%
Political lean MEDSL · Montgomery
- 2024 margin
- Solid D (+30.7) · D 64.8% · R 34.1% · Other 1.1%
- 2008→2024 swing
- +11.5pp toward D · 2008: 19.2pp · 2024: 30.7pp
- All cycles
- 2024: D+30.7 2020: D+31.5 2016: D+26.2 2012: D+24.3 2008: D+19.2
Not yet ingested
- Civics
- —
Market trends
- HPI YoY
- ▼ -22.82%
- Current HPI
- 151.1822
- Rent YoY
- ▲ 6.29%
- Metro
- Montgomery, AL
- State GDP YoY
- ▲ 2.94%
- F500 in state
- 4
Industry mix (Fortune 500 HQ in AL)
| Industry | F500 HQs | Revenue |
|---|---|---|
| Financial Services | 1 | $8B |
|
||
| Healthcare | 1 | $5B |
|
||
Price history
+537.1% since first listed13 events — show timeline
- 2026-05-20 Listed $165,000 MAAR
- 2024-05-23 Rental Removed $675 APPFOLIO
- 2024-04-11 Listed for Rent $675 APPFOLIO
- 2024-04-10 Rental Removed $675 APPFOLIO
- 2024-03-27 Price Changed $675 APPFOLIO
- 2024-03-13 Listed for Rent $750 APPFOLIO
- 2023-09-23 Rental Removed $995 APPFOLIO
- 2023-09-07 Listed for Rent $995 APPFOLIO
- 2023-08-11 Sold (Public Records) $153,000 Public Records
- 2022-12-07 Rental Removed — APPFOLIO
- 2020-02-05 Sold (Public Records) $35,000 Public Records
- 2015-02-24 Sold (MLS) $15,000 MAAR
- 2014-07-01 Listed $25,900 MAAR
Property tax history
+7.2%/yrLatest (2025): $1,383 · +0.8% YoY. Source: county tax records.
Cash-flow waterfall
monthlySold comps — $/sqft
last 12 mo · ≤1 miLoading sold comps…