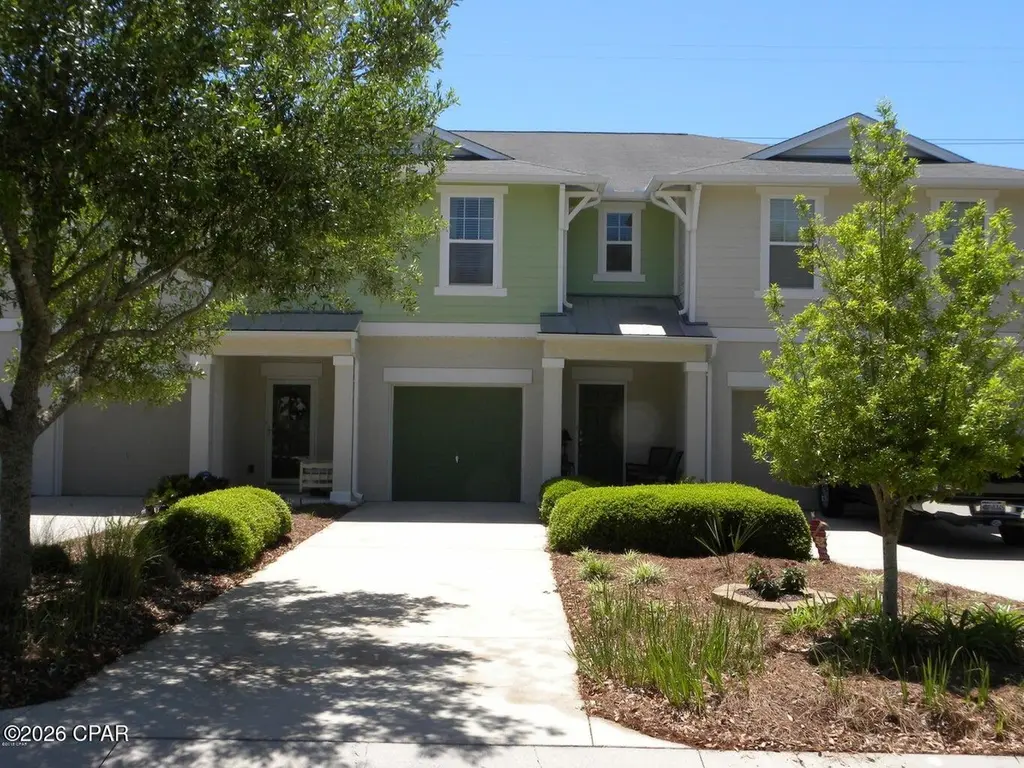
109 Sand Oak Blvd · Panama City Beach, FL
Flood risk 1/10 · Minimal
- FEMA flood zone
- X (unshaded)
- Chance of flooding over 30 yrs
- 0.0%
- Est. flood insurance / yr
- $507 – $1,088
Fire risk 5/10 · Moderate
- Est. fire insurance / yr
- $947 – $1,759
Heat risk 10/10 · Severe
- Hot days now (above 105°F)
- 7 days/yr
- Hot days in 30 yrs
- 21 days/yr
Wind risk 10/10 · Severe
- Chance of severe wind over 30 yrs
- 99.0%
Air-quality risk 2/10 · Minimal
- Unhealthy air days now
- 1 days/yr
- Unhealthy air days in 30 yrs
- 1 days/yr
Risk factors via First Street. Map © Google.
Why this score? — see what drove the C- grade
The composite is a weighted blend of 9 inputs, each scored 0–100. Each bar is that input's sub-score; the figure is the points it added to the 100-point composite (weight × sub-score).
- Cash flow +19.8/30.0
- ARV discount +9.5/15.0
- DSCR +6.3/10.0
- 1% rule +4.7/10.0
- Schools +4.3/10.0
- Livability +3.9/5.0
- Rent growth +2.6/5.0
- Condition / age +2.5/5.0
- Appreciation +0.0/10.0
$295,000
🖨 Deal sheet (PDF) 📄 Offer letter ✓ Due diligence
Listing remarks MLS
Beautiful townhome located in Whisper Dunes on the west end of Panama City Beach, FL. High ceilings, Concrete block construction on 1st floor, Upgraded fixtures throughout, Maple cabinets in kitchen, Corian solid surface counter tops, upgraded tile and carpet throughout home. Includes a one car attached garage, covered porches, 3 bedrooms, 2 1/2 baths, walk-in closet, Nice patio in backyard, Community pool and clubhouse, and many extras. This unit is in pristine condition. Furniture can also be purchased with this townhome for an additional price. Does not include all furnishings.
Key facts
- Garage
- Community pool
- Built 2008
Property features AI
Finance
- HOA & community: Homeowners association present; Community gazebo; Community picnic area; Community pool; Community park
Exterior
- Parking: 1-car garage; Paved parking
- Utilities: Electricity available; Underground utilities; Public sewer
- Home design: Property has multiple stories; Entry level information not specified; Orientation/facing direction not specified
- Construction: Stucco construction; Composition/shingle roof; Slab foundation; Built year not specified
- Exterior features: Patio; Covered patio/porch; Porch; Sprinkler system; Paved surfaces
Interior
- Kitchen: Electric oven; Electric range
- Bedrooms: Primary bedroom on upper level; Additional bedrooms on second level
- Bathrooms: 2 full bathrooms; 1 half bathroom
- Heating & cooling: Central heating (electric); Central air conditioning; Ceiling fan(s)
- Interior features: Interior steps; Shower only; Upper level primary; Walk-in closet(s)
- Laundry & utility: Electric water heater
Neighborhood map
What this means for you Summary
Snapshot
- This is a 3-bed/3.0-bath townhouse listed at $295k.
Deal economics
- At list price, monthly cash flow is $353 ($4k/yr) — positive.
- The deal already cash-flows at list — no discount required.
- To meet the 1% rule (rent ≥ 1% of price), the offer needs to be $287k (2.5% below list).
- Recommended offer: $287k (2.5% below list) — sets the bar for 1% rule.
- Cap rate 7.7% vs local median 2.6% in Panama City Beach — top-decile yield for the area; either an underpriced asset or a hidden risk that comps aren't pricing in. Stress-test before assuming the spread holds.
Location & tenants
- Location reads 78/100 on livability (#172 in FL, #2,624 nationally) — a middle-class / working-renter tenant base. Strengths: crime A+, housing A+, health & safety A+; Watch: amenities D-, commute F.
- Bay (suburban): math 51% / reading 51% proficiency, ranked #29 of 73 in FL (top 40%) — acceptable for families but not a draw, mixed tenant base, ~2y average lease.
- Zoned schools: West Bay Elementary School (math 57% / reading 52%, grade C, #892 of 2,144 statewide, top 44%, 313 students, 50% FRL); Surfside Middle School (math 58% / reading 59%, grade B, #148 of 571 statewide, top 26%, 843 students, 48% FRL); J.R. Arnold High School (math 41% / reading 54%, grade D, #204 of 667 statewide, top 31%, 1,617 students, 36% FRL) — zoned schools at 45% FRL track the district average.
- Market conditions: Rents flat; 1273 active listings in the ZIP; 6 comparable units currently listed for rent nearby; rentals at typical pace (median 16d on market — plan ~3-4 weeks tenant-placement turnaround); solid renter incomes; 2,473 units permitted in Bay County in 2024 (559 in 5+ unit buildings).
- This rent runs 43% of the median local income ($80k/yr) — at the standard rent-burdened threshold; future hikes will face affordability resistance.
Forward outlook
- Local home prices are declining (-3.0%/yr); year-one equity from $2k of loan paydown is wiped out by about $9k of value loss. Plan a longer hold.
- Bay County population projected at +24% by 2050 — long-run rental-demand tailwind backs the buy-and-hold thesis.
Negotiation context
- Only 11 days on market — expect competitive offers; lowballing is unlikely to land.
- 2 sale attempts since 8y ago with the ask held roughly flat each time — persistent listings suggest the price (not the market) is what's stuck; bring a comps-based counter.
- Current owner paid $200k; 48% above their basis — modest negotiation headroom, anchor on the comps not their cost.
Risks & watch-outs
- Climate carrying-cost: severe wind risk, 99% chance of damaging wind over 30y; moderate wildfire risk; extreme-heat days projected 7→21/yr by 2055 (HVAC capex compounding) — expect insurance premiums to compound above CPI over the hold.
Questions for the listing agent
- Is there a deadline driving the sale (1031 exchange, divorce, estate, relocation)? That informs how much negotiation room exists.
- Schools are B-rated — typically a magnet for longer-tenancy family renters. What's the average tenant stay here, and is there a school-zone premium baked into asking?
- What's the average days-on-market for RENTAL listings here right now (not sales)? A rising rental-DOM trend means longer vacancies and softer asking-rent achievability than the comps imply.
- What's the recent tenant-quality profile in this submarket — average credit score on applications, eviction rate, late-payment / NSF rate, and stable-employment percentage? A property-management company in the area should have these aggregated.
- How much new for-sale + rental construction is in the pipeline within 1–3 miles? Heavy new supply typically softens prices + rents 12–24 months out; constrained supply supports both.
Investment metrics
- 1% rule
- 0.97% ✗
- Cap rate
- 7.73%
- Cash-on-cash
- 5.13%
- DSCR
- 1.23
- GRM
- 8.6
CMA / ARV
- ARV (on-the-fly)
- $308,880
- Comps found
- 12
Show comp detail 12 sales within ~0.75 mi
| Address | Dist | Beds/Ba | Sqft | Sold | Price | $/sf | Match |
|---|---|---|---|---|---|---|---|
| 203 Sand Oak Blvd | 0.07mi | 3/2.5 | 1,560 (0%) | 2mo | $295,000 | $189 | 93 |
| 221 Sand Oak Blvd | 0.11mi | 3/2.5 | 1,560 (0%) | 4mo | $314,000 | $201 | 90 |
| 209 Sand Oak Blvd | 0.08mi | 3/2.5 | 1,560 (0%) | 7mo | $308,750 | $198 | 88 |
| 105 Sand Oak Blvd | 0.01mi | 3/2.5 | 1,577 (+1%) | 12mo | $276,950 | $176 | 86 |
| 329 Sand Oak Blvd | 0.16mi | 3/2.5 | 1,608 (+3%) | 0mo | $316,000 | $197 | 85 |
| 309 Sand Oak Blvd | 0.16mi | 3/2.5 | 1,560 (0%) | 8mo | $280,000 | $179 | 84 |
| 205 Sand Oak Blvd | 0.07mi | 3/2.5 | 1,577 (+1%) | 14mo | $270,000 | $171 | 81 |
| 102 Fox Glove Ln | 0.09mi | 3/2.5 | 1,496 (-4%) | 12mo | $334,000 | $223 | 77 |
| 347 Sand Oak Blvd | 0.16mi | 3/2.5 | 1,526 (-2%) | 14mo | $335,000 | $220 | 75 |
| 204 Sand Oak Blvd | 0.11mi | 3/2.5 | 1,713 (+10%) | 5mo | $320,000 | $187 | 72 |
| 349 Sand Oak Blvd | 0.16mi | 3/2.5 | 1,526 (-2%) | 19mo | $335,000 | $220 | 71 |
| 96 Fox Glove Ln | 0.10mi | 3/2.5 | 1,496 (-4%) | 23mo | $340,000 | $227 | 68 |
Match score weights: distance 35% · size 25% · config 20% · recency 20%. Top-matched comps best support the ARV.
Projected returns pro-forma
-3.0% appreciation · 0.52% rent growth · sell at horizon
- IRR
- -11.0%
- Equity multiple
- 0.61×
- Total profit
- $-32,346
- Equity at exit
- $43,985
- IRR
- -5.6%
- Equity multiple
- 0.68×
- Total profit
- $-26,668
- Equity at exit
- $25,506
Cash invested: $82,600 (down + closing). Projections, not guarantees.
Landlord ↔ Tenant lean methodology
- Overall (STATE)
- 87 Strongly Landlord-Friendly
- State Florida
- 87 Strongly Landlord-Friendly · R+3
- County
- — inherits STATE
- City
- — inherits STATE
ZIP-level market 32413
- Home prices YoY
- -34.4%
- Rents YoY
- 0.5%
- Active inventory
- 1273
- Price-to-rent
- 8.6×
Monthly cashflow live
- Estimated rent
- $2,875 high interval (Pro) →
- Mortgage (P&I)
- −$1,547
- Tax from tax record
- −$248 /mo · $2,977/yr
- Insurance
- −$123
- HOA
- −$0
- Lot rent
- −$0
- Vacancy / Maint / Mgmt
- −$604
- Net cashflow
- $353
Break-even live
Sensitivity live
| Price | -10% $520 | -5% $437 | +0% $353 | +5% $270 | +10% $186 |
|---|---|---|---|---|---|
| Rent | -10% $126 | -5% $240 | +0% $353 | +5% $467 | +10% $580 |
| Rate | -1.0pp $502 | -0.5pp $428 | base $353 | +0.5pp $277 | +1.0pp $199 |
UW: 25.0% down · 7.5% · 30yr · 1.5% tax · 5.0% vac · 8.0% maint · 8.0% mgmt
Financing live
Cash to close
- Down payment
- $73,750
- Closing costs
- $8,850
- Reserves months
- —
- Total cash needed
- —
Loan-product check · same deal, 3 products live
Conventional
25% down · 7.5% · 30yr
- Down + closing
- —
- Monthly P&I
- —
- Monthly cashflow
- —
- DSCR
- —
- Eligible?
- —
Personal DTI + credit; lowest rate.
DSCR
20% down · 8.5% · 30yr
- Down + closing
- —
- Monthly P&I
- —
- Monthly cashflow
- —
- DSCR
- —
- Eligible?
- —
No personal income docs; deal must DSCR.
Hard money
10% down · 12.0% · 12mo
- Down + closing
- —
- Monthly P&I
- —
- Monthly cashflow
- —
- DSCR
- —
- Eligible?
- —
Short-term bridge; refi at stabilization.
Rent comps 6 comps
| Address | Beds | Baths | Sqft | Rent | $/sqft | DOM | Units | Dist |
|---|---|---|---|---|---|---|---|---|
| 238 Oleander Dr Unit 1462121P Panama City, FL | 4.0 | 4.0 | 1732 | $4,298 | $2.48 | 15d | 1 | 0.26mi |
| 216 Rose Ln Unit A Panama City Beach, FL | 3.0 | 1.0 | 1280 | $2,175 | $1.70 | 15d | 1 | 0.36mi |
| 100 Downing St #13 Panama City Beach, FL | 3.0 | 2.5 | 1360 | $1,950 | $1.43 | 23d | 1 | 0.38mi |
| 121 Christmas Tree Ln Unit 1511625P Panama City Beach, FL | 3.0 | 2.0 | 1496 | $11,089 | $7.41 | 23d | 1 | 0.40mi |
| 21101 Panama City Beach Pkwy Panama City Beach, FL | 1.0–3.0 | 1.0–2.0 | 1004 | $1,956 | $1.95 | 15d | 12 | 0.79mi |
| 21310 Pompano Ave Unit 1511639P Panama City Beach, FL | 3.0 | 2.0 | 1883 | $6,011 | $3.19 | 15d | 1 | 0.94mi |
Listing history 9 events
-
2026-06-21days on market $295,000 Active 11 DOM
-
2026-06-19days on market $295,000 Active 9 DOM
-
2026-06-18days on market $295,000 Active 8 DOM
-
2026-06-17days on market $295,000 Active 7 DOM
-
2026-06-16days on market $295,000 Active 6 DOM
-
2026-06-15days on market $295,000 Active 5 DOM
-
2026-06-14days on market $295,000 Active 3 DOM
-
2026-06-13remarks 699-char remark
-
2026-06-13$295,000 Active 2 DOM
ⓘ Source: listings_history table (triggers on properties + properties_extension) + one-shot
backfill from property_details.listing_events for pre-trigger history.
Tax reassessment forecast FL · Resets to sale price
- Current annual tax
- $2,977 · $248/mo
- Projected year-2 tax
- $2,977 · $248/mo
- Expected delta
- $0/yr ($0/mo · 0.0%)
ⓘ Screening estimate from a state-policy table — verify with the county assessor before closing.
Climate risk First Street
- Flood 1/10 Low FEMA zone X (unshaded) · 0% chance over 30 yrs
- Wildfire 5/10 Major
- Heat 10/10 Extreme 7 d/yr ≥105°F today · 21 d/yr by 30 yrs out
- Wind 10/10 Extreme 99% chance of damaging wind over 30 yrs
- Air quality 2/10 Low 1 unhealthy d/yr today · 1 by 30 yrs out
Nearby sold comps map
Loading sold comps map…
Walkable amenities ~0.75 mi
Loading nearby amenities…
Taxation est. · year 1
- Rental income
- $34,498
- − Mortgage interest
- −$16,525
- − Property taxes
- −$2,977
- − Insurance
- −$1,475
- − Repairs & maintenance
- −$2,760
- − Management
- −$2,760
- − Depreciation
- −$8,582
- Taxable loss
- −$580
- Est. tax savings @ 24.0%
- +$139
- After-tax cash flow
- $4,376/yr
For passive investors: Depreciation is non-cash, so a rental often shows a tax loss while cash-flowing — sheltering income. Rental losses are passive: they offset passive income freely, and up to $25,000/yr can offset ordinary (W-2) income if you actively participate and your MAGI is under $100k (phasing out to $0 by $150k); unused losses carry forward. On sale, claimed depreciation is recaptured at up to 25%, and gains may owe capital-gains tax (a 1031 exchange can defer both). Figures are a year-1 estimate at your 24.0% rate — not tax advice; consult a CPA.
Schools (NCES district)
- District
- Bay
- NCES district ID
- 1200090
- Math proficiency
- 51% ▼ -8.00%
- Reading proficiency
- 51% ▼ -7.00%
- Median HH income
- $47,740
- Composite
- 43.41/100
- National rank
- #3014
- State rank
- #29 of 73 in FL
Livability — Panama City Beach
- Score
- 78/100
- State rank
- #172
- US rank
- #2624
Category grades
Schools grade is shown separately in the Schools card above.
Census & demographics
- Census place
- Panama City Beach, FL
- County
- Bay County · 163,593 people
- City population
- 50,689
- Metro
- Panama City, FL
- Population (ZIP)
- 15,453
- Household income
- $80,039
- Rent vs Own
- Severe rent burden
- 531.0
Population outlook (Bay County) Hauer SSP2
- Today (2025)
- 206,264 people
- By 2030
- 217,740 · +5.6%
- By 2040
- 238,738 · +15.7%
- By 2050
- 255,545 · +23.9%
- By 2075
- 288,295 · +39.8%
- By 2100
- 288,638 · +39.9%
Race, ethnicity, and origin ACS 2023
- Neighborhood character
- Predominantly White (87%)
- Race & ethnicity
- White 87% Hispanic / Latino 8% Two or more races 6% Black 1%
- Hispanic origin (detail)
- Mexican 1% Puerto Rican 2%
- Common ancestry
- Slovak 3% Italian 3% Lithuanian 2%
- Foreign-born
- 8% · Canada, Jamaica
- Languages at home
- 91% English-only · Spanish 6% Other Indo-European 1% Russian/Polish/Slavic 0%
Political lean MEDSL · Bay
- 2024 margin
- Solid R (+47.4) · D 25.8% · R 73.1% · Other 1.1%
- 2008→2024 swing
- -6.6pp toward R · 2008: -40.7pp · 2024: -47.4pp
- All cycles
- 2024: R+47.4 2020: R+43.5 2016: R+46.3 2012: R+43.6 2008: R+40.7
Not yet ingested
- Civics
- —
Market trends
- HPI YoY
- ▼ -185.97%
- Current HPI
- 354.7469
- Rent YoY
- ▲ 0.52%
- Metro
- Panama City, FL
- State GDP YoY
- ▲ 3.28%
- F500 in state
- 36
Industry mix (Fortune 500 HQ in FL)
| Industry | F500 HQs | Revenue |
|---|---|---|
| Industrial Technology | 2 | $29B |
|
||
| Insurance | 2 | $17B |
|
||
| Retail | 1 | $60B |
|
||
| Technology Distribution | 1 | $58B |
|
||
| Homebuilding | 1 | $35B |
|
||
| Technology Manufacturing | 1 | $35B |
|
||
Price history
+43.2% since first listed4 events — show timeline
- 2026-06-10 Listed $295,000 CPARMLS
- 2018-09-27 Sold (Public Records) $200,000 Public Records
- 2018-09-26 Sold (MLS) $200,000 CPARMLS
- 2018-04-18 Listed $206,000 CPARMLS
Property tax history
+9.8%/yrLatest (2025): $2,977 · -6.7% YoY. Source: county tax records.
Cash-flow waterfall
monthlySold comps — $/sqft
last 12 mo · ≤1 miLoading sold comps…