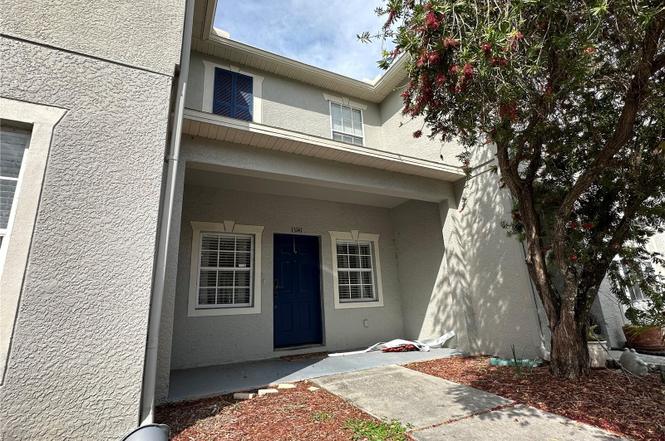
13141 Kings Crossing Dr · Gibsonton, FL
Flood risk 3/10 · Minor
- FEMA flood zone
- X (unshaded)
- Chance of flooding over 30 yrs
- 0.12%
- Est. flood insurance / yr
- $507 – $1,088
Fire risk 4/10 · Minor
- Est. fire insurance / yr
- $947 – $1,759
Heat risk 10/10 · Severe
- Hot days now (above 108°F)
- 7 days/yr
- Hot days in 30 yrs
- 29 days/yr
Wind risk 10/10 · Severe
- Chance of severe wind over 30 yrs
- 99.0%
Air-quality risk 3/10 · Minor
- Unhealthy air days now
- 3 days/yr
- Unhealthy air days in 30 yrs
- 4 days/yr
Risk factors via First Street. Map © Google.
Why this score? — see what drove the C- grade
The composite is a weighted blend of 9 inputs, each scored 0–100. Each bar is that input's sub-score; the figure is the points it added to the 100-point composite (weight × sub-score).
- Cash flow +18.0/30.0
- ARV discount +7.5/15.0
- 1% rule +5.6/10.0
- DSCR +5.6/10.0
- Rent growth +4.5/5.0
- Schools +4.2/10.0
- Livability +3.5/5.0
- Condition / age +2.5/5.0
- Appreciation +0.0/10.0
$199,000
🖨 Deal sheet 📄 Offer letter ✓ Due diligence
Listing remarks MLS
Hurry this won't last long! Come check out this newly remodeled townhouse. The best price around at the moment. Where everything is brand new! Paint, all cabinets, carpet, trim, light fixtures, stainless steel appliances, even the AC! The new vinyl is the water resistant type so you won't have to worry about spills!
Key facts
- Open living room
- In suite bathroom
- Front porch
Tags
Neighborhood map
What this means for you Summary
Snapshot
- This is a 2-bed/3.0-bath townhouse listed at $199k.
Deal economics
- At list price, monthly cash flow is $169 ($2k/yr) — positive.
- The deal already cash-flows at list — no discount required.
- Meets the 1% rule at list price ($2k rent vs $199k).
- Recommended offer: $187k (6.0% below list) — sets the bar for market timing.
Location & tenants
- Location reads 69/100 on livability (#479 in FL) — a middle-class / working-renter tenant base. Strengths: cost of living A+, housing A+, commute A-; Watch: amenities F, health & safety F.
- Hillsborough (suburban): math 47% / reading 50% proficiency, ranked #41 of 73 in FL (top 56%) — families likely to look elsewhere, expect single-tenant / working-renter base with shorter leases.
- Zoned schools: East Bay High School (math 24% / reading 35%, grade F, #447 of 667 statewide, top 68%, 1,995 students, 51% FRL) — zoned schools at 51% FRL track the district average.
- Zoned-school proficiency averages 30% at this address vs 48% district-wide (-19 pts) — the specific schools serving this property underperform the Hillsborough average; the district grade overstates school quality for this exact location.
- Market conditions: Rents rising fast (+8.1%/yr); 107 active listings in the ZIP; 7 comparable units currently listed for rent nearby; rentals leasing fast (median 5d on market — plan ~1-2 weeks tenant-placement turnaround); solid renter incomes; 9,053 units permitted in Hillsborough County in 2024 (4,555 in 5+ unit buildings).
- This rent runs 31% of the median local income ($80k/yr) — at the standard rent-burdened threshold; future hikes will face affordability resistance.
Forward outlook
- Local home prices are declining (-3.0%/yr); year-one equity from $1k of loan paydown is wiped out by about $6k of value loss. Plan a longer hold.
- Hillsborough County population projected at +37% by 2050 — long-run rental-demand tailwind backs the buy-and-hold thesis.
- At projected returns (-3.0% appreciation + 8.0% rent growth), your $56k cash investment doubles in ~10 years — after that, you're playing with house money.
Negotiation context
- It's been on market 78 days — a 6% lower offer ($187k) is reasonable based on typical stale-listing flexibility.
- 7 sale attempts since 22y ago; this cycle's ask has dropped $13k (6%) from the opening price — seller is motivated, your offer sets the floor, not the list.
- Current owner paid $125k; list at $199k implies a 59% gain — meaningful room to come down on a strong offer.
Risks & watch-outs
- Climate carrying-cost: severe wind risk, 99% chance of damaging wind over 30y; extreme-heat days projected 7→29/yr by 2055 (HVAC capex compounding) — expect insurance premiums to compound above CPI over the hold.
Questions for the listing agent
- It's been on market 78 days. Have you received any prior offers? Is the seller open to a 6% concession, seller financing, or rate buy-down credit?
- What does the HOA fee cover, when was the last increase, and are there any pending special assessments or reserve-fund shortfalls?
- Why hasn't it sold? Are there any deal-killer items the seller is aware of (foundation, flood, title, zoning, code violations)?
- Is there a deadline driving the sale (1031 exchange, divorce, estate, relocation)? That informs how much negotiation room exists.
- Schools are F-rated, which usually means shorter tenancies and higher turnover. Who's the typical renter profile here, and what's been the actual vacancy rate?
- What's the average days-on-market for RENTAL listings here right now (not sales)? A rising rental-DOM trend means longer vacancies and softer asking-rent achievability than the comps imply.
- What's the recent tenant-quality profile in this submarket — average credit score on applications, eviction rate, late-payment / NSF rate, and stable-employment percentage? A property-management company in the area should have these aggregated.
- How much new for-sale + rental construction is in the pipeline within 1–3 miles? Heavy new supply typically softens prices + rents 12–24 months out; constrained supply supports both.
Investment metrics
- 1% rule
- 1.06% ✓
- Cap rate
- 7.31%
- Cash-on-cash
- 3.65%
- DSCR
- 1.16
- GRM
- 7.9
CMA / ARV
No comps found within radius.
Projected returns pro-forma
-3.0% appreciation · 8.0% rent growth · sell at horizon
- IRR
- -4.6%
- Equity multiple
- 0.82×
- Total profit
- $-10,197
- Equity at exit
- $29,672
- IRR
- 10.4%
- Equity multiple
- 2.01×
- Total profit
- $56,210
- Equity at exit
- $17,206
Cash invested: $55,720 (down + closing). Projections, not guarantees.
Landlord ↔ Tenant lean methodology
- Overall (STATE)
- 87 Strongly Landlord-Friendly
- State Florida
- 87 Strongly Landlord-Friendly · R+3
- County
- — inherits STATE
- City
- — inherits STATE
ZIP-level market 33534
- Home prices YoY
- -18.2%
- Rents YoY
- 8.1%
- Active inventory
- 107
- Price-to-rent
- 7.9×
Monthly cashflow live
- Estimated rent
- $2,110 high interval (Pro) →
- Mortgage (P&I)
- −$1,044
- Tax from tax record
- −$132 /mo · $1,587/yr
- Insurance
- −$83
- HOA
- −$239
- Vacancy / Maint / Mgmt
- −$443
- Net cashflow
- $169
Break-even live
UW: 25.0% down · 7.5% · 30yr · 1.5% tax · 5.0% vac · 8.0% maint · 8.0% mgmt
Financing live
Cash to close
- Down payment
- $49,750
- Closing costs
- $5,970
- Reserves months
- —
- Total cash needed
- —
Loan-product check · same deal, 3 products live
Conventional
25% down · 7.5% · 30yr
- Down + closing
- —
- Monthly P&I
- —
- Monthly cashflow
- —
- DSCR
- —
- Eligible?
- —
Personal DTI + credit; lowest rate.
DSCR
20% down · 8.5% · 30yr
- Down + closing
- —
- Monthly P&I
- —
- Monthly cashflow
- —
- DSCR
- —
- Eligible?
- —
No personal income docs; deal must DSCR.
Hard money
10% down · 12.0% · 12mo
- Down + closing
- —
- Monthly P&I
- —
- Monthly cashflow
- —
- DSCR
- —
- Eligible?
- —
Short-term bridge; refi at stabilization.
Rent comps 7 comps
| Address | Beds | Baths | Sqft | Rent | $/sqft | DOM | Units | Dist |
|---|---|---|---|---|---|---|---|---|
| 13123 Kings Crossing Dr Gibsonton, FL | 3.0 | 2.5 | 1360 | $1,850 | $1.36 | 24d | 1 | 0.04mi |
| 6765 Lake Rochester Ln Gibsonton, FL | 2.0 | 2.5 | 1152 | $1,950 | $1.69 | 24d | 1 | 0.11mi |
| 6981 Tapestry Heights Ave Apollo Beach, FL | 3.0 | 1.0–2.0 | 1050 | $2,262 | $2.15 | 5d | 34 | 0.35mi |
| 12813 Kings Lake Dr Gibsonton, FL | 3.0 | 2.0 | 1391 | $2,650 | $1.91 | 24d | 1 | 0.53mi |
| 7002 Crown Lake Dr Gibsonton, FL | 3.0 | 2.0 | 1364 | $1,995 | $1.46 | 2d | 1 | 0.67mi |
| 7556 Oxford Garden Cir Apollo Beach, FL | 3.0 | 2.0 | 1335 | $2,020 | $1.51 | 5d | 1 | 1.16mi |
| 9814 Rustling Breeze Cir Riverview, FL | 1.0–3.0 | 1.0–2.0 | 999 | $2,228 | $2.23 | 3d | 35 | 1.45mi |
HOA detail
- Monthly dues
- $239 · $2,868/yr
- Likely covers
- water
Listing history 21 events
-
2026-04-17status Pending
-
2026-04-01price $199,000
-
2026-03-13price $205,000
-
2026-01-28$212,000 Active
-
2019-06-06soldstatus $125,000
-
2019-05-30soldstatus $125,000 Sold 318-char remark
Show marketing remark (318 chars)
Hurry this won't last long! Come check out this newly remodeled townhouse. The best price around at the moment. Where everything is brand new! Paint, all cabinets, carpet, trim, light fixtures, stainless steel appliances, even the AC! The new vinyl is the water resistant type so you won't have to worry about spills!
-
2019-04-15status Pending 318-char remark
Show marketing remark (318 chars)
Hurry this won't last long! Come check out this newly remodeled townhouse. The best price around at the moment. Where everything is brand new! Paint, all cabinets, carpet, trim, light fixtures, stainless steel appliances, even the AC! The new vinyl is the water resistant type so you won't have to worry about spills!
-
2019-04-08$135,000 Active 318-char remark
Show marketing remark (318 chars)
Hurry this won't last long! Come check out this newly remodeled townhouse. The best price around at the moment. Where everything is brand new! Paint, all cabinets, carpet, trim, light fixtures, stainless steel appliances, even the AC! The new vinyl is the water resistant type so you won't have to worry about spills!
-
2012-12-12soldstatus $55,000
-
2012-12-03soldstatus $55,000 293-char remark
Show marketing remark (293 chars)
THIS IS NOT A SHORT SALE. CAN CLOSE QUICKLY. OWNER WILL CONSIDER FINANCING. THIS TWO STORY town home IS LOCATED IN A LOVELY GATED COMMUNITY VERY CLOSE TO THE INTERSTATE. CLEAN AND FRESHLY PAINTED MOVE IN READY. LARGE LIVING ROOM. KITCHEN AND SCREENED lanai OVER LOOKING A BEAUTIFUL LARGE POND.
-
2012-08-02$58,000 293-char remark
Show marketing remark (293 chars)
THIS IS NOT A SHORT SALE. CAN CLOSE QUICKLY. OWNER WILL CONSIDER FINANCING. THIS TWO STORY town home IS LOCATED IN A LOVELY GATED COMMUNITY VERY CLOSE TO THE INTERSTATE. CLEAN AND FRESHLY PAINTED MOVE IN READY. LARGE LIVING ROOM. KITCHEN AND SCREENED lanai OVER LOOKING A BEAUTIFUL LARGE POND.
-
2011-05-10historical
-
2010-06-10$45,000
-
2006-04-25soldstatus $159,900
-
2006-04-07soldstatus $165,597
-
2006-03-09$159,900
-
2006-03-09historical
-
2005-11-13$169,900
-
2004-11-01soldstatus $111,990
-
2004-10-28$111,990
-
2004-06-03soldstatus $755,471
ⓘ Source: listings_history table (triggers on properties + properties_extension) + one-shot
backfill from property_details.listing_events for pre-trigger history.
Tax reassessment forecast FL · Resets to sale price
- Current annual tax
- $1,587 · $132/mo
- Projected year-2 tax
- $1,652 · $138/mo
- Expected delta
- +$65/yr (+$5/mo · 4.1%)
ⓘ Screening estimate from a state-policy table — verify with the county assessor before closing.
Climate risk First Street
- Flood 3/10 Moderate FEMA zone X (unshaded) · 12% chance over 30 yrs
- Wildfire 4/10 Moderate
- Heat 10/10 Extreme 7 d/yr ≥108°F today · 29 d/yr by 30 yrs out
- Wind 10/10 Extreme 99% chance of damaging wind over 30 yrs
- Air quality 3/10 Moderate 3 unhealthy d/yr today · 4 by 30 yrs out
Nearby sold comps map
Loading sold comps map…
Walkable amenities ~0.75 mi
Loading nearby amenities…
Taxation est. · year 1
- Rental income
- $25,324
- − Mortgage interest
- −$11,147
- − Property taxes
- −$1,587
- − Insurance
- −$995
- − Repairs & maintenance
- −$2,026
- − Management
- −$2,026
- − HOA
- −$2,868
- − Depreciation
- −$5,789
- Taxable loss
- −$1,114
- Est. tax savings @ 24.0%
- +$267
- After-tax cash flow
- $2,300/yr
For passive investors: Depreciation is non-cash, so a rental often shows a tax loss while cash-flowing — sheltering income. Rental losses are passive: they offset passive income freely, and up to $25,000/yr can offset ordinary (W-2) income if you actively participate and your MAGI is under $100k (phasing out to $0 by $150k); unused losses carry forward. On sale, claimed depreciation is recaptured at up to 25%, and gains may owe capital-gains tax (a 1031 exchange can defer both). Figures are a year-1 estimate at your 24.0% rate — not tax advice; consult a CPA.
Schools (NCES district)
- District
- Hillsborough
- NCES district ID
- 1200870
- Math proficiency
- 47% ▼ -8.00%
- Reading proficiency
- 50% ▼ -4.00%
- Median HH income
- $50,622
- Composite
- 41.6/100
- National rank
- #3435
- State rank
- #41 of 73 in FL
Livability — Gibsonton
- Score
- 69/100
- State rank
- #479
- US rank
- #8752
Category grades
Schools grade is shown separately in the Schools card above.
Census & demographics
- Census place
- Gibsonton, FL
- County
- Hillsborough County · 1,540,968 people
- City population
- 17,740
- Metro
- Tampa-St. Petersburg-Clearwater, FL
- Population (ZIP)
- 17,740
- Household income
- $80,484
- Rent vs Own
- Severe rent burden
- 487.0
Population outlook (Hillsborough County) Hauer SSP2
- Today (2025)
- 1,607,022 people
- By 2030
- 1,733,968 · +7.9%
- By 2040
- 1,979,565 · +23.2%
- By 2050
- 2,203,427 · +37.1%
- By 2075
- 2,667,893 · +66.0%
- By 2100
- 2,891,558 · +79.9%
Race, ethnicity, and origin ACS 2023
- Neighborhood character
- Diverse neighborhood (Simpson 0.69)
- Race & ethnicity
- Hispanic / Latino 38% White 36% Two or more races 23% Black 19% Asian 2%
- Hispanic origin (detail)
- Mexican 13% Puerto Rican 10% Cuban 4% Dominican 3%
- Common ancestry
- Hispanic 3% Russian 1% Lithuanian 1%
- Foreign-born
- 16% · Canada, Guatemala, Jamaica
- Languages at home
- 66% English-only · Spanish 30% French/Haitian/Cajun 2% Other Indo-European 1%
Political lean MEDSL · Hillsborough
- 2024 margin
- Toss-up / Even · D 47.8% · R 50.9% · Other 1.3%
- 2008→2024 swing
- -10.2pp toward R · 2008: 7.1pp · 2024: -3.1pp
- All cycles
- 2024: R+3.1 2020: D+6.9 2016: D+6.8 2012: D+6.7 2008: D+7.1
Not yet ingested
- Civics
- —
Market trends
- HPI YoY
- ▼ -72.07%
- Current HPI
- 323.4367
- Rent YoY
- ▲ 8.05%
- Metro
- Tampa-St. Petersburg-Clearwater, FL
- State GDP YoY
- ▲ 3.28%
- F500 in state
- 36
Industry mix (Fortune 500 HQ in FL)
| Industry | F500 HQs | Revenue |
|---|---|---|
| Industrial Technology | 2 | $29B |
|
||
| Insurance | 2 | $17B |
|
||
| Retail | 1 | $60B |
|
||
| Technology Distribution | 1 | $58B |
|
||
| Homebuilding | 1 | $35B |
|
||
| Technology Manufacturing | 1 | $35B |
|
||
Price history
-73.7% since first listed21 events — show timeline
- 2026-04-17 Pending — Stellar MLS as Distributed by MLS Grid
- 2026-04-01 Price Changed $199,000 Stellar MLS as Distributed by MLS Grid
- 2026-03-13 Price Changed $205,000 Stellar MLS as Distributed by MLS Grid
- 2026-01-28 Listed $212,000 Stellar MLS as Distributed by MLS Grid
- 2019-06-06 Sold (Public Records) $125,000 Public Records
- 2019-05-30 Sold (MLS) $125,000 Stellar MLS as Distributed by MLS Grid
- 2019-04-15 Pending — Stellar MLS as Distributed by MLS Grid
- 2019-04-08 Listed $135,000 Stellar MLS as Distributed by MLS Grid
- 2012-12-12 Sold (Public Records) $55,000 Public Records
- 2012-12-03 Sold (MLS) $55,000 Stellar MLS as Distributed by MLS Grid
- 2012-08-02 Listed $58,000 Stellar MLS as Distributed by MLS Grid
- 2011-05-10 Listing Removed — Stellar MLS as Distributed by MLS Grid
- 2010-06-10 Listed $45,000 Stellar MLS as Distributed by MLS Grid
- 2006-04-25 Sold (Public Records) $159,900 Public Records
- 2006-04-07 Sold (MLS) $165,597 Stellar MLS as Distributed by MLS Grid
- 2006-03-09 Listing Removed — Stellar MLS as Distributed by MLS Grid
- 2006-03-09 Listed $159,900 Stellar MLS as Distributed by MLS Grid
- 2005-11-13 Listed $169,900 Stellar MLS as Distributed by MLS Grid
- 2004-11-01 Sold (MLS) $111,990 Stellar MLS as Distributed by MLS Grid
- 2004-10-28 Listed $111,990 Stellar MLS as Distributed by MLS Grid
- 2004-06-03 Sold (Public Records) $755,471 Public Records
Property tax history
+9.6%/yrLatest (2025): $1,587 · -1.8% YoY. Source: county tax records.
Cash-flow waterfall
monthlySold comps — $/sqft
last 12 mo · ≤1 miLoading sold comps…