 12-Plex
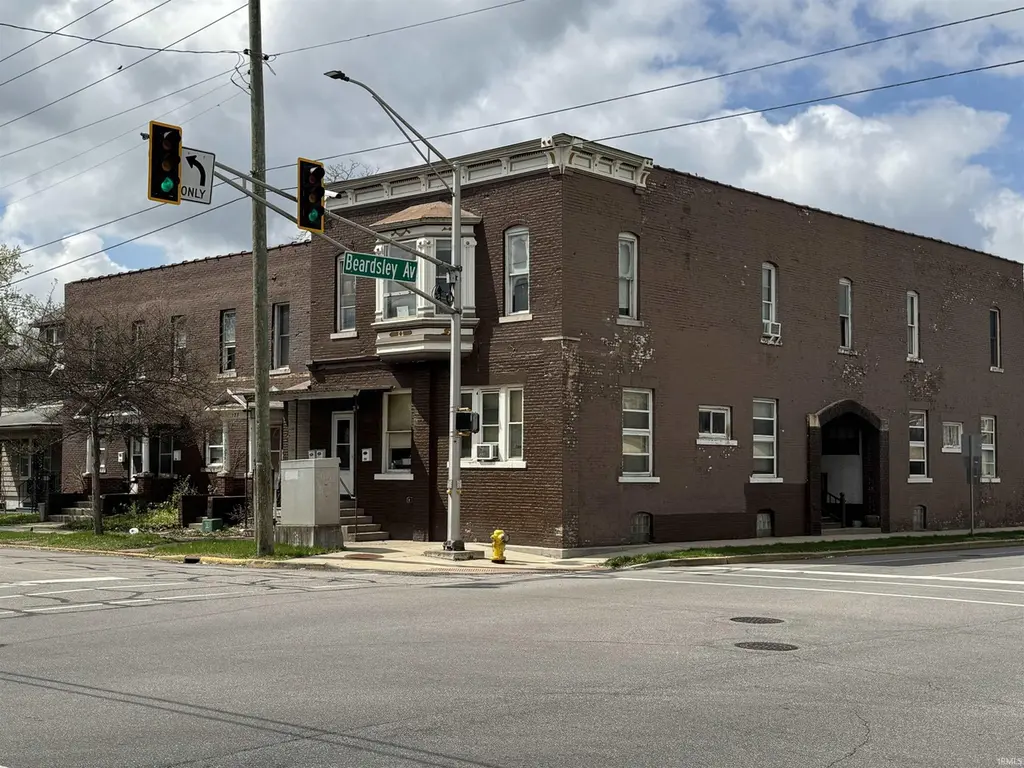
701 W Beardsley Ave · Elkhart, IN
Flood risk 1/10 · Minimal
- FEMA flood zone
- X (unshaded)
- Chance of flooding over 30 yrs
- 0.0%
- Est. flood insurance / yr
- $507 – $1,088
Fire risk 1/10 · Minimal
- Est. fire insurance / yr
- $717 – $1,331
Heat risk 3/10 · Minor
- Hot days now (above 101°F)
- 7 days/yr
- Hot days in 30 yrs
- 16 days/yr
Wind risk 2/10 · Minimal
- Chance of severe wind over 30 yrs
- —
Air-quality risk 3/10 · Minor
- Unhealthy air days now
- 2 days/yr
- Unhealthy air days in 30 yrs
- 3 days/yr
Risk factors via First Street. Map © Google.
Why this score? — see what drove the D grade
The composite is a weighted blend of 9 inputs, each scored 0–100. Each bar is that input's sub-score; the figure is the points it added to the 100-point composite (weight × sub-score).
- Cash flow +15.0/30.0
- ARV discount +7.5/15.0
- 1% rule +5.0/10.0
- DSCR +5.0/10.0
- Rent growth +4.3/5.0
- Livability +3.4/5.0
- Condition / age +2.5/5.0
- Schools +1.8/10.0
- Appreciation +0.0/10.0
$499,000
🖨 Deal sheet 📄 Offer letter ✓ Due diligence
Multi-family units
County records classify this as Multi-Family (5+ Unit). Listing-text estimate: 12 units. confirmed
5+ unit building — per-unit beds/baths from public records are typically unavailable; the breakdown below (if shown) is an estimate from the listing text.
Listing remarks MLS
* Multiple Offer Deadline - 4/23/26 10pm, Response 4/24/26 * Investor opportunity! This 12-unit multi-family property offers strong in-place income with significant upside potential. With a pro forma gross annual income exceeding $80,000, this property is well-positioned for growth. The building includes 9 leased units, 1 owner-occupied unit, and 2 vacant units in need of improvements for occupancy—providing immediate value-add potential. Recent electrical improvements allow for future separation of utilities, offering a path to reduced expenses and increased NOI. Additional features include a pole barn, a durable rubber roof, and a boiler approximately 8–10 years old. Ideal for a buy-and-improve investor focused on building equity and maximizing returns.
Key facts
- Leased units
- Owner-occupied unit
- Upside potential
Tags
Neighborhood map
What this means for you Summary
Snapshot
- This is a 12 × 16-bed/12.0-bath units multifamily listed at $499k.
Deal economics
- At list price, monthly cash flow is $14k ($169k/yr) — positive. Per door: $1k/mo.
- The deal already cash-flows at list — no discount required.
- Meets the 1% rule at list price ($22k rent vs $499k).
- Recommended offer: $492k (1.5% below list) — sets the bar for market timing.
- Cap rate 40.2% vs local median 4.0% in Elkhart — top-decile yield for the area; either an underpriced asset or a hidden risk that comps aren't pricing in. Stress-test before assuming the spread holds.
Location & tenants
- Location reads 68/100 on livability (#224 in IN) — a middle-class / working-renter tenant base. Strengths: cost of living A+, housing A+, health & safety A+; Watch: amenities C-, schools F, crime F.
- Elkhart Community Schools (urban): math 18% / reading 25% proficiency, ranked #271 of 301 in IN (top 90%) — low school quality limits family demand, transient renter base, plan for 1-2y turnover.
- Market conditions: Rents rising fast (+7.0%/yr); 269 active listings in the ZIP; 484 units permitted in Elkhart County in 2024 (136 in 5+ unit buildings).
- At $21,816/mo this rent would consume 398% of the median local household income ($66k/yr) (locally 1061% of renters already pay >50% of income on rent) — very limited rent-growth headroom before tenants either downsize or default.
Forward outlook
- Local home prices are declining (-3.0%/yr); year-one equity from $3k of loan paydown is wiped out by about $15k of value loss. Plan a longer hold.
- Elkhart County population projected at +7% by 2050 — modest demand growth; plan on rents tracking national, not racing it.
- At projected returns (-3.0% appreciation + 7.0% rent growth), your $140k cash investment doubles in ~1 year — after that, you're playing with house money.
Negotiation context
- It's been on market 17 days — a 2% lower offer ($492k) is reasonable based on typical stale-listing flexibility.
Risks & watch-outs
- Watch-outs: built in 1900 — expect roof / HVAC / electrical / plumbing capex.
Questions for the listing agent
- Can we see the unit-by-unit rent roll, current vacancy, and any below-market leases? What's the average tenancy length?
- What capital expenditures (roof, boiler, parking lot, exteriors) have been made in the last 5 years, and what's planned in the next 2?
- Built in 1900 — when were the roof, HVAC, electrical panel, plumbing, and water heater last replaced?
- Is there a deadline driving the sale (1031 exchange, divorce, estate, relocation)? That informs how much negotiation room exists.
- Schools are F-rated, which usually means shorter tenancies and higher turnover. Who's the typical renter profile here, and what's been the actual vacancy rate?
- Crime grade is F in this area — have there been break-ins, vandalism, or insurance claims at this property in the last 3 years? What carrier currently insures it and at what premium?
- The area grade is low — what's the realistic commute time and amenity access for the typical tenant pool here? Any planned neighborhood developments (good or bad) we should know about?
- What's the average days-on-market for RENTAL listings here right now (not sales)? A rising rental-DOM trend means longer vacancies and softer asking-rent achievability than the comps imply.
- What's the recent tenant-quality profile in this submarket — average credit score on applications, eviction rate, late-payment / NSF rate, and stable-employment percentage? A property-management company in the area should have these aggregated.
- How much new apartment / multifamily construction is in the pipeline within 1–3 miles? Heavy new supply (>2% of stock underway) typically softens rents 12–24 months out; light construction supports rent growth.
Investment metrics
- 1% rule
- 4.37% ✓
- Cap rate
- 40.23%
- Cash-on-cash
- 121.20%
- DSCR
- 6.39
- GRM
- 1.9
CMA / ARV
- ARV (median comp)
- $1,046,895
- List price
- $499,000
- Delta
- -52.34%
- Verdict
- UNDERPRICED
- Comps
- 2 within 1.0 mi
Projected returns pro-forma
-3.0% appreciation · 7.03% rent growth · sell at horizon
- IRR
- —
- Equity multiple
- 7.51×
- Total profit
- $910,125
- Equity at exit
- $74,403
- IRR
- —
- Equity multiple
- 17.90×
- Total profit
- $2,360,860
- Equity at exit
- $43,144
Cash invested: $139,720 (down + closing). Projections, not guarantees.
Landlord ↔ Tenant lean methodology
- Overall (STATE)
- 90 Strongly Landlord-Friendly
- State Indiana
- 90 Strongly Landlord-Friendly · R+11
- County
- — inherits STATE
- City
- — inherits STATE
ZIP-level market 46514
- Rents YoY
- 7.0%
- Active inventory
- 269
- Price-to-rent
- 22.9×
Monthly cashflow live
- Estimated rent
- $21,816 medium interval (Pro) →
- Mortgage (P&I)
- −$2,617
- Tax from tax record
- −$298 /mo · $3,573/yr
- Insurance
- −$208
- HOA
- −$0
- Vacancy / Maint / Mgmt
- −$4,581
- Net cashflow
- $14,112
Break-even live
12-unit breakdown (identical units grouped — click to expand)
| Units | Beds | Baths | Est. rent |
|---|---|---|---|
| 12× units | 16 | 12 | $21,816 |
| #1 | 16 | 12 | $1,818 |
| #2 | 16 | 12 | $1,818 |
| #3 | 16 | 12 | $1,818 |
| #4 | 16 | 12 | $1,818 |
| #5 | 16 | 12 | $1,818 |
| #6 | 16 | 12 | $1,818 |
| #7 | 16 | 12 | $1,818 |
| #8 | 16 | 12 | $1,818 |
| #9 | 16 | 12 | $1,818 |
| #10 | 16 | 12 | $1,818 |
| #11 | 16 | 12 | $1,818 |
| #12 | 16 | 12 | $1,818 |
| Total (12 units) | $21,816 | ||
UW: 25.0% down · 7.5% · 30yr · 1.5% tax · 5.0% vac · 8.0% maint · 8.0% mgmt
Financing live
Cash to close
- Down payment
- $124,750
- Closing costs
- $14,970
- Reserves months
- —
- Total cash needed
- —
Loan-product check · same deal, 3 products live
Conventional
25% down · 7.5% · 30yr
- Down + closing
- —
- Monthly P&I
- —
- Monthly cashflow
- —
- DSCR
- —
- Eligible?
- —
Personal DTI + credit; lowest rate.
DSCR
20% down · 8.5% · 30yr
- Down + closing
- —
- Monthly P&I
- —
- Monthly cashflow
- —
- DSCR
- —
- Eligible?
- —
No personal income docs; deal must DSCR.
Hard money
10% down · 12.0% · 12mo
- Down + closing
- —
- Monthly P&I
- —
- Monthly cashflow
- —
- DSCR
- —
- Eligible?
- —
Short-term bridge; refi at stabilization.
Listing history 2 events
-
2026-05-04status Pending 777-char remark
Show marketing remark (777 chars)
* Multiple Offer Deadline - 4/23/26 10pm, Response 4/24/26 * Investor opportunity! This 12-unit multi-family property offers strong in-place income with significant upside potential. With a pro forma gross annual income exceeding $80,000, this property is well-positioned for growth. The building includes 9 leased units, 1 owner-occupied unit, and 2 vacant units in need of improvements for occupancy—providing immediate value-add potential. Recent electrical improvements allow for future separation of utilities, offering a path to reduced expenses and increased NOI. Additional features include a pole barn, a durable rubber roof, and a boiler approximately 8–10 years old. Ideal for a buy-and-improve investor focused on building equity and maximizing returns.
-
2026-04-13$499,000 Active 777-char remark
Show marketing remark (777 chars)
* Multiple Offer Deadline - 4/23/26 10pm, Response 4/24/26 * Investor opportunity! This 12-unit multi-family property offers strong in-place income with significant upside potential. With a pro forma gross annual income exceeding $80,000, this property is well-positioned for growth. The building includes 9 leased units, 1 owner-occupied unit, and 2 vacant units in need of improvements for occupancy—providing immediate value-add potential. Recent electrical improvements allow for future separation of utilities, offering a path to reduced expenses and increased NOI. Additional features include a pole barn, a durable rubber roof, and a boiler approximately 8–10 years old. Ideal for a buy-and-improve investor focused on building equity and maximizing returns.
ⓘ Source: listings_history table (triggers on properties + properties_extension) + one-shot
backfill from property_details.listing_events for pre-trigger history.
Tax reassessment forecast IN · Partial reset (capped growth)
- Current annual tax
- $3,573 · $298/mo
- Projected year-2 tax
- $3,907 · $326/mo
- Expected delta
- +$334/yr (+$28/mo · 9.4%)
ⓘ Screening estimate from a state-policy table — verify with the county assessor before closing.
Climate risk First Street
- Flood 1/10 Low FEMA zone X (unshaded) · 0% chance over 30 yrs
- Wildfire 1/10 Low
- Heat 3/10 Moderate 7 d/yr ≥101°F today · 16 d/yr by 30 yrs out
- Wind 2/10 Low
- Air quality 3/10 Moderate 2 unhealthy d/yr today · 3 by 30 yrs out
Nearby sold comps map
Loading sold comps map…
Walkable amenities ~0.75 mi
Loading nearby amenities…
Taxation est. · year 1
- Rental income
- $261,792
- − Mortgage interest
- −$27,952
- − Property taxes
- −$3,573
- − Insurance
- −$2,495
- − Repairs & maintenance
- −$20,943
- − Management
- −$20,943
- − Depreciation
- −$14,516
- Taxable income
- $171,369
- Est. tax owed @ 24.0%
- −$41,129
- After-tax cash flow
- $128,218/yr
For passive investors: Depreciation is non-cash, so a rental often shows a tax loss while cash-flowing — sheltering income. Rental losses are passive: they offset passive income freely, and up to $25,000/yr can offset ordinary (W-2) income if you actively participate and your MAGI is under $100k (phasing out to $0 by $150k); unused losses carry forward. On sale, claimed depreciation is recaptured at up to 25%, and gains may owe capital-gains tax (a 1031 exchange can defer both). Figures are a year-1 estimate at your 24.0% rate — not tax advice; consult a CPA.
Schools (NCES district)
- District
- Elkhart Community Schools
- NCES district ID
- 1803270
- Math proficiency
- 18% ▼ -12.00%
- Reading proficiency
- 25% ▼ -9.00%
- Median HH income
- $42,881
- Composite
- 18.45/100
- National rank
- #8928
- State rank
- #271 of 301 in IN
Livability — Elkhart
- Score
- 68/100
- State rank
- #224
- US rank
- #9852
Category grades
Schools grade is shown separately in the Schools card above.
Census & demographics
- Census place
- Elkhart, IN
- County
- Elkhart County · 107,928 people
- City population
- 74,260
- Metro
- Elkhart-Goshen, IN
- Population (ZIP)
- 42,389
- Household income
- $65,833
- Rent vs Own
- Severe rent burden
- 1061.0
Population outlook (Elkhart County) Hauer SSP2
- Today (2025)
- 213,761 people
- By 2030
- 218,103 · +2.0%
- By 2040
- 225,381 · +5.4%
- By 2050
- 229,447 · +7.3%
- By 2075
- 232,856 · +8.9%
- By 2100
- 214,088 · +0.2%
Race, ethnicity, and origin ACS 2023
- Neighborhood character
- Predominantly White (74%)
- Race & ethnicity
- White 74% Hispanic / Latino 14% Two or more races 6% Black 5% Asian 1%
- Hispanic origin (detail)
- Mexican 10%
- Common ancestry
- Lithuanian 2% Romanian 2% Italian 2%
- Foreign-born
- 8% · Canada
- Languages at home
- 89% English-only · Spanish 10%
Political lean MEDSL · Elkhart
- 2024 margin
- Solid R (+32.4) · D 33.1% · R 65.5% · Other 1.4%
- 2008→2024 swing
- -21.2pp toward R · 2008: -11.2pp · 2024: -32.4pp
- All cycles
- 2024: R+32.4 2020: R+28.1 2016: R+32.4 2012: R+26.5 2008: R+11.2
Not yet ingested
- Civics
- —
Market trends
- HPI YoY
- ▼ -246.78%
- Current HPI
- 225.6
- Rent YoY
- ▲ 7.03%
- Metro
- Elkhart-Goshen, IN
- State GDP YoY
- ▲ 2.90%
- F500 in state
- 18
Industry mix (Fortune 500 HQ in IN)
| Industry | F500 HQs | Revenue |
|---|---|---|
| Industrial Machinery | 2 | $37B |
|
||
| Healthcare | 1 | $177B |
|
||
| Pharmaceuticals | 1 | $45B |
|
||
| Metals / Steel | 1 | $18B |
|
||
| Agriculture | 1 | $17B |
|
||
| Packaging | 1 | $12B |
|
||
Price history
2 events — show timeline
- 2026-05-04 Pending — IRMLS
- 2026-04-13 Listed $499,000 IRMLS
Property tax history
-2.7%/yrLatest (2025): $3,573 · +33.6% YoY. Source: county tax records.
Cash-flow waterfall
monthlySold comps — $/sqft
last 12 mo · ≤1 miLoading sold comps…