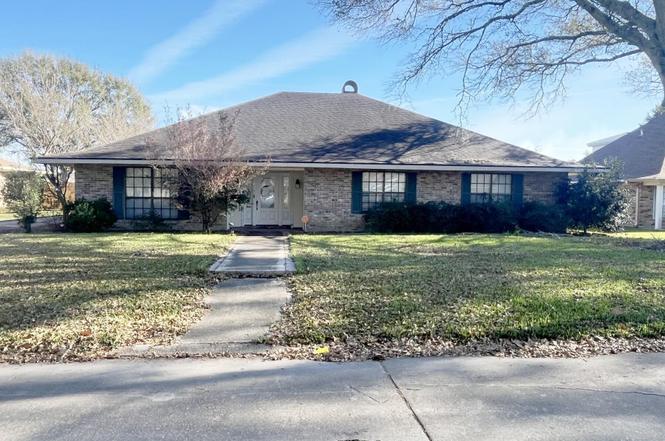
1612 Southwood Dr · New Iberia, LA
Flood risk 5/10 · Moderate
- FEMA flood zone
- X (unshaded)
- Chance of flooding over 30 yrs
- 0.24%
- Est. flood insurance / yr
- $507 – $1,088
Fire risk 1/10 · Minimal
- Est. fire insurance / yr
- $1,269 – $2,357
Heat risk 9/10 · Severe
- Hot days now (above 109°F)
- 7 days/yr
- Hot days in 30 yrs
- 23 days/yr
Wind risk 9/10 · Severe
- Chance of severe wind over 30 yrs
- 99.0%
Air-quality risk 2/10 · Minimal
- Unhealthy air days now
- 1 days/yr
- Unhealthy air days in 30 yrs
- 1 days/yr
Risk factors via First Street. Map © Google.
Why this score? — see what drove the C- grade
The composite is a weighted blend of 9 inputs, each scored 0–100. Each bar is that input's sub-score; the figure is the points it added to the 100-point composite (weight × sub-score).
- Cash flow +19.3/30.0
- ARV discount +12.5/15.0
- DSCR +6.1/10.0
- 1% rule +4.7/10.0
- Livability +3.7/5.0
- Schools +3.2/10.0
- Rent growth +2.5/5.0
- Condition / age +2.5/5.0
- Appreciation +0.0/10.0
$159,500
🖨 Deal sheet (PDF) 📄 Offer letter ✓ Due diligence
Listing remarks
This 6 bedroom, 2.5 bath full brick home welcomes you into a foyer that opens to the living room and formal dining room. The spacious living room features a fireplace and direct access to the patio. The eat-in kitchen offers a breakfast bar, granite countertops, white cabinetry with ample storage, and tile flooring. Recessed lighting in kitchen & living room. The large master suite has tray ceiling and separate walk-in closets, master bath with jet spa tub, separate shower, and dual vanities. Enjoy outdoor living in the fenced backyard with an in-ground pool and covered tiled patio. Additional features include a one-car attached garage with extra storage. Conveniently located near sch
Key facts
- Formal dining room
- Living room
- Eat-in kitchen
Tags
Neighborhood map
What this means for you Summary
Snapshot
- This is a 6-bed/2.5-bath single-family listed at $160k.
Deal economics
- At list price, monthly cash flow is $175 ($2k/yr) — positive.
- The deal already cash-flows at list — no discount required.
- To meet the 1% rule (rent ≥ 1% of price), the offer needs to be $154k (3.4% below list).
- Recommended offer: $154k (3.4% below list) — sets the bar for 1% rule.
- Cap rate 7.6% vs local median 5.8% in New Iberia — top-decile yield for the area; either an underpriced asset or a hidden risk that comps aren't pricing in. Stress-test before assuming the spread holds.
Location & tenants
- Location reads 73/100 on livability (#33 in LA) — a middle-class / working-renter tenant base. Strengths: cost of living A+, housing A+, health & safety A+; Watch: commute D+, crime F, employment F.
- Iberia Parish (other): math 32% / reading 43% proficiency, ranked #27 of 98 in LA (top 28%) — families likely to look elsewhere, expect single-tenant / working-renter base with shorter leases; 66% free/reduced lunch — lower-income household profile, screen leases tightly.
- Zoned schools: Magnolia Elementary (math 31% / reading 34%, grade F, #300 of 646 statewide, top 47%, 465 students, 77% FRL); Iberia Middle School (math 20% / reading 40%, grade F, #114 of 218 statewide, top 53%, 498 students, 77% FRL); New Iberia Senior High School (math 35% / reading 52%, grade F, #64 of 265 statewide, top 24%, 1,449 students, 62% FRL).
- Market conditions: 238 active listings in the ZIP; 94 units permitted in Iberia Parish in 2024 (0 in 5+ unit buildings).
Forward outlook
- Local home prices are declining (-3.0%/yr); year-one equity from $1k of loan paydown is wiped out by about $5k of value loss. Plan a longer hold.
- Iberia County population projected to shrink 4% by 2050 — rents likely to lag national; underwrite the cash flow, not the appreciation.
Negotiation context
- It's been on market 21 days — a 2% lower offer ($157k) is reasonable based on typical stale-listing flexibility.
- 2 sale attempts since 11y ago with the ask held roughly flat each time — persistent listings suggest the price (not the market) is what's stuck; bring a comps-based counter.
Risks & watch-outs
- Climate carrying-cost: moderate flood risk; severe wind risk, 99% chance of damaging wind over 30y; extreme-heat days projected 7→23/yr by 2055 (HVAC capex compounding) — expect insurance premiums to compound above CPI over the hold.
Questions for the listing agent
- Is there a deadline driving the sale (1031 exchange, divorce, estate, relocation)? That informs how much negotiation room exists.
- Schools are B-rated — typically a magnet for longer-tenancy family renters. What's the average tenant stay here, and is there a school-zone premium baked into asking?
- Crime grade is F in this area — have there been break-ins, vandalism, or insurance claims at this property in the last 3 years? What carrier currently insures it and at what premium?
- What's the average days-on-market for RENTAL listings here right now (not sales)? A rising rental-DOM trend means longer vacancies and softer asking-rent achievability than the comps imply.
- What's the recent tenant-quality profile in this submarket — average credit score on applications, eviction rate, late-payment / NSF rate, and stable-employment percentage? A property-management company in the area should have these aggregated.
- How much new for-sale + rental construction is in the pipeline within 1–3 miles? Heavy new supply typically softens prices + rents 12–24 months out; constrained supply supports both.
Investment metrics
- 1% rule
- 0.97% ✗
- Cap rate
- 7.61%
- Cash-on-cash
- 4.70%
- DSCR
- 1.21
- GRM
- 8.6
CMA / ARV
- ARV (on-the-fly)
- $179,304
- Comps found
- 1
Show comp detail 1 sale within ~0.75 mi
| Address | Dist | Beds/Ba | Sqft | Sold | Price | $/sf | Match |
|---|---|---|---|---|---|---|---|
| 1612 Southwood Dr | 0.00mi | 6/2.5 | 2,892 (0%) | 1mo | $180,000 | $62 | 99 |
Match score weights: distance 35% · size 25% · config 20% · recency 20%. Top-matched comps best support the ARV.
Projected returns pro-forma
-3.0% appreciation · 3.0% rent growth · sell at horizon
- IRR
- -9.0%
- Equity multiple
- 0.67×
- Total profit
- $-14,727
- Equity at exit
- $23,782
- IRR
- 0.5%
- Equity multiple
- 1.03×
- Total profit
- $1,455
- Equity at exit
- $13,791
Cash invested: $44,660 (down + closing). Projections, not guarantees.
Landlord ↔ Tenant lean methodology
- Overall (STATE)
- 90 Strongly Landlord-Friendly
- State Louisiana
- 90 Strongly Landlord-Friendly · R+12
- County
- — inherits STATE
- City
- — inherits STATE
ZIP-level market 70560
- Home prices YoY
- -29.8%
- Active inventory
- 238
- Price-to-rent
- 8.6×
Monthly cashflow live
- Estimated rent
- $1,541 medium interval (Pro) →
- Mortgage (P&I)
- −$836
- Tax from tax record
- −$140 /mo · $1,677/yr
- Insurance
- −$66
- HOA
- −$0
- Vacancy / Maint / Mgmt
- −$324
- Net cashflow
- $175
Break-even live
Sensitivity live
| Price | -10% $265 | -5% $220 | +0% $175 | +5% $130 | +10% $84 |
|---|---|---|---|---|---|
| Rent | -10% $53 | -5% $114 | +0% $175 | +5% $236 | +10% $297 |
| Rate | -1.0pp $255 | -0.5pp $215 | base $175 | +0.5pp $133 | +1.0pp $91 |
UW: 25.0% down · 7.5% · 30yr · 1.5% tax · 5.0% vac · 8.0% maint · 8.0% mgmt
Financing live
Cash to close
- Down payment
- $39,875
- Closing costs
- $4,785
- Reserves months
- —
- Total cash needed
- —
Loan-product check · same deal, 3 products live
Conventional
25% down · 7.5% · 30yr
- Down + closing
- —
- Monthly P&I
- —
- Monthly cashflow
- —
- DSCR
- —
- Eligible?
- —
Personal DTI + credit; lowest rate.
DSCR
20% down · 8.5% · 30yr
- Down + closing
- —
- Monthly P&I
- —
- Monthly cashflow
- —
- DSCR
- —
- Eligible?
- —
No personal income docs; deal must DSCR.
Hard money
10% down · 12.0% · 12mo
- Down + closing
- —
- Monthly P&I
- —
- Monthly cashflow
- —
- DSCR
- —
- Eligible?
- —
Short-term bridge; refi at stabilization.
Listing history 4 events
-
2026-02-06status Pending
-
2026-01-15$159,500 Active
-
2020-12-11soldstatus $246,000
-
2015-09-24$259,000
ⓘ Source: listings_history table (triggers on properties + properties_extension) + one-shot
backfill from property_details.listing_events for pre-trigger history.
Tax reassessment forecast LA · Resets to sale price
- Current annual tax
- $1,677 · $140/mo
- Projected year-2 tax
- $1,677 · $140/mo
- Expected delta
- $0/yr ($0/mo · 0.0%)
ⓘ Screening estimate from a state-policy table — verify with the county assessor before closing.
Climate risk First Street
- Flood 5/10 Major FEMA zone X (unshaded) · 24% chance over 30 yrs
- Wildfire 1/10 Low
- Heat 9/10 Extreme 7 d/yr ≥109°F today · 23 d/yr by 30 yrs out
- Wind 9/10 Extreme 99% chance of damaging wind over 30 yrs
- Air quality 2/10 Low 1 unhealthy d/yr today · 1 by 30 yrs out
Nearby sold comps map
Loading sold comps map…
Walkable amenities ~0.75 mi
Loading nearby amenities…
Taxation est. · year 1
- Rental income
- $18,492
- − Mortgage interest
- −$8,934
- − Property taxes
- −$1,677
- − Insurance
- −$798
- − Repairs & maintenance
- −$1,479
- − Management
- −$1,479
- − Depreciation
- −$4,640
- Taxable loss
- −$515
- Est. tax savings @ 24.0%
- +$124
- After-tax cash flow
- $2,221/yr
For passive investors: Depreciation is non-cash, so a rental often shows a tax loss while cash-flowing — sheltering income. Rental losses are passive: they offset passive income freely, and up to $25,000/yr can offset ordinary (W-2) income if you actively participate and your MAGI is under $100k (phasing out to $0 by $150k); unused losses carry forward. On sale, claimed depreciation is recaptured at up to 25%, and gains may owe capital-gains tax (a 1031 exchange can defer both). Figures are a year-1 estimate at your 24.0% rate — not tax advice; consult a CPA.
Schools (NCES district)
- District
- Iberia Parish
- NCES district ID
- 2200720
- Math proficiency
- 32% ▼ -43.00%
- Reading proficiency
- 43% ▼ -35.00%
- Median HH income
- $43,289
- Composite
- 31.74/100
- National rank
- #5904
- State rank
- #27 of 98 in LA
Livability — New Iberia
- Score
- 73/100
- State rank
- #33
- US rank
- #5376
Category grades
Schools grade is shown separately in the Schools card above.
Census & demographics
- Census place
- New Iberia, LA
- Population (ZIP)
- 37,589
Population outlook (Iberia County) Hauer SSP2
- Today (2025)
- 74,632 people
- By 2030
- 74,368 · -0.4%
- By 2040
- 73,223 · -1.9%
- By 2050
- 71,728 · -3.9%
- By 2075
- 69,028 · -7.5%
- By 2100
- 65,018 · -12.9%
Race, ethnicity, and origin ACS 2023
- Neighborhood character
- Diverse neighborhood (Simpson 0.61)
- Race & ethnicity
- White 52% Black 35% Two or more races 8% Hispanic / Latino 6% Asian 2%
- Hispanic origin (detail)
- Mexican 2%
- Common ancestry
- Lithuanian 11% Italian 1% Serbian 1%
- Foreign-born
- 3% · Canada
- Languages at home
- 93% English-only · French/Haitian/Cajun 3% Spanish 2% Other Asian/Pacific 1%
Political lean MEDSL · Iberia
- 2024 margin
- Solid R (+34.1) · D 32.4% · R 66.5% · Other 1.1%
- 2008→2024 swing
- -11.1pp toward R · 2008: -23.0pp · 2024: -34.1pp
- All cycles
- 2024: R+34.1 2020: R+31.2 2016: R+31.4 2012: R+26.2 2008: R+23.0
Not yet ingested
- Civics
- —
Market trends
- HPI YoY
- ▼ -65.82%
- Current HPI
- 154.9018
- Rent YoY
- —
- Metro
- —
- State GDP YoY
- ▲ 3.29%
- F500 in state
- 10
Industry mix (Fortune 500 HQ in LA)
| Industry | F500 HQs | Revenue |
|---|---|---|
| Telecommunications | 2 | $23B |
|
||
| Utilities | 1 | $12B |
|
||
| Wholesale / Distribution | 1 | $5B |
|
||
| Advertising | 1 | $2B |
|
||
Price history
-38.4% since first listed4 events — show timeline
- 2026-02-06 Pending — AcadianaMLS
- 2026-01-15 Listed $159,500 AcadianaMLS
- 2020-12-11 Sold (Public Records) $246,000 Public Records
- 2015-09-24 Listed $259,000 AcadianaMLS
Property tax history
+0.5%/yrLatest (2025): $1,677 · +2.0% YoY. Source: county tax records.
Cash-flow waterfall
monthlySold comps — $/sqft
last 12 mo · ≤1 miLoading sold comps…