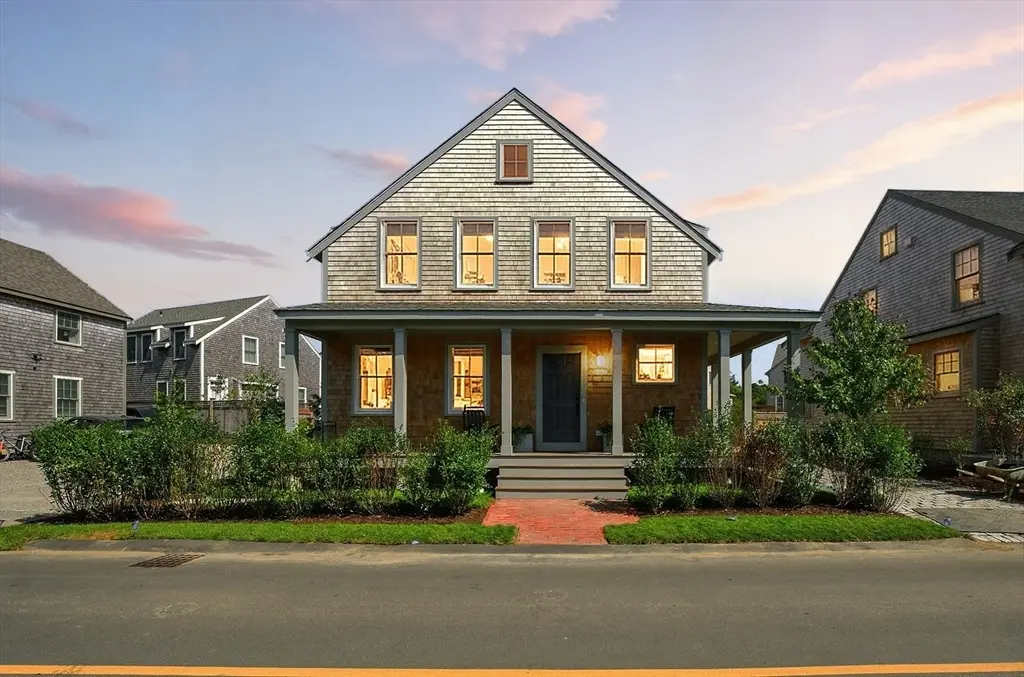
18 Honeysuckle Dr · Nantucket, MA
Flood risk No data
- FEMA flood zone
- —
- Chance of flooding over 30 yrs
- —
- Est. flood insurance / yr
- —
Fire risk No data
- Est. fire insurance / yr
- —
Heat risk No data
- Hot days now (above threshold)
- —
- Hot days in 30 yrs
- —
Wind risk No data
- Chance of severe wind over 30 yrs
- —
Air-quality risk No data
- Unhealthy air days now
- —
- Unhealthy air days in 30 yrs
- —
Risk factors via First Street. Map © Google.
Why this score? — see what drove the B grade
The composite is a weighted blend of 9 inputs, each scored 0–100. Each bar is that input's sub-score; the figure is the points it added to the 100-point composite (weight × sub-score).
- Cash flow +26.2/30.0
- Appreciation +10.0/10.0
- DSCR +8.9/10.0
- ARV discount +7.5/15.0
- 1% rule +7.1/10.0
- Condition / age +4.8/5.0
- Livability +3.6/5.0
- Schools +3.1/10.0
- Rent growth +2.5/5.0
$3,725,000
🖨 Deal sheet (PDF) 📄 Offer letter ✓ Due diligence
Listing remarks MLS
New construction—move-in July! Introducing Phase 3, the final release at Sandpiper Place II. This 4BD/4.5BA “Tide” home features high-end finishes throughout, including wide-plank hardwood floors, custom millwork, and a chef’s kitchen with premium appliances, upgraded countertops, and custom cabinetry. The open-concept layout is designed for effortless entertaining. The finished lower level adds exceptional flexibility with a spacious great room, bedroom/bath, & more—ideal for overflow living. Optional enhancements include pool, cabana, garage with 5th BR ADU, with town approval. Located just ~2 miles from Nantucket Town, the 36-home Sandpiper Place II community offers easy access to beaches and exclusive amenities at The Landing clubhouse, including a heated pool, fire pit, outdoor kitchen, putting green, fitness center, and indoor/outdoor gathering spaces.Showings by appointment with 24-hour notice.
Key facts
- Upgraded countertops
- High-end finishes
- Premium appliances
Tags
Neighborhood map
What this means for you Summary
Snapshot
- This is a 4-bed/4.5-bath single-family listed at $3.73M. Condition is rated excellent.
Deal economics
- At list price, monthly cash flow is $10k ($114k/yr) — positive.
- The deal already cash-flows at list — no discount required.
- Meets the 1% rule at list price ($45k rent vs $3.73M).
- Recommended offer: $3.50M (6.0% below list) — sets the bar for market timing.
Location & tenants
- Location reads 72/100 on livability (#112 in MA) — a middle-class / working-renter tenant base. Strengths: commute A+, employment A+, health & safety A+; Watch: amenities D+, cost of living F.
- Nantucket (town): math 23% / reading 41% proficiency, ranked #232 of 302 in MA (top 77%) — families likely to look elsewhere, expect single-tenant / working-renter base with shorter leases; only 16% free/reduced lunch — higher-income household profile.
- Market conditions: 10 active listings in the ZIP; 1 comparable units currently listed for rent nearby; 262 units permitted in Nantucket County in 2024 (20 in 5+ unit buildings).
Forward outlook
- In year one you build about $398k of equity ($26k loan paydown + $372k appreciation (10.0% local appreciation)).
- Nantucket County population projected at +31% by 2050 — long-run rental-demand tailwind backs the buy-and-hold thesis.
- At projected returns (10.0% appreciation + 3.0% rent growth), your $1.04M cash investment doubles in ~2 years — after that, you're playing with house money.
- By year 2, paydown + projected appreciation supports a ~$640k cash-out refi (75% LTV) — recoverable capital for the next deal without selling this one.
Negotiation context
- It's been on market 66 days — a 6% lower offer ($3.50M) is reasonable based on typical stale-listing flexibility.
Questions for the listing agent
- It's been on market 66 days. Have you received any prior offers? Is the seller open to a 6% concession, seller financing, or rate buy-down credit?
- What does the HOA fee cover, when was the last increase, and are there any pending special assessments or reserve-fund shortfalls?
- Why hasn't it sold? Are there any deal-killer items the seller is aware of (foundation, flood, title, zoning, code violations)?
- Is there a deadline driving the sale (1031 exchange, divorce, estate, relocation)? That informs how much negotiation room exists.
- Schools are B-rated — typically a magnet for longer-tenancy family renters. What's the average tenant stay here, and is there a school-zone premium baked into asking?
- What's the average days-on-market for RENTAL listings here right now (not sales)? A rising rental-DOM trend means longer vacancies and softer asking-rent achievability than the comps imply.
- What's the recent tenant-quality profile in this submarket — average credit score on applications, eviction rate, late-payment / NSF rate, and stable-employment percentage? A property-management company in the area should have these aggregated.
- How much new for-sale + rental construction is in the pipeline within 1–3 miles? Heavy new supply typically softens prices + rents 12–24 months out; constrained supply supports both.
Investment metrics
- 1% rule
- 1.21% ✓
- Cap rate
- 9.36%
- Cash-on-cash
- 10.95%
- DSCR
- 1.49
- GRM
- 6.9
CMA / ARV
- ARV (median comp)
- $2,387,825
- List price
- $3,725,000
- Delta
- 56.00%
- Verdict
- OVERPRICED
- Comps
- 15 within 1.0 mi
Show comp detail 4 sales within ~0.75 mi
| Address | Dist | Beds/Ba | Sqft | Sold | Price | $/sf | Match |
|---|---|---|---|---|---|---|---|
| 12 Beach Grass Rd | 0.00mi | 4/6.5 | 4,249 (+0%) | 9mo | $2,754,000 | $648 | 84 |
| 10 Beach Grass Rd | 0.00mi | 4/5.5 | 3,985 (-6%) | 6mo | $2,575,000 | $646 | 81 |
| 14 Beach Grass Rd | 0.42mi | 5/5.5 (+1) | 4,382 (+4%) | 8mo | $2,640,000 | $602 | 59 |
| 25 Beach Grass | 0.49mi | 5/4.5 (+1) | 3,700 (-12%) | 10mo | $2,272,500 | $614 | 43 |
Match score weights: distance 35% · size 25% · config 20% · recency 20%. Top-matched comps best support the ARV.
Projected returns pro-forma
10.0% appreciation · 3.0% rent growth · sell at horizon
- IRR
- 32.3%
- Equity multiple
- 3.53×
- Total profit
- $2,635,757
- Equity at exit
- $3,355,775
- IRR
- 27.9%
- Equity multiple
- 7.99×
- Total profit
- $7,286,889
- Equity at exit
- $7,236,856
Cash invested: $1,043,000 (down + closing). Projections, not guarantees.
Landlord ↔ Tenant lean methodology
- Overall (STATE)
- 20 Strongly Tenant-Friendly
- State Massachusetts
- 20 Strongly Tenant-Friendly · D+15
- County
- — inherits STATE
- City
- — inherits STATE
ZIP-level market 02554
- Home prices YoY
- 2.8%
- Active inventory
- 10
- Price-to-rent
- 6.9×
Monthly cashflow live
- Estimated rent
- $45,000 medium interval (Pro) →
- Mortgage (P&I)
- −$19,534
- Tax est. 1.5%
- −$4,656 /mo · $55,875/yr
- Insurance
- −$1,552
- HOA
- −$290
- Vacancy / Maint / Mgmt
- −$9,450
- Net cashflow
- $9,517
Break-even live
Sensitivity live
| Price | -10% $12,092 | -5% $10,804 | +0% $9,517 | +5% $8,230 | +10% $6,943 |
|---|---|---|---|---|---|
| Rent | -10% $5,962 | -5% $7,740 | +0% $9,517 | +5% $11,295 | +10% $13,072 |
| Rate | -1.0pp $11,393 | -0.5pp $10,465 | base $9,517 | +0.5pp $8,552 | +1.0pp $7,570 |
UW: 25.0% down · 7.5% · 30yr · 1.5% tax · 5.0% vac · 8.0% maint · 8.0% mgmt
Financing live
Cash to close
- Down payment
- $931,250
- Closing costs
- $111,750
- Reserves months
- —
- Total cash needed
- —
Loan-product check · same deal, 3 products live
Conventional
25% down · 7.5% · 30yr
- Down + closing
- —
- Monthly P&I
- —
- Monthly cashflow
- —
- DSCR
- —
- Eligible?
- —
Personal DTI + credit; lowest rate.
DSCR
20% down · 8.5% · 30yr
- Down + closing
- —
- Monthly P&I
- —
- Monthly cashflow
- —
- DSCR
- —
- Eligible?
- —
No personal income docs; deal must DSCR.
Hard money
10% down · 12.0% · 12mo
- Down + closing
- —
- Monthly P&I
- —
- Monthly cashflow
- —
- DSCR
- —
- Eligible?
- —
Short-term bridge; refi at stabilization.
Rent comps 1 comps
| Address | Beds | Baths | Sqft | Rent | $/sqft | DOM | Units | Dist |
|---|---|---|---|---|---|---|---|---|
| 30 Madequecham Valley Rd Nantucket, MA | 5.0 | 6.5 | 5455 | $45,000 | $8.25 | 44d | 1 | 1.04mi |
HOA detail
- Monthly dues
- $290 · $3,480/yr
- Likely covers
- poolgym
Listing history 17 events
-
2026-06-21days on market $3,725,000 Active 66 DOM
-
2026-06-18days on market $3,725,000 Active 64 DOM
-
2026-06-17days on market $3,725,000 Active 63 DOM
-
2026-06-16days on market $3,725,000 Active 62 DOM
-
2026-06-15days on market $3,725,000 Active 61 DOM
-
2026-06-13days on market $3,725,000 Active 59 DOM
-
2026-06-12days on market $3,725,000 Active 58 DOM
-
2026-06-09days on market $3,725,000 Active 55 DOM
-
2026-06-08days on market $3,725,000 Active 54 DOM
-
2026-06-07days on market $3,725,000 Active 53 DOM
-
2026-06-07days on market $3,725,000 Active 52 DOM
-
2026-06-04days on market $3,725,000 Active 49 DOM
-
2026-06-02days on market $3,725,000 Active 48 DOM
-
2026-06-01days on market $3,725,000 Active 47 DOM
-
2026-05-31days on market $3,725,000 Active 46 DOM
-
2026-05-31days on market $3,725,000 Active 45 DOM
-
2026-04-15$3,725,000 New 952-char remark
Show marketing remark (952 chars)
New construction—move-in July! Introducing Phase 3, the final release at Sandpiper Place II. This 4BD/4.5BA “Tide” home features high-end finishes throughout, including wide-plank hardwood floors, custom millwork, and a chef’s kitchen with premium appliances, upgraded countertops, and custom cabinetry. The open-concept layout is designed for effortless entertaining. The finished lower level adds exceptional flexibility with a spacious great room, bedroom/bath, & more—ideal for overflow living. Optional enhancements include pool, cabana, garage with 5th BR ADU, with town approval. Located just ~2 miles from Nantucket Town, the 36-home Sandpiper Place II community offers easy access to beaches and exclusive amenities at The Landing clubhouse, including a heated pool, fire pit, outdoor kitchen, putting green, fitness center, and indoor/outdoor gathering spaces.Showings by appointment with 24-hour notice.
ⓘ Source: listings_history table (triggers on properties + properties_extension) + one-shot
backfill from property_details.listing_events for pre-trigger history.
Nearby sold comps map
Loading sold comps map…
Walkable amenities ~0.75 mi
Loading nearby amenities…
Taxation est. · year 1
- Rental income
- $540,000
- − Mortgage interest
- −$208,658
- − Property taxes
- −$55,875
- − Insurance
- −$18,625
- − Repairs & maintenance
- −$43,200
- − Management
- −$43,200
- − HOA
- −$3,480
- − Depreciation
- −$108,364
- Taxable income
- $58,598
- Est. tax owed @ 24.0%
- −$14,064
- After-tax cash flow
- $100,145/yr
For passive investors: Depreciation is non-cash, so a rental often shows a tax loss while cash-flowing — sheltering income. Rental losses are passive: they offset passive income freely, and up to $25,000/yr can offset ordinary (W-2) income if you actively participate and your MAGI is under $100k (phasing out to $0 by $150k); unused losses carry forward. On sale, claimed depreciation is recaptured at up to 25%, and gains may owe capital-gains tax (a 1031 exchange can defer both). Figures are a year-1 estimate at your 24.0% rate — not tax advice; consult a CPA.
Condition & rehab AI · 12 photos
This move-in-ready home features modern finishes, an open-concept layout, and a finished lower level, making it ideal for both resale and rental.
Value-add opportunities
- Both Landscaping and curb appeal improvements — Enhances the home's curb appeal and can attract more buyers.
- Both Add a pool or cabana — These amenities can significantly increase the home's appeal and value, especially for families and vacation rentals.
- Both Install a smart home system — Modernizes the home and can increase its value by making it more energy-efficient and convenient for potential buyers or renters.
Renovation cost estimate screening
Value-add ROI direction
- Both Landscaping and curb appeal improvements — Enhances the home's curb appeal and can attract more buyers. ↑
- Both Add a pool or cabana — These amenities can significantly increase the home's appeal and value, especially for families and vacation rentals. ↑
- Both Install a smart home system — Modernizes the home and can increase its value by making it more energy-efficient and convenient for potential buyers or renters. ↑
ⓘ Cost ranges are severity-bucket heuristics (US national rule-of-thumb). Get contractor quotes + a written scope before underwriting a rehab budget.
Schools (NCES district)
- District
- Nantucket
- NCES district ID
- 2508250
- Math proficiency
- 23% ▼ -15.00%
- Reading proficiency
- 41% ▼ -4.00%
- Median HH income
- $86,141
- Composite
- 31.25/100
- National rank
- #6030
- State rank
- #232 of 302 in MA
Livability — Nantucket
- Score
- 72/100
- State rank
- #112
- US rank
- #5727
Category grades
Schools grade is shown separately in the Schools card above.
Census & demographics
- Census place
- Nantucket, MA
- City population
- 14,033
- Population (ZIP)
- 14,033
Population outlook (Nantucket County) Hauer SSP2
- Today (2025)
- 12,440 people
- By 2030
- 13,235 · +6.4%
- By 2040
- 14,813 · +19.1%
- By 2050
- 16,257 · +30.7%
- By 2075
- 19,666 · +58.1%
- By 2100
- 21,677 · +74.3%
Race, ethnicity, and origin ACS 2023
- Neighborhood character
- Predominantly White (69%)
- Race & ethnicity
- White 69% Hispanic / Latino 17% Two or more races 13% Black 9% Asian 2%
- Hispanic origin (detail)
- Cuban 5% Dominican 5%
- Common ancestry
- Romanian 3% Lithuanian 3% Slovak 3%
- Foreign-born
- 15% · Canada, South Korea
- Languages at home
- 84% English-only · Spanish 9% Russian/Polish/Slavic 3% Other Indo-European 2%
Political lean MEDSL · Nantucket
- 2024 margin
- Solid D (+36.9) · D 67.5% · R 30.7% · Other 1.8%
- 2008→2024 swing
- +0.4pp no change · 2008: 36.5pp · 2024: 36.9pp
- All cycles
- 2024: D+36.9 2020: D+45.5 2016: D+35.2 2012: D+26.9 2008: D+36.5
Not yet ingested
- Civics
- —
Market trends
- HPI YoY
- ▲ 11.26%
- Current HPI
- 410.6301
- Rent YoY
- —
- Metro
- —
- State GDP YoY
- ▲ 2.28%
- F500 in state
- 38
Industry mix (Fortune 500 HQ in MA)
| Industry | F500 HQs | Revenue |
|---|---|---|
| Technology | 3 | $17B |
|
||
| Insurance | 2 | $84B |
|
||
| Retail | 2 | $76B |
|
||
| Life Sciences | 1 | $43B |
|
||
| Energy Technology | 1 | $31B |
|
||
| Aerospace / Defense | 1 | $18B |
|
||
Price history
1 event — show timeline
- 2026-04-15 Listed $3,725,000 MLS PIN
Cash-flow waterfall
monthlySold comps — $/sqft
last 12 mo · ≤1 miLoading sold comps…