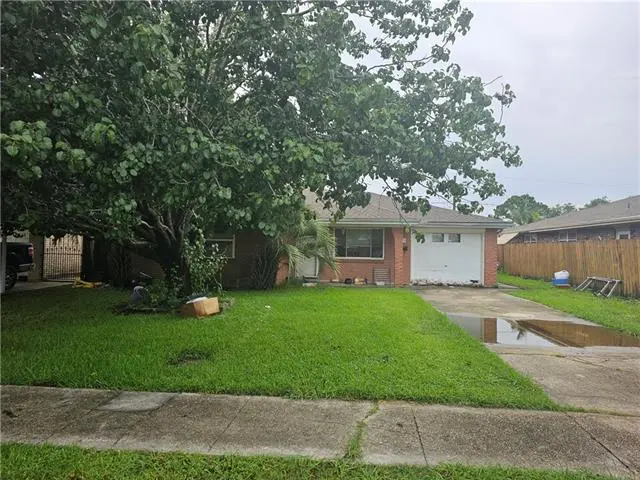
489 Fern Dr · Westwego, LA
Flood risk No data
- FEMA flood zone
- —
- Chance of flooding over 30 yrs
- —
- Est. flood insurance / yr
- —
Fire risk No data
- Est. fire insurance / yr
- —
Heat risk No data
- Hot days now (above threshold)
- —
- Hot days in 30 yrs
- —
Wind risk No data
- Chance of severe wind over 30 yrs
- —
Air-quality risk No data
- Unhealthy air days now
- —
- Unhealthy air days in 30 yrs
- —
Risk factors via First Street. Map © Google.
Why this score? — see what drove the D+ grade
The composite is a weighted blend of 9 inputs, each scored 0–100. Each bar is that input's sub-score; the figure is the points it added to the 100-point composite (weight × sub-score).
- Cash flow +18.1/30.0
- ARV discount +11.3/15.0
- DSCR +5.7/10.0
- 1% rule +4.1/10.0
- Livability +3.4/5.0
- Schools +2.5/10.0
- Condition / age +2.5/5.0
- Rent growth +2.3/5.0
- Appreciation +0.0/10.0
$219,900
🖨 Deal sheet 📄 Offer letter ✓ Due diligence
Listing remarks MLS
Well Maintained Home in a Quiet Neighborhood Located in a X Flood Zone that has a Large Workshop with loft area. Features 4 Bedrooms and 2 Full Bathrooms with a Open Floor Plan, Detached Garage, Laundry Room, Backyard Patio, Rear Yard Access and Just a Few Blocks from Westwego Library, Police Department, City Hall and Shopping Areas. Being sold AS IS. Owner will make no repairs
Key facts
- Open floor plan
- Backyard patio
- Rear yard access
Tags
Property features AI
Finance
- Other: No pets allowed (pet restrictions apply)
Exterior
- Parking: Detached garage; Off-street parking
- Utilities: Public water; Public sewer
- Home design: Single-story home; Brick construction; Asphalt roof; Entry level on slab foundation
- Construction: Built with brick; Slab foundation; Asphalt roof
- Exterior features: City lot; Rectangular lot
Interior
- Bedrooms: Includes bedrooms (number not specified)
- Bathrooms: 2 full bathrooms
- Heating & cooling: Central heating; Central air conditioning
- Interior features: Very good overall condition; Total of 5 rooms
Neighborhood map
What this means for you Summary
Snapshot
- This is a 4-bed/2.0-bath single-family listed at $220k.
Deal economics
- At list price, monthly cash flow is $194 ($2k/yr) — positive.
- The deal already cash-flows at list — no discount required.
- To meet the 1% rule (rent ≥ 1% of price), the offer needs to be $201k (8.7% below list).
- Recommended offer: $201k (8.7% below list) — sets the bar for 1% rule.
Location & tenants
- Location reads 68/100 on livability (#97 in LA) — a middle-class / working-renter tenant base. Strengths: cost of living A+, health & safety A+; Watch: schools C-, crime D, amenities D-.
- Jefferson Parish (suburban): math 24% / reading 34% proficiency, ranked #44 of 98 in LA (top 45%) — low school quality limits family demand, transient renter base, plan for 1-2y turnover; 70% free/reduced lunch — lower-income household profile, screen leases tightly.
- Market conditions: Rents soft (-0.8%/yr); 186 active listings in the ZIP; 11 comparable units currently listed for rent nearby; rentals at typical pace (median 24d on market — plan ~3-4 weeks tenant-placement turnaround); 518 units permitted in Jefferson Parish in 2024 (43 in 5+ unit buildings).
- This rent runs 45% of the median local income ($54k/yr) — at the standard rent-burdened threshold; future hikes will face affordability resistance.
Forward outlook
- Local home prices are declining (-3.0%/yr); year-one equity from $2k of loan paydown is wiped out by about $7k of value loss. Plan a longer hold.
Negotiation context
- It's been on market 38 days — a 3% lower offer ($213k) is reasonable based on typical stale-listing flexibility.
- 7 sale attempts since 32y ago with the ask held roughly flat each time — persistent listings suggest the price (not the market) is what's stuck; bring a comps-based counter.
- Current owner paid $161k; 37% above their basis — modest negotiation headroom, anchor on the comps not their cost.
Questions for the listing agent
- It's been on market 38 days. Have you received any prior offers? Is the seller open to a 9% concession, seller financing, or rate buy-down credit?
- Built in 1978 — when were the roof, HVAC, electrical panel, plumbing, and water heater last replaced?
- Is there a deadline driving the sale (1031 exchange, divorce, estate, relocation)? That informs how much negotiation room exists.
- Crime grade is D in this area — have there been break-ins, vandalism, or insurance claims at this property in the last 3 years? What carrier currently insures it and at what premium?
- The area grade is low — what's the realistic commute time and amenity access for the typical tenant pool here? Any planned neighborhood developments (good or bad) we should know about?
- What's the average days-on-market for RENTAL listings here right now (not sales)? A rising rental-DOM trend means longer vacancies and softer asking-rent achievability than the comps imply.
- What's the recent tenant-quality profile in this submarket — average credit score on applications, eviction rate, late-payment / NSF rate, and stable-employment percentage? A property-management company in the area should have these aggregated.
- How much new for-sale + rental construction is in the pipeline within 1–3 miles? Heavy new supply typically softens prices + rents 12–24 months out; constrained supply supports both.
Investment metrics
- 1% rule
- 0.91% ✗
- Cap rate
- 7.35%
- Cash-on-cash
- 3.79%
- DSCR
- 1.17
- GRM
- 9.1
CMA / ARV
- ARV (median comp)
- $240,173
- List price
- $219,900
- Delta
- -8.44%
- Verdict
- FAIR
- Comps
- 20 within 1.0 mi
Show comp detail 12 sales within ~0.75 mi
| Address | Dist | Beds/Ba | Sqft | Sold | Price | $/sf | Match |
|---|---|---|---|---|---|---|---|
| 714 West Dr | 0.29mi | 3/1.0 (-1) | 1,600 (-3%) | 3mo | $55,000 | $34 | 70 |
| 927 Cedre Dr | 0.08mi | 3/2.0 (-1) | 1,801 (+9%) | 18mo | $187,000 | $104 | 61 |
| 718 West Dr | 0.30mi | 4/2.0 | 1,827 (+11%) | 10mo | $275,000 | $151 | 60 |
| 628 Keller Ave | 0.32mi | 3/2.0 (-1) | 1,700 (+3%) | 22mo | $235,000 | $138 | 57 |
| 801 Central Ave | 0.41mi | 4/2.0 | 1,741 (+6%) | 21mo | $233,000 | $134 | 54 |
| 802 Avenue B Ave | 0.59mi | 4/2.0 | 1,700 (+3%) | 22mo | $175,000 | $103 | 49 |
| 440 Klein St | 0.33mi | 4/2.0 | 1,835 (+11%) | 21mo | $220,000 | $120 | 48 |
| 725 Chipley St | 0.46mi | 5/2.0 (+1) | 1,828 (+11%) | 10mo | $153,000 | $84 | 47 |
| 451 Sala Ave | 0.57mi | 3/2.0 (-1) | 1,464 (-11%) | 11mo | $155,000 | $106 | 41 |
| 815 W Crystal Ct | 0.58mi | 3/2.0 (-1) | 1,486 (-10%) | 15mo | $239,900 | $161 | 39 |
| 541 Avenue A | 0.49mi | 3/2.0 (-1) | 1,460 (-12%) | 23mo | $209,900 | $144 | 34 |
| 821 Barbe St | 0.56mi | 3/2.0 (-1) | 1,433 (-13%) | 18mo | $174,900 | $122 | 32 |
Match score weights: distance 35% · size 25% · config 20% · recency 20%. Top-matched comps best support the ARV.
Projected returns pro-forma
-3.0% appreciation · 0.0% rent growth · sell at horizon
- IRR
- -13.6%
- Equity multiple
- 0.53×
- Total profit
- $-29,187
- Equity at exit
- $32,788
- IRR
- -9.8%
- Equity multiple
- 0.47×
- Total profit
- $-32,417
- Equity at exit
- $19,013
Cash invested: $61,572 (down + closing). Projections, not guarantees.
Landlord ↔ Tenant lean methodology
- Overall (STATE)
- 90 Strongly Landlord-Friendly
- State Louisiana
- 90 Strongly Landlord-Friendly · R+12
- County
- — inherits STATE
- City
- — inherits STATE
ZIP-level market 70094
- Rents YoY
- -0.8%
- Active inventory
- 186
- Price-to-rent
- 9.1×
Monthly cashflow live
- Estimated rent
- $2,009 high interval (Pro) →
- Mortgage (P&I)
- −$1,153
- Tax from tax record
- −$148 /mo · $1,773/yr
- Insurance
- −$92
- HOA
- −$0
- Vacancy / Maint / Mgmt
- −$422
- Net cashflow
- $194
Break-even live
UW: 25.0% down · 7.5% · 30yr · 1.5% tax · 5.0% vac · 8.0% maint · 8.0% mgmt
Financing live
Cash to close
- Down payment
- $54,975
- Closing costs
- $6,597
- Reserves months
- —
- Total cash needed
- —
Loan-product check · same deal, 3 products live
Conventional
25% down · 7.5% · 30yr
- Down + closing
- —
- Monthly P&I
- —
- Monthly cashflow
- —
- DSCR
- —
- Eligible?
- —
Personal DTI + credit; lowest rate.
DSCR
20% down · 8.5% · 30yr
- Down + closing
- —
- Monthly P&I
- —
- Monthly cashflow
- —
- DSCR
- —
- Eligible?
- —
No personal income docs; deal must DSCR.
Hard money
10% down · 12.0% · 12mo
- Down + closing
- —
- Monthly P&I
- —
- Monthly cashflow
- —
- DSCR
- —
- Eligible?
- —
Short-term bridge; refi at stabilization.
Rent comps 11 comps
| Address | Beds | Baths | Sqft | Rent | $/sqft | DOM | Units | Dist |
|---|---|---|---|---|---|---|---|---|
| 181 Louisiana St Westwego, LA | 4.0 | 2.0 | 1500 | $1,550 | $1.03 | 43d | 1 | 0.67mi |
| 525 Emile Ave Westwego, LA | 3.0 | 2.0 | 1329 | $800 | $0.60 | 23d | 1 | 0.77mi |
| 1060 Avenue B Unit A Westwego, LA | 3.0 | 2.0 | 1124 | $1,550 | $1.38 | 23d | 1 | 0.84mi |
| 7804 Britt St Westwego, LA | 5.0 | 2.0 | 1512 | $1,800 | $1.19 | 43d | 1 | 0.85mi |
| 1233 Central Ave Westwego, LA | 3.0 | 1.5 | 1357 | $1,500 | $1.11 | 23d | 1 | 0.90mi |
| 653 Vic a Pitre Dr Westwego, LA | 3.0 | 2.0 | 1491 | $2,200 | $1.48 | 4d | 1 | 0.92mi |
| 1226 Kenny Dr Westwego, LA | 4.0 | 2.0 | 1300 | $1,650 | $1.27 | 23d | 1 | 1.02mi |
| 1029 Joyce St Marrero, LA | 3.0 | 2.0 | 1300 | $1,650 | $1.27 | 14d | 1 | 1.03mi |
| 617 Henry Clay Ave New Orleans, LA | 3.0 | 2.0 | 2000 | $3,200 | $1.60 | 3d | 1 | 1.35mi |
| 22 Gladiola Ct Marrero, LA | 3.0 | 2.0 | 1933 | $2,200 | $1.14 | 43d | 1 | 1.39mi |
| 735 State St Unit D New Orleans, LA | 3.0 | 2.0 | 1225 | $2,800 | $2.29 | 23d | 1 | 1.48mi |
Listing history 27 events
-
2026-06-18days on market $219,900 Active 38 DOM
-
2026-06-17days on market $219,900 Active 37 DOM
-
2026-06-16days on market $219,900 Active 36 DOM
-
2026-06-15days on market $219,900 Active 35 DOM
-
2026-06-13days on market $219,900 Active 33 DOM
-
2026-06-10days on market $219,900 Active 30 DOM
-
2026-06-09days on market $219,900 Active 29 DOM
-
2026-06-08days on market $219,900 Active 28 DOM
-
2026-06-07days on market $219,900 Active 27 DOM
-
2026-06-03days on market $219,900 Active 23 DOM
-
2026-06-02days on market $219,900 Active 22 DOM
-
2026-06-01days on market $219,900 Active 21 DOM
-
2026-05-31days on market $219,900 Active 20 DOM
-
2026-05-11$219,900 Active 380-char remark
Show marketing remark (380 chars)
Well Maintained Home in a Quiet Neighborhood Located in a X Flood Zone that has a Large Workshop with loft area. Features 4 Bedrooms and 2 Full Bathrooms with a Open Floor Plan, Detached Garage, Laundry Room, Backyard Patio, Rear Yard Access and Just a Few Blocks from Westwego Library, Police Department, City Hall and Shopping Areas. Being sold AS IS. Owner will make no repairs
-
2024-11-01historical $2,050
-
2024-08-28price $2,050
-
2024-06-19$2,200
-
2018-04-10soldstatus $161,000
-
2018-04-09soldstatus $161,000 Sold
Show marketing remark (381 chars)
Very Well Maintained Home in a Quiet Neighborhood Located in a X Flood Zone that has a Large Workshop with endless possibilities to be converted to Your Desire. Features a 3 Bedroom 2 Bath with a Open Floor Plan, Garage, Laundry Room, Backyard Patio, Rear Yard Access and Just a Few Blocks from Westwego Library, Police Department, City Hall and Shopping Areas. Schedule Your Tour!
-
2018-03-09status Under Contract
Show marketing remark (381 chars)
Very Well Maintained Home in a Quiet Neighborhood Located in a X Flood Zone that has a Large Workshop with endless possibilities to be converted to Your Desire. Features a 3 Bedroom 2 Bath with a Open Floor Plan, Garage, Laundry Room, Backyard Patio, Rear Yard Access and Just a Few Blocks from Westwego Library, Police Department, City Hall and Shopping Areas. Schedule Your Tour!
-
2018-02-06$175,000 Active
Show marketing remark (381 chars)
Very Well Maintained Home in a Quiet Neighborhood Located in a X Flood Zone that has a Large Workshop with endless possibilities to be converted to Your Desire. Features a 3 Bedroom 2 Bath with a Open Floor Plan, Garage, Laundry Room, Backyard Patio, Rear Yard Access and Just a Few Blocks from Westwego Library, Police Department, City Hall and Shopping Areas. Schedule Your Tour!
-
2018-02-06$175,000
Show marketing remark (381 chars)
Very Well Maintained Home in a Quiet Neighborhood Located in a X Flood Zone that has a Large Workshop with endless possibilities to be converted to Your Desire. Features a 3 Bedroom 2 Bath with a Open Floor Plan, Garage, Laundry Room, Backyard Patio, Rear Yard Access and Just a Few Blocks from Westwego Library, Police Department, City Hall and Shopping Areas. Schedule Your Tour!
-
2002-04-01soldstatus $115,000
-
1994-12-29soldstatus $65,000
-
1994-10-06$68,500
-
1994-10-06$68,500
ⓘ Source: listings_history table (triggers on properties + properties_extension) + one-shot
backfill from property_details.listing_events for pre-trigger history.
Tax reassessment forecast LA · Resets to sale price
- Current annual tax
- $1,773 · $148/mo
- Projected year-2 tax
- $1,773 · $148/mo
- Expected delta
- $0/yr ($0/mo · 0.0%)
ⓘ Screening estimate from a state-policy table — verify with the county assessor before closing.
Nearby sold comps map
Loading sold comps map…
Walkable amenities ~0.75 mi
Loading nearby amenities…
Taxation est. · year 1
- Rental income
- $24,105
- − Mortgage interest
- −$12,318
- − Property taxes
- −$1,773
- − Insurance
- −$1,100
- − Repairs & maintenance
- −$1,928
- − Management
- −$1,928
- − Depreciation
- −$6,397
- Taxable loss
- −$1,339
- Est. tax savings @ 24.0%
- +$321
- After-tax cash flow
- $2,654/yr
For passive investors: Depreciation is non-cash, so a rental often shows a tax loss while cash-flowing — sheltering income. Rental losses are passive: they offset passive income freely, and up to $25,000/yr can offset ordinary (W-2) income if you actively participate and your MAGI is under $100k (phasing out to $0 by $150k); unused losses carry forward. On sale, claimed depreciation is recaptured at up to 25%, and gains may owe capital-gains tax (a 1031 exchange can defer both). Figures are a year-1 estimate at your 24.0% rate — not tax advice; consult a CPA.
Schools (NCES district)
- District
- Jefferson Parish
- NCES district ID
- 2200840
- Math proficiency
- 24% ▼ -36.00%
- Reading proficiency
- 34% ▼ -30.00%
- Median HH income
- $48,421
- Composite
- 25.19/100
- National rank
- #7511
- State rank
- #44 of 98 in LA
Livability — Westwego
- Score
- 68/100
- State rank
- #97
- US rank
- #9851
Category grades
Schools grade is shown separately in the Schools card above.
Census & demographics
- Census place
- Westwego, LA
- County
- Jefferson Parish · 426,999 people
- City population
- 32,130
- Metro
- New Orleans-Metairie, LA
- Population (ZIP)
- 32,130
- Household income
- $53,597
- Rent vs Own
- Severe rent burden
- 1457.0
Population outlook (Jefferson County) Hauer SSP2
- Today (2025)
- 451,696 people
- By 2030
- 455,451 · +0.8%
- By 2040
- 458,308 · +1.5%
- By 2050
- 461,031 · +2.1%
- By 2075
- 476,351 · +5.5%
- By 2100
- 499,377 · +10.6%
Race, ethnicity, and origin ACS 2023
- Neighborhood character
- Diverse neighborhood (Simpson 0.65)
- Race & ethnicity
- Black 46% White 36% Hispanic / Latino 13% Two or more races 6% Asian 2%
- Hispanic origin (detail)
- Mexican 2% Dominican 2%
- Common ancestry
- Lithuanian 9% Scottish 1%
- Foreign-born
- 8% · Canada, Vietnam
- Languages at home
- 86% English-only · Spanish 11% Vietnamese 2% French/Haitian/Cajun 1%
Political lean MEDSL · Jefferson
- 2024 margin
- R (+12.9) · D 42.5% · R 55.5% · Other 2.1%
- 2008→2024 swing
- +13.6pp toward D · 2008: -26.6pp · 2024: -12.9pp
- All cycles
- 2024: R+12.9 2020: R+11.1 2016: R+14.8 2012: R+18.4 2008: R+26.6
Not yet ingested
- Civics
- —
Market trends
- HPI YoY
- ▼ -111.56%
- Current HPI
- 102.9992
- Rent YoY
- ▼ -0.80%
- Metro
- New Orleans-Metairie, LA
- State GDP YoY
- ▲ 3.29%
- F500 in state
- 10
Industry mix (Fortune 500 HQ in LA)
| Industry | F500 HQs | Revenue |
|---|---|---|
| Telecommunications | 2 | $23B |
|
||
| Utilities | 1 | $12B |
|
||
| Wholesale / Distribution | 1 | $5B |
|
||
| Advertising | 1 | $2B |
|
||
Price history
+221.0% since first listed14 events — show timeline
- 2026-05-11 Listed $219,900 GSREIN
- 2026-05-11 Listed $219,900 AcadianaMLS
- 2024-11-01 Rental Removed $2,050 GSREIN
- 2024-08-28 Price Changed $2,050 GSREIN
- 2024-06-19 Listed for Rent $2,200 GSREIN
- 2018-04-10 Sold (Public Records) $161,000 Public Records
- 2018-04-09 Sold (MLS) $161,000 GSREIN
- 2018-03-09 Pending — GSREIN
- 2018-02-06 Listed $175,000 AcadianaMLS
- 2018-02-06 Listed $175,000 GSREIN
- 2002-04-01 Sold (Public Records) $115,000 Public Records
- 1994-12-29 Sold (MLS) $65,000 GSREIN
- 1994-10-06 Listed $68,500 GSREIN
- 1994-10-06 Listed $68,500 AcadianaMLS
Property tax history
+4.2%/yrLatest (2025): $1,773 · -0.2% YoY. Source: county tax records.
Cash-flow waterfall
monthlySold comps — $/sqft
last 12 mo · ≤1 miLoading sold comps…