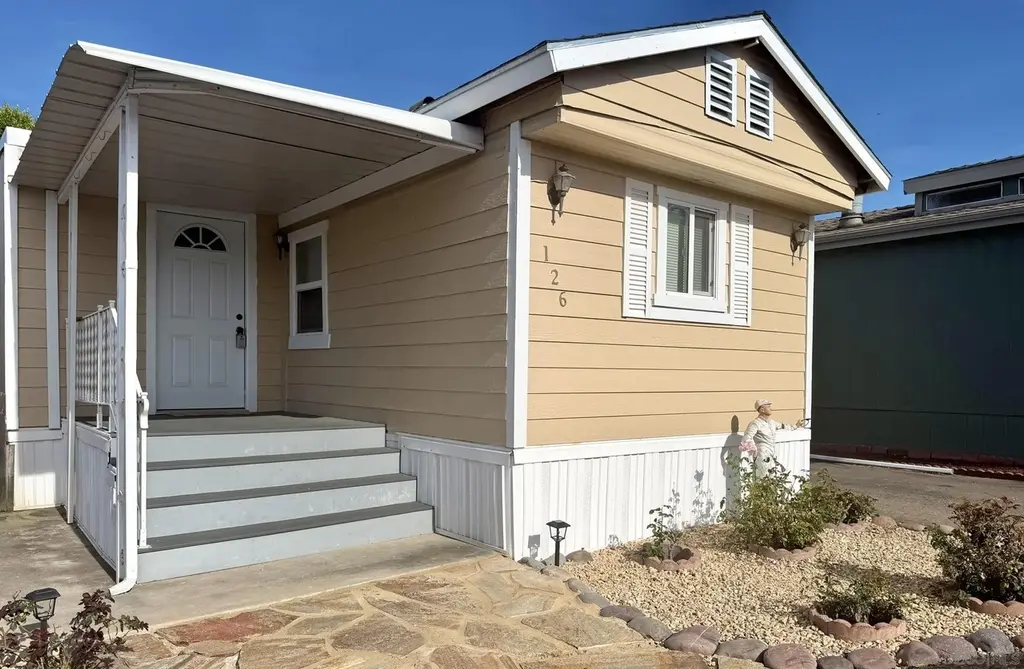
6460 Convoy Ct #126 · San Diego, CA
Flood risk 1/10 · Minimal
- FEMA flood zone
- X (unshaded)
- Chance of flooding over 30 yrs
- 0.0%
- Est. flood insurance / yr
- $507 – $1,088
Fire risk 3/10 · Minor
- Est. fire insurance / yr
- $659 – $1,223
Heat risk 3/10 · Minor
- Hot days now (above 89°F)
- 6 days/yr
- Hot days in 30 yrs
- 18 days/yr
Wind risk 1/10 · Minimal
- Chance of severe wind over 30 yrs
- —
Air-quality risk 3/10 · Minor
- Unhealthy air days now
- 4 days/yr
- Unhealthy air days in 30 yrs
- 4 days/yr
Risk factors via First Street. Map © Google.
Why this score? — see what drove the C- grade
The composite is a weighted blend of 9 inputs, each scored 0–100. Each bar is that input's sub-score; the figure is the points it added to the 100-point composite (weight × sub-score).
- Cash flow +26.4/30.0
- DSCR +9.0/10.0
- 1% rule +7.1/10.0
- Livability +3.8/5.0
- Rent growth +2.9/5.0
- Condition / age +2.5/5.0
- Schools +2.2/10.0
- ARV discount +0.0/15.0
- Appreciation +0.0/10.0
$190,000
🖨 Deal sheet 📄 Offer letter ✓ Due diligence
Listing remarks
Fully remodeled 2-bedroom, 1 bathroom manufactured home centrally located in the heart of San Diego. This move-in ready home is part of an all ages, pet-friendly community park that features multiple swimming pools and a clubhouse. The home has been completely renovated and includes new vinyl flooring, new drywall, recessed lighting, and has been freshly painted in both the interior & exterior. The kitchen includes refinished and freshly painted cabinets, butcher block countertops, and a new sink, refrigerator and dishwasher. New roof in 2022. Stacked laundry is located inside the refinished bathroom. Covered carport driveway can fit 2 cars. Tool/storage shed in backyard for added con
Key facts
- New drywall
- Clubhouse
- Freshly painted
Tags
Property features AI
Finance
- Other: Located in Clairemont subdivision; Directions: Once in the park, head straight and take the second right straight to the back. House is on the right hand side.
- HOA & community: Clubhouse; Kearny Lodge Mobile Home Park (community/park)
Exterior
- Parking: 2 parking spaces
- Utilities: Public water; Public sewer
- Home design: Manufactured home (residential); 1 story
- Construction: Composition roof; Construction materials: Unknown
- Exterior features: Covered porch with awning(s); Gate and chain link fencing; Community pool; Shed(s); Sprinkler irrigation
Interior
- Kitchen: Dishwasher; Gas oven; Gas cooktop; Cooktop; Microwave; Refrigerator
- Bedrooms: 2 possible bedrooms
- Bathrooms: 1 full bathroom
- Heating & cooling: Floor furnace (natural gas); Has heating
- Interior features: ENERGY STAR qualified appliances; Disposal; Gas water heater
- Laundry & utility: Washer; Dryer
Neighborhood map
What this means for you Summary
Snapshot
- This is a 1-bed/1.0-bath manufactured listed at $190k.
Deal economics
- At list price, monthly cash flow is $497 ($6k/yr) — positive.
- The deal already cash-flows at list — no discount required.
- Meets the 1% rule at list price ($2k rent vs $190k).
- Recommended offer: $173k (9.0% below list) — sets the bar for market timing.
- Cap rate 9.4% vs local median 2.0% in San Diego — top-decile yield for the area; either an underpriced asset or a hidden risk that comps aren't pricing in. Stress-test before assuming the spread holds.
Location & tenants
- Location reads 75/100 on livability (#123 in CA, #4,206 nationally) — a middle-class / working-renter tenant base. Strengths: amenities A+, commute A+, employment A+; Watch: health & safety C-, crime D+, cost of living F.
- San Diego Unified (urban): math 19% / reading 29% proficiency, ranked #393 of 517 in CA (top 76%) — low school quality limits family demand, transient renter base, plan for 1-2y turnover.
- Market conditions: Rents rising (+1.4%/yr); 126 active listings in the ZIP; 29 comparable units currently listed for rent nearby; rentals leasing fast (median 11d on market — plan ~1-2 weeks tenant-placement turnaround); solid renter incomes; 11,759 units permitted in San Diego County in 2024 (7,244 in 5+ unit buildings).
Forward outlook
- Local home prices are declining (-3.0%/yr); year-one equity from $1k of loan paydown is wiped out by about $6k of value loss. Plan a longer hold.
- San Diego County population projected at +20% by 2050 — long-run rental-demand tailwind backs the buy-and-hold thesis.
Negotiation context
- It's been on market 92 days — a 9% lower offer ($173k) is reasonable based on typical stale-listing flexibility.
Questions for the listing agent
- It's been on market 92 days. Have you received any prior offers? Is the seller open to a 9% concession, seller financing, or rate buy-down credit?
- Built in 1971 — when were the roof, HVAC, electrical panel, plumbing, and water heater last replaced?
- Why hasn't it sold? Are there any deal-killer items the seller is aware of (foundation, flood, title, zoning, code violations)?
- Is there a deadline driving the sale (1031 exchange, divorce, estate, relocation)? That informs how much negotiation room exists.
- Schools are B-rated — typically a magnet for longer-tenancy family renters. What's the average tenant stay here, and is there a school-zone premium baked into asking?
- Crime grade is D in this area — have there been break-ins, vandalism, or insurance claims at this property in the last 3 years? What carrier currently insures it and at what premium?
- What's the average days-on-market for RENTAL listings here right now (not sales)? A rising rental-DOM trend means longer vacancies and softer asking-rent achievability than the comps imply.
- What's the recent tenant-quality profile in this submarket — average credit score on applications, eviction rate, late-payment / NSF rate, and stable-employment percentage? A property-management company in the area should have these aggregated.
- How much new for-sale + rental construction is in the pipeline within 1–3 miles? Heavy new supply typically softens prices + rents 12–24 months out; constrained supply supports both.
Investment metrics
- 1% rule
- 1.21% ✓
- Cap rate
- 9.43%
- Cash-on-cash
- 11.21%
- DSCR
- 1.50
- GRM
- 6.9
CMA / ARV
- ARV (on-the-fly)
- $152,544
- Comps found
- 3
Show comp detail 3 sales within ~0.75 mi
| Address | Dist | Beds/Ba | Sqft | Sold | Price | $/sf | Match |
|---|---|---|---|---|---|---|---|
| 6460 Convoy Ct #59 | 0.00mi | 2/1.0 (+1) | 672 (0%) | 7mo | $189,000 | $281 | 89 |
| 6460 Convoy Ct #69 | 0.19mi | 2/1.0 (+1) | 672 (0%) | 17mo | $120,000 | $179 | 72 |
| 6460 Convoy Ct Spc 175 | 0.00mi | 2/1.0 (+1) | 728 (+8%) | 13mo | $165,000 | $227 | 70 |
Match score weights: distance 35% · size 25% · config 20% · recency 20%. Top-matched comps best support the ARV.
Projected returns pro-forma
-3.0% appreciation · 1.42% rent growth · sell at horizon
- IRR
- -1.4%
- Equity multiple
- 0.95×
- Total profit
- $-2,677
- Equity at exit
- $28,330
- IRR
- 6.6%
- Equity multiple
- 1.46×
- Total profit
- $24,324
- Equity at exit
- $16,428
Cash invested: $53,200 (down + closing). Projections, not guarantees.
Landlord ↔ Tenant lean methodology
- Overall (STATE)
- 18 Strongly Tenant-Friendly
- State California
- 18 Strongly Tenant-Friendly · D+13
- County
- — inherits STATE
- City
- — inherits STATE
ZIP-level market 92117
- Rents YoY
- 1.4%
- Active inventory
- 126
- Price-to-rent
- 6.9×
Monthly cashflow live
- Estimated rent
- $2,291 high interval (Pro) →
- Mortgage (P&I)
- −$996
- Tax est. 1.5%
- −$238 /mo · $2,850/yr
- Insurance
- −$79
- HOA
- −$0
- Vacancy / Maint / Mgmt
- −$481
- Net cashflow
- $497
Break-even live
UW: 25.0% down · 7.5% · 30yr · 1.5% tax · 5.0% vac · 8.0% maint · 8.0% mgmt
Financing live
Cash to close
- Down payment
- $47,500
- Closing costs
- $5,700
- Reserves months
- —
- Total cash needed
- —
Loan-product check · same deal, 3 products live
Conventional
25% down · 7.5% · 30yr
- Down + closing
- —
- Monthly P&I
- —
- Monthly cashflow
- —
- DSCR
- —
- Eligible?
- —
Personal DTI + credit; lowest rate.
DSCR
20% down · 8.5% · 30yr
- Down + closing
- —
- Monthly P&I
- —
- Monthly cashflow
- —
- DSCR
- —
- Eligible?
- —
No personal income docs; deal must DSCR.
Hard money
10% down · 12.0% · 12mo
- Down + closing
- —
- Monthly P&I
- —
- Monthly cashflow
- —
- DSCR
- —
- Eligible?
- —
Short-term bridge; refi at stabilization.
Rent comps 29 comps
| Address | Beds | Baths | Sqft | Rent | $/sqft | DOM | Units | Dist |
|---|---|---|---|---|---|---|---|---|
| 4890 Doliva Dr San Diego, CA | 1.0 | 1.0 | 500 | $2,100 | $4.20 | 24d | 1 | 0.45mi |
| 5265 Clairemont Mesa Blvd San Diego, CA | — | 1.0 | 380 | $1,738 | $4.57 | 1d | 5 | 0.50mi |
| 4822 Doliva Dr Unit 4826 201 San Diego, CA | 2.0 | 1.0 | 623 | $2,768 | $4.44 | 24d | 1 | 0.55mi |
| 5139 Clairemont Mesa Blvd San Diego, CA | — | 1.0 | 375 | $1,650 | $4.40 | 20d | 1 | 0.63mi |
| 5109 Clairemont Mesa Blvd San Diego, CA | — | 1.0 | 375 | $1,650 | $4.40 | 7d | 1 | 0.66mi |
| 5063 Clairemont Mesa Blvd San Diego, CA | — | 1.0 | 400 | $1,750 | $4.38 | 7d | 1 | 0.70mi |
| 4960 Clairemont Mesa Blvd Unit 207 San Diego, CA | 1.0 | 1.0 | 525 | $1,695 | $3.23 | 24d | 1 | 0.77mi |
| 4975 Clairemont Mesa Blvd San Diego, CA | 1.0–2.0 | 1.0–1.5 | 626 | $1,795 | $2.87 | 17d | 2 | 0.81mi |
| 4880 Clairemont Mesa Blvd San Diego, CA | 3.0 | 1.0–2.0 | 657 | $2,462 | $3.74 | 1d | 14 | 0.84mi |
| 4605 Almayo Ave Unit 7 San Diego, CA | 1.0 | 1.0 | 441 | $2,795 | $6.34 | 1d | 1 | 1.08mi |
| 4609 Almayo Ave Unit 13 San Diego, CA | 1.0 | 1.0 | 441 | $2,595 | $5.88 | 24d | 1 | 1.08mi |
| 4605 Almayo Ave Unit 7 San Diego, CA | 1.0 | 1.0 | 441 | $2,795 | $6.34 | 24d | 1 | 1.08mi |
| 4609 Almayo Ave Unit 13 San Diego, CA | 1.0 | 1.0 | 441 | $2,595 | $5.88 | 1d | 1 | 1.08mi |
| 4603 Almayo Ave Unit 1 San Diego, CA | 1.0 | 1.0 | 441 | $2,595 | $5.88 | 7d | 1 | 1.09mi |
| 4605 Almayo Ave Unit 6 San Diego, CA | 1.0 | 1.0 | 441 | $2,395 | $5.43 | 24d | 1 | 1.09mi |
| 4603 Almayo Ave Unit 2 San Diego, CA | 1.0 | 1.0 | 441 | $2,495 | $5.66 | 1d | 1 | 1.09mi |
| 4888 Convoy St San Diego, CA | 2.0 | 1.0–2.0 | 860 | $3,586 | $4.17 | 1d | 306 | 1.13mi |
| 4290 Mount Abernathy Ave San Diego, CA | 1.0 | 1.0 | 605 | $2,450 | $4.05 | 7d | 1 | 1.16mi |
| 5550 Balboa Arms Dr San Diego, CA | 1.0–2.0 | 1.0–2.0 | 807 | $2,395 | $2.97 | 3d | 7 | 1.16mi |
| 4678 Firestone St Apt 102 San Diego, CA | 1.0 | 1.0 | 441 | $2,395 | $5.43 | 24d | 1 | 1.17mi |
| 4678 Firestone St Unit 202 San Diego, CA | 1.0 | 1.0 | 441 | $2,531 | $5.74 | 24d | 1 | 1.17mi |
| 5252 Balboa Arms Dr San Diego, CA | 1.0–2.0 | 1.0–2.0 | 692 | $2,600 | $3.76 | 2d | 3 | 1.18mi |
| 5252 Balboa Arms Dr San Diego, CA | 1.0–2.0 | 1.0–2.0 | 692 | $2,650 | $3.83 | 10d | 3 | 1.18mi |
| 5150 Balboa Arms Dr San Diego, CA | 2.0 | 1.0–2.0 | 665 | $2,120 | $3.19 | 3d | 3 | 1.20mi |
| 6778 Beadnell Way San Diego, CA | 1.0 | 1.0 | 635 | $2,045 | $3.22 | 7d | 1 | 1.23mi |
| 5118 Constitution Rd Unit 5122 AIRBNB PROPERTY San Diego, CA | — | 1.0 | 426 | $2,250 | $5.28 | 21d | 1 | 1.31mi |
| 6333 Mount Ada Rd #168 San Diego, CA | 1.0 | 1.0 | 581 | $2,595 | $4.47 | 14d | 1 | 1.40mi |
| 4970 Genesee Ave Unit 4986 San Diego, CA | 1.0 | 1.0 | 500 | $2,295 | $4.59 | 24d | 1 | 1.45mi |
| 5251 Mount Etna Dr San Diego, CA | 1.0–3.0 | 1.0–2.0 | 735 | $1,776 | $2.42 | 24d | 1 | 1.47mi |
Listing history 14 events
-
2026-06-18pricedays on market $190,000 Active 92 DOM
-
2026-06-17days on market $195,000 Active 91 DOM
-
2026-06-16days on market $195,000 Active 90 DOM
-
2026-06-15days on market $195,000 Active 89 DOM
-
2026-06-13days on market $195,000 Active 87 DOM
-
2026-06-09days on market $195,000 Active 83 DOM
-
2026-06-08days on market $195,000 Active 82 DOM
-
2026-06-07days on market $195,000 Active 81 DOM
-
2026-06-04days on market $195,000 Active 78 DOM
-
2026-06-03days on market $195,000 Active 77 DOM
-
2026-06-02days on market $195,000 Active 76 DOM
-
2026-06-01days on market $195,000 Active 75 DOM
-
2026-05-31days on market $195,000 Active 74 DOM
-
2026-03-18$195,000 Active
ⓘ Source: listings_history table (triggers on properties + properties_extension) + one-shot
backfill from property_details.listing_events for pre-trigger history.
Climate risk First Street
- Flood 1/10 Low FEMA zone X (unshaded) · 0% chance over 30 yrs
- Wildfire 3/10 Moderate
- Heat 3/10 Moderate 6 d/yr ≥89°F today · 18 d/yr by 30 yrs out
- Wind 1/10 Low
- Air quality 3/10 Moderate 4 unhealthy d/yr today · 4 by 30 yrs out
Nearby sold comps map
Loading sold comps map…
Walkable amenities ~0.75 mi
Loading nearby amenities…
Taxation est. · year 1
- Rental income
- $27,496
- − Mortgage interest
- −$10,643
- − Property taxes
- −$2,850
- − Insurance
- −$950
- − Repairs & maintenance
- −$2,200
- − Management
- −$2,200
- − Depreciation
- −$5,527
- Taxable income
- $3,127
- Est. tax owed @ 24.0%
- −$750
- After-tax cash flow
- $5,215/yr
For passive investors: Depreciation is non-cash, so a rental often shows a tax loss while cash-flowing — sheltering income. Rental losses are passive: they offset passive income freely, and up to $25,000/yr can offset ordinary (W-2) income if you actively participate and your MAGI is under $100k (phasing out to $0 by $150k); unused losses carry forward. On sale, claimed depreciation is recaptured at up to 25%, and gains may owe capital-gains tax (a 1031 exchange can defer both). Figures are a year-1 estimate at your 24.0% rate — not tax advice; consult a CPA.
Schools (NCES district)
- District
- San Diego Unified
- NCES district ID
- 0634320
- Math proficiency
- 19% ▼ -29.00%
- Reading proficiency
- 29% ▼ -28.00%
- Median HH income
- $61,673
- Composite
- 22.31/100
- National rank
- #8135
- State rank
- #393 of 517 in CA
Livability — San Diego
- Score
- 75/100
- State rank
- #123
- US rank
- #4206
Category grades
Schools grade is shown separately in the Schools card above.
Census & demographics
- Census place
- San Diego, CA
- County
- San Diego County · 3,178,799 people
- City population
- 1,397,612
- Metro
- San Diego-Chula Vista-Carlsbad, CA
- Population (ZIP)
- 52,275
- Household income
- $103,661
- Rent vs Own
- Severe rent burden
- 2209.0
Population outlook (San Diego County) Hauer SSP2
- Today (2025)
- 3,678,185 people
- By 2030
- 3,856,546 · +4.8%
- By 2040
- 4,171,407 · +13.4%
- By 2050
- 4,421,607 · +20.2%
- By 2075
- 4,831,599 · +31.4%
- By 2100
- 4,832,502 · +31.4%
Race, ethnicity, and origin ACS 2023
- Neighborhood character
- Diverse neighborhood (Simpson 0.60)
- Race & ethnicity
- White 57% Hispanic / Latino 25% Two or more races 17% Asian 9% Black 2%
- Hispanic origin (detail)
- Mexican 20%
- Common ancestry
- Lithuanian 2% Italian 2% Slovak 2%
- Foreign-born
- 19% · Canada, Vietnam, Jamaica
- Languages at home
- 73% English-only · Spanish 17% Other Indo-European 3% Vietnamese 2%
Political lean MEDSL · San Diego
- 2024 margin
- D (+16.8) · D 56.9% · R 40.1% · Other 2.9%
- 2008→2024 swing
- +6.6pp toward D · 2008: 10.2pp · 2024: 16.8pp
- All cycles
- 2024: D+16.8 2020: D+22.8 2016: D+17.8 2012: D+5.1 2008: D+10.2
Not yet ingested
- Civics
- —
Market trends
- HPI YoY
- ▼ -1228.75%
- Current HPI
- 398.6104
- Rent YoY
- ▲ 1.42%
- Metro
- San Diego-Chula Vista-Carlsbad, CA
- State GDP YoY
- ▲ 3.21%
- F500 in state
- 116
Industry mix (Fortune 500 HQ in CA)
| Industry | F500 HQs | Revenue |
|---|---|---|
| Technology | 27 | $1,492B |
|
||
| Financial Services | 3 | $174B |
|
||
| Retail | 3 | $44B |
|
||
| Insurance | 3 | $26B |
|
||
| Media / Entertainment | 2 | $115B |
|
||
| Pharmaceuticals / Biotech | 2 | $62B |
|
||
Price history
1 event — show timeline
- 2026-03-18 Listed $195,000 SDMLS
Property tax history
-19.1%/yrLatest (2013): $73 · +9.8% YoY. Source: county tax records.
Cash-flow waterfall
monthlySold comps — $/sqft
last 12 mo · ≤1 miLoading sold comps…