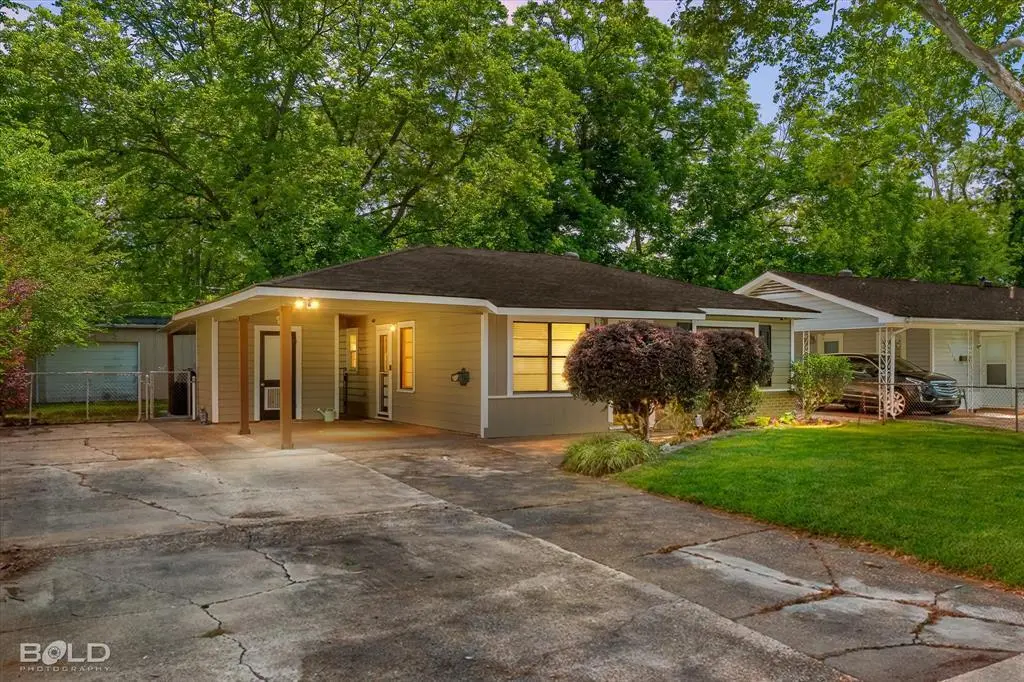
1522 Clarence St · Bossier City, LA
Flood risk 1/10 · Minimal
- FEMA flood zone
- X (unshaded)
- Chance of flooding over 30 yrs
- 0.0%
- Est. flood insurance / yr
- $507 – $1,088
Fire risk 1/10 · Minimal
- Est. fire insurance / yr
- $1,269 – $2,357
Heat risk 7/10 · Major
- Hot days now (above 110°F)
- 7 days/yr
- Hot days in 30 yrs
- 21 days/yr
Wind risk 6/10 · Moderate
- Chance of severe wind over 30 yrs
- 63.0%
Air-quality risk 2/10 · Minimal
- Unhealthy air days now
- 1 days/yr
- Unhealthy air days in 30 yrs
- 2 days/yr
Risk factors via First Street. Map © Google.
Why this score? — see what drove the D grade
The composite is a weighted blend of 9 inputs, each scored 0–100. Each bar is that input's sub-score; the figure is the points it added to the 100-point composite (weight × sub-score).
- Cash flow +17.3/30.0
- DSCR +5.4/10.0
- Rent growth +4.1/5.0
- 1% rule +3.8/10.0
- Schools +3.8/10.0
- Livability +3.6/5.0
- Condition / age +2.5/5.0
- ARV discount +0.0/15.0
- Appreciation +0.0/10.0
$149,900
🖨 Deal sheet 📄 Offer letter ✓ Due diligence
Listing remarks MLS
This 3 bedroom, one bath home has several updates! granite counter tops, tiled back splash, LVP flooring and fresh paint throughout. The back yard offers tons of storage along with a large metal shop with power. Book your showing today!
Key facts
- Granite countertops
- 7,754 sq ft lot
- Parking
Tags
Property features AI
Finance
- Other: Possession at closing/funding; Listing status: Active Contingent / Active Under Contract
- Financial info: Treat as clear loan type; No second mortgage
- HOA & community: No association
Exterior
- Parking: Attached carport; Carport (1 covered space); Driveway
- Utilities: City sewer; City water; Not in a municipal utility district
- Home design: Single-family residence; Attached property; One story; Built in 1955; Subdivision: Glendale 05
- Construction: Year built 1955
- Exterior features: Shed(s); Workshop with electric; Additional workshop (see remarks); Lot under 0.5 acre
Interior
- Kitchen: Dishwasher; Electric oven; Microwave; Refrigerator
- Bedrooms: Primary bedroom on main level; Total of 3 bedrooms
- Bathrooms: 1 full bathroom
- Interior features: Built-in features; Cable TV available; High-speed internet available; One living area; One dining area; Room count: 3
- Laundry & utility: No specific laundry details listed
Neighborhood map
What this means for you Summary
Snapshot
- This is a 3-bed/1.0-bath single-family listed at $150k.
Deal economics
- At list price, monthly cash flow is $110 ($1k/yr) — positive.
- The deal already cash-flows at list — no discount required.
- To meet the 1% rule (rent ≥ 1% of price), the offer needs to be $132k (12.1% below list).
- Recommended offer: $132k (12.1% below list) — sets the bar for 1% rule.
- Cap rate 7.2% vs local median 4.7% in Bossier City — top-decile yield for the area; either an underpriced asset or a hidden risk that comps aren't pricing in. Stress-test before assuming the spread holds.
Location & tenants
- Location reads 71/100 on livability (#47 in LA) — a middle-class / working-renter tenant base. Strengths: commute A+, cost of living A+, housing A+; Watch: employment D+, crime F, amenities F.
- Bossier Parish (urban): math 40% / reading 47% proficiency, ranked #17 of 98 in LA (top 17%) — families likely to look elsewhere, expect single-tenant / working-renter base with shorter leases.
- Zoned schools: Bossier Elementary School (math 8% / reading 17%, grade F, #550 of 646 statewide, top 88%, 222 students, 93% FRL) — zoned schools average 93% FRL vs 41% district-wide (52 pts higher); higher-poverty schools than district average — tighter screening recommended.
- Zoned-school proficiency averages 12% at this address vs 44% district-wide (-31 pts) — the specific schools serving this property underperform the Bossier Parish average; the district grade overstates school quality for this exact location.
- Market conditions: Rents rising fast (+6.6%/yr); 421 active listings in the ZIP; 20 comparable units currently listed for rent nearby; rentals at typical pace (median 21d on market — plan ~3-4 weeks tenant-placement turnaround); 716 units permitted in Bossier Parish in 2024 (0 in 5+ unit buildings).
Forward outlook
- Local home prices are declining (-3.0%/yr); year-one equity from $1k of loan paydown is wiped out by about $4k of value loss. Plan a longer hold.
- Bossier County population projected at +28% by 2050 — long-run rental-demand tailwind backs the buy-and-hold thesis.
Negotiation context
- Only 12 days on market — expect competitive offers; lowballing is unlikely to land.
- 3 sale attempts since 2y ago with the ask held roughly flat each time — persistent listings suggest the price (not the market) is what's stuck; bring a comps-based counter.
Risks & watch-outs
- Watch-outs: built in 1955 — expect roof / HVAC / electrical / plumbing capex.
- Climate carrying-cost: major wind risk, 63% chance of damaging wind over 30y; extreme-heat days projected 7→21/yr by 2055 (HVAC capex compounding) — expect insurance premiums to compound above CPI over the hold.
Questions for the listing agent
- Built in 1955 — when were the roof, HVAC, electrical panel, plumbing, and water heater last replaced?
- Is there a deadline driving the sale (1031 exchange, divorce, estate, relocation)? That informs how much negotiation room exists.
- Schools are B-rated — typically a magnet for longer-tenancy family renters. What's the average tenant stay here, and is there a school-zone premium baked into asking?
- Crime grade is F in this area — have there been break-ins, vandalism, or insurance claims at this property in the last 3 years? What carrier currently insures it and at what premium?
- The area grade is low — what's the realistic commute time and amenity access for the typical tenant pool here? Any planned neighborhood developments (good or bad) we should know about?
- What's the average days-on-market for RENTAL listings here right now (not sales)? A rising rental-DOM trend means longer vacancies and softer asking-rent achievability than the comps imply.
- What's the recent tenant-quality profile in this submarket — average credit score on applications, eviction rate, late-payment / NSF rate, and stable-employment percentage? A property-management company in the area should have these aggregated.
- How much new for-sale + rental construction is in the pipeline within 1–3 miles? Heavy new supply typically softens prices + rents 12–24 months out; constrained supply supports both.
Investment metrics
- 1% rule
- 0.88% ✗
- Cap rate
- 7.17%
- Cash-on-cash
- 3.14%
- DSCR
- 1.14
- GRM
- 9.5
CMA / ARV
- ARV (median comp)
- $113,779
- List price
- $149,900
- Delta
- 31.75%
- Verdict
- OVERPRICED
- Comps
- 20 within 1.0 mi
Show comp detail 12 sales within ~0.75 mi
| Address | Dist | Beds/Ba | Sqft | Sold | Price | $/sf | Match |
|---|---|---|---|---|---|---|---|
| 2600 Bardot Ln | 0.20mi | 3/1.0 | 1,125 (+2%) | 3mo | $124,900 | $111 | 85 |
| 2416 Broadway Dr | 0.35mi | 3/1.0 | 1,125 (+2%) | 3mo | $124,800 | $111 | 78 |
| 2420 Northside Dr | 0.39mi | 3/1.0 | 1,077 (-3%) | 1mo | $110,000 | $102 | 76 |
| 1536 James St | 0.13mi | 3/1.0 | 1,250 (+13%) | 3mo | $127,386 | $102 | 70 |
| 3007 Gaines St | 0.61mi | 3/1.0 | 1,142 (+3%) | 1mo | $131,229 | $115 | 66 |
| 1515 Debra St | 0.06mi | 4/2.0 (+1) | 1,269 (+15%) | 6mo | $149,999 | $118 | 59 |
| 2804 Hood Dr | 0.59mi | 3/1.0 | 1,027 (-7%) | 3mo | $107,000 | $104 | 58 |
| 2905 Rebel | 0.52mi | 4/2.0 (+1) | 1,180 (+7%) | 6mo | $145,000 | $123 | 51 |
| 2425 Douglas Dr | 0.65mi | 3/1.0 | 1,206 (+9%) | 6mo | $149,999 | $124 | 50 |
| 2112 Clovis St | 0.51mi | 2/1.0 (-1) | 995 (-10%) | 6mo | $124,000 | $125 | 49 |
| 3131 Malvern St | 0.72mi | 3/1.0 | 1,023 (-8%) | 6mo | $97,500 | $95 | 48 |
| 2406 Waverly Dr | 0.71mi | 3/1.5 | 1,258 (+14%) | 0mo | $169,900 | $135 | 42 |
Match score weights: distance 35% · size 25% · config 20% · recency 20%. Top-matched comps best support the ARV.
Projected returns pro-forma
-3.0% appreciation · 6.56% rent growth · sell at horizon
- IRR
- -7.8%
- Equity multiple
- 0.70×
- Total profit
- $-12,439
- Equity at exit
- $22,351
- IRR
- 5.5%
- Equity multiple
- 1.47×
- Total profit
- $19,604
- Equity at exit
- $12,961
Cash invested: $41,972 (down + closing). Projections, not guarantees.
Landlord ↔ Tenant lean methodology
- Overall (STATE)
- 90 Strongly Landlord-Friendly
- State Louisiana
- 90 Strongly Landlord-Friendly · R+12
- County
- — inherits STATE
- City
- — inherits STATE
ZIP-level market 71111
- Home prices YoY
- -34.8%
- Rents YoY
- 6.6%
- Active inventory
- 421
- Price-to-rent
- 9.5×
Monthly cashflow live
- Estimated rent
- $1,318 high interval (Pro) →
- Mortgage (P&I)
- −$786
- Tax from tax record
- −$83 /mo · $995/yr
- Insurance
- −$62
- HOA
- −$0
- Vacancy / Maint / Mgmt
- −$277
- Net cashflow
- $110
Break-even live
UW: 25.0% down · 7.5% · 30yr · 1.5% tax · 5.0% vac · 8.0% maint · 8.0% mgmt
Financing live
Cash to close
- Down payment
- $37,475
- Closing costs
- $4,497
- Reserves months
- —
- Total cash needed
- —
Loan-product check · same deal, 3 products live
Conventional
25% down · 7.5% · 30yr
- Down + closing
- —
- Monthly P&I
- —
- Monthly cashflow
- —
- DSCR
- —
- Eligible?
- —
Personal DTI + credit; lowest rate.
DSCR
20% down · 8.5% · 30yr
- Down + closing
- —
- Monthly P&I
- —
- Monthly cashflow
- —
- DSCR
- —
- Eligible?
- —
No personal income docs; deal must DSCR.
Hard money
10% down · 12.0% · 12mo
- Down + closing
- —
- Monthly P&I
- —
- Monthly cashflow
- —
- DSCR
- —
- Eligible?
- —
Short-term bridge; refi at stabilization.
Rent comps 20 comps
| Address | Beds | Baths | Sqft | Rent | $/sqft | DOM | Units | Dist |
|---|---|---|---|---|---|---|---|---|
| 1525 Debra St Bossier City, LA | 3.0 | 1.0 | 1033 | $975 | $0.94 | 21d | 1 | 0.03mi |
| 1518 Viosca St Bossier City, LA | 3.0 | 2.0 | 1434 | $1,200 | $0.84 | 21d | 1 | 0.07mi |
| 1005 Clarence St Bossier City, LA | 3.0 | 2.0 | 1203 | $1,300 | $1.08 | 43d | 1 | 0.28mi |
| 2400 Broadway Dr Bossier City, LA | 3.0 | 1.0 | 1295 | $1,450 | $1.12 | 13d | 1 | 0.40mi |
| 2804 Hood Dr Bossier City, LA | 3.0 | 1.0 | 1027 | $1,250 | $1.22 | 13d | 1 | 0.58mi |
| 3200 Cottonwood St Bossier City, LA | 4.0 | 2.0 | 1116 | $1,075 | $0.96 | 21d | 1 | 0.62mi |
| 3009 Gaines St Bossier City, LA | 3.0 | 1.0 | 1060 | $1,200 | $1.13 | 21d | 1 | 0.62mi |
| 1820 E Texas St Bossier City, LA | 2.0 | 1.0 | 750 | $850 | $1.13 | 43d | 1 | 0.90mi |
| 1735 Green St Bossier City, LA | 4.0 | 2.0 | 1488 | $1,775 | $1.19 | 43d | 1 | 1.04mi |
| 2579 Airline Dr Bossier City, LA | 1.0–2.0 | 1.0–1.5 | 847 | $1,213 | $1.43 | 13d | 6 | 1.05mi |
| 3325 E Texas St Bossier City, LA | 1.0–2.0 | 1.0–2.0 | 810 | $950 | $1.17 | 21d | 1 | 1.08mi |
| 2601 Airline Dr Bossier City, LA | 1.0–2.0 | 1.0–2.0 | 746 | $1,510 | $2.02 | 13d | 10 | 1.18mi |
| 205 Royal St Bossier City, LA | 2.0 | 1.5 | 1100 | $1,100 | $1.00 | 43d | 1 | 1.30mi |
| 100 Crossroads Blvd Bossier City, LA | 1.0–2.0 | 1.0–2.0 | 858 | $1,299 | $1.51 | 43d | 1 | 1.31mi |
| 4056 Beech St Bossier City, LA | 4.0 | 1.0 | 1391 | $1,400 | $1.01 | 21d | 1 | 1.32mi |
| 305 Orleans St Bossier City, LA | 2.0 | 1.5 | 1021 | $1,000 | $0.98 | 21d | 1 | 1.37mi |
| 413 Montgomery St Bossier City, LA | 3.0 | 1.0 | 1152 | $1,000 | $0.87 | 13d | 1 | 1.40mi |
| 400 John Wesley Blvd Bossier City, LA | 2.0 | 1.5 | 935 | $842 | $0.90 | 13d | 2 | 1.40mi |
| 2248 Loreco St Bossier City, LA | 3.0 | 2.0 | 1073 | $1,400 | $1.30 | 43d | 1 | 1.48mi |
| 1225 Delhi St Bossier City, LA | 3.0 | 1.0 | 1092 | $800 | $0.73 | 21d | 1 | 1.49mi |
Listing history 9 events
-
2026-05-16historical Active Contingent 1043-char remark
-
2026-05-14$149,900 Active 1043-char remark
-
2024-07-03soldstatus $131,500
-
2024-07-02soldstatus Closed 236-char remark
Show marketing remark (236 chars)
This 3 bedroom, one bath home has several updates! granite counter tops, tiled back splash, LVP flooring and fresh paint throughout. The back yard offers tons of storage along with a large metal shop with power. Book your showing today!
-
2024-06-04status Pending 236-char remark
Show marketing remark (236 chars)
This 3 bedroom, one bath home has several updates! granite counter tops, tiled back splash, LVP flooring and fresh paint throughout. The back yard offers tons of storage along with a large metal shop with power. Book your showing today!
-
2024-05-31status Active 236-char remark
Show marketing remark (236 chars)
This 3 bedroom, one bath home has several updates! granite counter tops, tiled back splash, LVP flooring and fresh paint throughout. The back yard offers tons of storage along with a large metal shop with power. Book your showing today!
-
2024-05-27status Pending 236-char remark
Show marketing remark (236 chars)
This 3 bedroom, one bath home has several updates! granite counter tops, tiled back splash, LVP flooring and fresh paint throughout. The back yard offers tons of storage along with a large metal shop with power. Book your showing today!
-
2024-05-24$129,999 Active 236-char remark
Show marketing remark (236 chars)
This 3 bedroom, one bath home has several updates! granite counter tops, tiled back splash, LVP flooring and fresh paint throughout. The back yard offers tons of storage along with a large metal shop with power. Book your showing today!
-
2018-04-17soldstatus $67,000
ⓘ Source: listings_history table (triggers on properties + properties_extension) + one-shot
backfill from property_details.listing_events for pre-trigger history.
Tax reassessment forecast LA · Resets to sale price
- Current annual tax
- $995 · $83/mo
- Projected year-2 tax
- $995 · $83/mo
- Expected delta
- $0/yr ($0/mo · 0.0%)
ⓘ Screening estimate from a state-policy table — verify with the county assessor before closing.
Climate risk First Street
- Flood 1/10 Low FEMA zone X (unshaded) · 0% chance over 30 yrs
- Wildfire 1/10 Low
- Heat 7/10 Severe 7 d/yr ≥110°F today · 21 d/yr by 30 yrs out
- Wind 6/10 Major 63% chance of damaging wind over 30 yrs
- Air quality 2/10 Low 1 unhealthy d/yr today · 2 by 30 yrs out
Nearby sold comps map
Loading sold comps map…
Walkable amenities ~0.75 mi
Loading nearby amenities…
Taxation est. · year 1
- Rental income
- $15,819
- − Mortgage interest
- −$8,397
- − Property taxes
- −$995
- − Insurance
- −$750
- − Repairs & maintenance
- −$1,266
- − Management
- −$1,266
- − Depreciation
- −$4,361
- Taxable loss
- −$1,214
- Est. tax savings @ 24.0%
- +$291
- After-tax cash flow
- $1,611/yr
For passive investors: Depreciation is non-cash, so a rental often shows a tax loss while cash-flowing — sheltering income. Rental losses are passive: they offset passive income freely, and up to $25,000/yr can offset ordinary (W-2) income if you actively participate and your MAGI is under $100k (phasing out to $0 by $150k); unused losses carry forward. On sale, claimed depreciation is recaptured at up to 25%, and gains may owe capital-gains tax (a 1031 exchange can defer both). Figures are a year-1 estimate at your 24.0% rate — not tax advice; consult a CPA.
Schools (NCES district)
- District
- Bossier Parish
- NCES district ID
- 2200270
- Math proficiency
- 40% ▼ -32.00%
- Reading proficiency
- 47% ▼ -28.00%
- Median HH income
- $51,326
- Composite
- 37.5/100
- National rank
- #4402
- State rank
- #17 of 98 in LA
Livability — Bossier City
- Score
- 71/100
- State rank
- #47
- US rank
- #7044
Category grades
Schools grade is shown separately in the Schools card above.
Census & demographics
- Census place
- Bossier City, LA
- County
- Bossier Parish · 98,704 people
- City population
- 91,925
- Metro
- Shreveport-Bossier City, LA
- Population (ZIP)
- 43,925
- Household income
- $65,292
- Rent vs Own
- Severe rent burden
- 1942.0
Population outlook (Bossier County) Hauer SSP2
- Today (2025)
- 143,247 people
- By 2030
- 151,802 · +6.0%
- By 2040
- 168,194 · +17.4%
- By 2050
- 183,533 · +28.1%
- By 2075
- 217,009 · +51.5%
- By 2100
- 230,091 · +60.6%
Race, ethnicity, and origin ACS 2023
- Neighborhood character
- Diverse neighborhood (Simpson 0.60)
- Race & ethnicity
- White 56% Black 29% Hispanic / Latino 9% Two or more races 8% Asian 3%
- Hispanic origin (detail)
- Mexican 5%
- Common ancestry
- Lithuanian 2% Iranian 1% Slovak 1%
- Foreign-born
- 5% · Canada, Vietnam
- Languages at home
- 90% English-only · Spanish 7% Vietnamese 1% French/Haitian/Cajun 1%
Political lean MEDSL · Bossier
- 2024 margin
- Solid R (+43.3) · D 27.7% · R 71.0% · Other 1.3%
- 2008→2024 swing
- +0.3pp no change · 2008: -43.7pp · 2024: -43.3pp
- All cycles
- 2024: R+43.3 2020: R+41.0 2016: R+45.8 2012: R+45.4 2008: R+43.7
Not yet ingested
- Civics
- —
Market trends
- HPI YoY
- ▼ -79.78%
- Current HPI
- 149.4336
- Rent YoY
- ▲ 6.56%
- Metro
- Shreveport-Bossier City, LA
- State GDP YoY
- ▲ 3.29%
- F500 in state
- 10
Industry mix (Fortune 500 HQ in LA)
| Industry | F500 HQs | Revenue |
|---|---|---|
| Telecommunications | 2 | $23B |
|
||
| Utilities | 1 | $12B |
|
||
| Wholesale / Distribution | 1 | $5B |
|
||
| Advertising | 1 | $2B |
|
||
Price history
+123.7% since first listed10 events — show timeline
- 2026-05-26 Pending — NTREIS
- 2026-05-16 Contingent — NTREIS
- 2026-05-14 Listed $149,900 NTREIS
- 2024-07-03 Sold (Public Records) $131,500 Public Records
- 2024-07-02 Sold (MLS) — NTREIS
- 2024-06-04 Pending — NTREIS
- 2024-05-31 Relisted — NTREIS
- 2024-05-27 Pending — NTREIS
- 2024-05-24 Listed $129,999 NTREIS
- 2018-04-17 Sold (Public Records) $67,000 Public Records
Property tax history
+33.1%/yrLatest (2025): $995 · -1.3% YoY. Source: county tax records.
Cash-flow waterfall
monthlySold comps — $/sqft
last 12 mo · ≤1 miLoading sold comps…