700 Warren Hill Rd · Palmyra, ME
Flood risk No data
- FEMA flood zone
- —
- Chance of flooding over 30 yrs
- —
- Est. flood insurance / yr
- —
Fire risk No data
- Est. fire insurance / yr
- —
Heat risk No data
- Hot days now (above threshold)
- —
- Hot days in 30 yrs
- —
Wind risk No data
- Chance of severe wind over 30 yrs
- —
Air-quality risk No data
- Unhealthy air days now
- —
- Unhealthy air days in 30 yrs
- —
Risk factors via First Street. Map © Google.
Why this score? — see what drove the B+ grade
The composite is a weighted blend of 9 inputs, each scored 0–100. Each bar is that input's sub-score; the figure is the points it added to the 100-point composite (weight × sub-score).
- Cash flow +30.0/30.0
- 1% rule +10.0/10.0
- DSCR +10.0/10.0
- Appreciation +8.1/10.0
- ARV discount +7.5/15.0
- Schools +6.4/10.0
- Rent growth +2.5/5.0
- Livability +2.5/5.0
- Condition / age +2.5/5.0
$67,000
🖨 Deal sheet 📄 Offer letter ✓ Due diligence
Listing remarks MLS
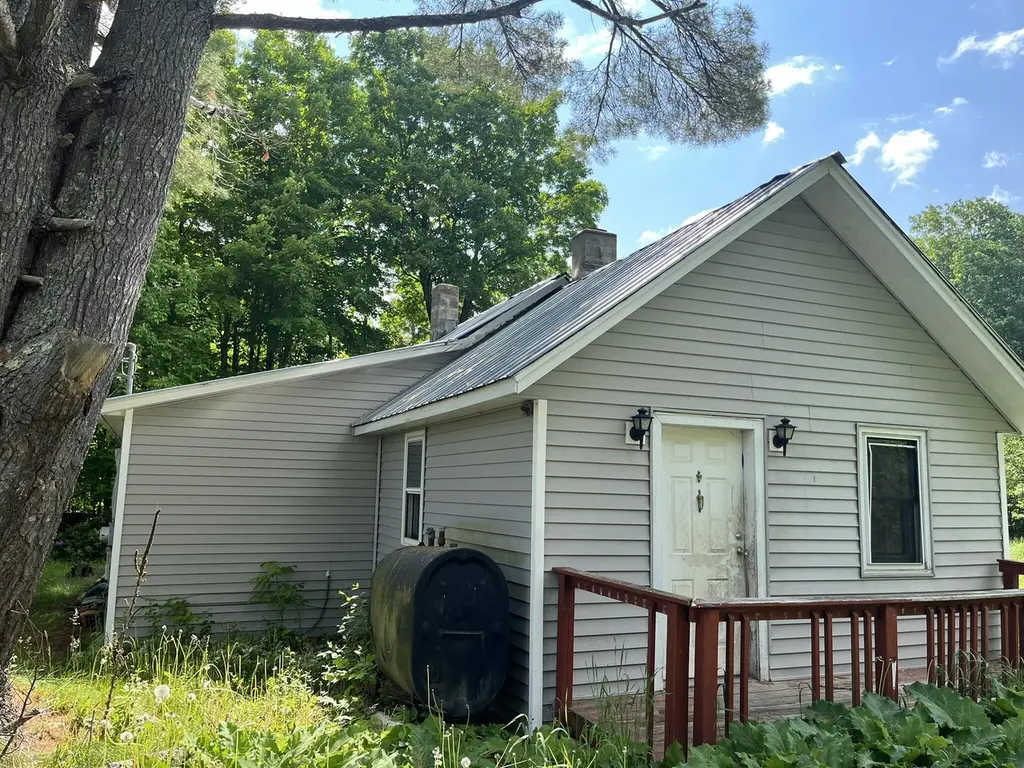
Diamond in the rough property with endless potential! Property is not currently habitable. Due to the condition of the property, a renovation mortgage or CASH will be needed to purchase. Value is primarily in the land This is a limited service listing.
Key facts
- 1 acre lot
- Garage
- Built 1900
Neighborhood map
What this means for you Summary
Snapshot
- This is a 2-bed/1.0-bath other listed at $67k.
Deal economics
- At list price, monthly cash flow is $517 ($6k/yr) — positive.
- The deal already cash-flows at list — no discount required.
- Meets the 1% rule at list price ($1k rent vs $67k).
- Recommended offer: $59k (12.0% below list) — sets the bar for market timing.
Location & tenants
- Location reads: area grade B — affects rentability + tenant quality, not the cash-flow math above.
- RSU 19 (rural): math 73% / reading 81% proficiency, ranked #96 of 112 in ME (top 86%) — strong family-tenant draw, lease renewals of 3-5y typical.
- Market conditions: 16 active listings in the ZIP; 129 units permitted in Somerset County in 2024 (0 in 5+ unit buildings).
Forward outlook
- In year one you build about $5k of equity ($463 loan paydown + $4k appreciation (6.1% local appreciation)).
- Somerset County population projected at -25% by 2050 — secular population decline; favor cash flow + early exit over multi-decade hold.
- At projected returns (6.1% appreciation + 3.0% rent growth), your $19k cash investment doubles in ~2 years — after that, you're playing with house money.
- By year 7, paydown + projected appreciation supports a ~$30k cash-out refi (75% LTV) — recoverable capital for the next deal without selling this one.
Negotiation context
- It's been on market 385 days — a 12% lower offer ($59k) is reasonable based on typical stale-listing flexibility.
Risks & watch-outs
- Watch-outs: built in 1900 — expect roof / HVAC / electrical / plumbing capex.
Questions for the listing agent
- It's been on market 385 days. Have you received any prior offers? Is the seller open to a 12% concession, seller financing, or rate buy-down credit?
- Built in 1900 — when were the roof, HVAC, electrical panel, plumbing, and water heater last replaced?
- Why hasn't it sold? Are there any deal-killer items the seller is aware of (foundation, flood, title, zoning, code violations)?
- Is there a deadline driving the sale (1031 exchange, divorce, estate, relocation)? That informs how much negotiation room exists.
- What's the average days-on-market for RENTAL listings here right now (not sales)? A rising rental-DOM trend means longer vacancies and softer asking-rent achievability than the comps imply.
- What's the recent tenant-quality profile in this submarket — average credit score on applications, eviction rate, late-payment / NSF rate, and stable-employment percentage? A property-management company in the area should have these aggregated.
- How much new for-sale + rental construction is in the pipeline within 1–3 miles? Heavy new supply typically softens prices + rents 12–24 months out; constrained supply supports both.
Investment metrics
- 1% rule
- 1.88% ✓
- Cap rate
- 15.55%
- Cash-on-cash
- 33.04%
- DSCR
- 2.47
- GRM
- 4.4
CMA / ARV
- ARV (median comp)
- $200,389
- List price
- $67,000
- Delta
- -66.57%
- Verdict
- UNDERPRICED
- Comps
- 4 within 1.0 mi
Projected returns pro-forma
6.14% appreciation · 3.0% rent growth · sell at horizon
- IRR
- 43.8%
- Equity multiple
- 3.82×
- Total profit
- $52,846
- Equity at exit
- $42,724
- IRR
- 40.7%
- Equity multiple
- 7.91×
- Total profit
- $129,591
- Equity at exit
- $78,007
Cash invested: $18,760 (down + closing). Projections, not guarantees.
Landlord ↔ Tenant lean methodology
- Overall (STATE)
- 41 Moderately Tenant-Leaning
- State Maine
- 41 Moderately Tenant-Leaning · D+2
- County
- — inherits STATE
- City
- — inherits STATE
ZIP-level market 04965
- Home prices YoY
- 2.7%
- Active inventory
- 16
- Price-to-rent
- 4.4×
Monthly cashflow live
- Estimated rent
- $1,262 medium interval (Pro) →
- Mortgage (P&I)
- −$351
- Tax from tax record
- −$101 /mo · $1,211/yr
- Insurance
- −$28
- HOA
- −$0
- Vacancy / Maint / Mgmt
- −$265
- Net cashflow
- $517
Break-even live
UW: 25.0% down · 7.5% · 30yr · 1.5% tax · 5.0% vac · 8.0% maint · 8.0% mgmt
Financing live
Cash to close
- Down payment
- $16,750
- Closing costs
- $2,010
- Reserves months
- —
- Total cash needed
- —
Loan-product check · same deal, 3 products live
Conventional
25% down · 7.5% · 30yr
- Down + closing
- —
- Monthly P&I
- —
- Monthly cashflow
- —
- DSCR
- —
- Eligible?
- —
Personal DTI + credit; lowest rate.
DSCR
20% down · 8.5% · 30yr
- Down + closing
- —
- Monthly P&I
- —
- Monthly cashflow
- —
- DSCR
- —
- Eligible?
- —
No personal income docs; deal must DSCR.
Hard money
10% down · 12.0% · 12mo
- Down + closing
- —
- Monthly P&I
- —
- Monthly cashflow
- —
- DSCR
- —
- Eligible?
- —
Short-term bridge; refi at stabilization.
Listing history 32 events
-
2026-06-18days on market $67,000 Active 385 DOM
-
2026-06-17days on market $67,000 Active 384 DOM
-
2026-06-16days on market $67,000 Active 383 DOM
-
2026-06-15days on market $67,000 Active 382 DOM
-
2026-06-14days on market $67,000 Active 380 DOM
-
2026-06-13days on market $67,000 Active 379 DOM
-
2026-06-10days on market $67,000 Active 377 DOM
-
2026-06-09days on market $67,000 Active 376 DOM
-
2026-06-08days on market $67,000 Active 375 DOM
-
2026-06-07days on market $67,000 Active 374 DOM
-
2026-06-05days on market $67,000 Active 371 DOM
-
2026-06-03days on market $67,000 Active 370 DOM
-
2026-06-02days on market $67,000 Active 369 DOM
-
2026-06-01days on market $67,000 Active 368 DOM
-
2026-05-31days on market $67,000 Active 367 DOM
-
2026-05-30days on market $67,000 Active 366 DOM
-
2026-04-21price $67,000 255-char remark
Show marketing remark (255 chars)
Diamond in the rough property with endless potential! Property is not currently habitable. Due to the condition of the property, a renovation mortgage or CASH will be needed to purchase. Value is primarily in the land This is a limited service listing.
-
2025-05-29$73,150 Active 255-char remark
Show marketing remark (255 chars)
Diamond in the rough property with endless potential! Property is not currently habitable. Due to the condition of the property, a renovation mortgage or CASH will be needed to purchase. Value is primarily in the land This is a limited service listing.
-
2025-04-05price $71,700
-
2025-03-25price $71,900
-
2025-03-23price $72,200
-
2025-03-19price $72,400
-
2025-03-13price $72,800
-
2025-03-06price $73,200
-
2025-02-27price $73,400
-
2025-02-17price $73,600
-
2025-02-16price $73,700
-
2025-02-14price $73,800
-
2025-02-12price $73,900
-
2025-02-03price $74,000
-
2025-01-24price $78,800
-
2024-12-28price $79,000
ⓘ Source: listings_history table (triggers on properties + properties_extension) + one-shot
backfill from property_details.listing_events for pre-trigger history.
Tax reassessment forecast ME · Partial reset (capped growth)
- Current annual tax
- $1,211 · $101/mo
- Projected year-2 tax
- $1,211 · $101/mo
- Expected delta
- $0/yr ($0/mo · 0.0%)
ⓘ Screening estimate from a state-policy table — verify with the county assessor before closing.
Nearby sold comps map
Loading sold comps map…
Walkable amenities ~0.75 mi
Loading nearby amenities…
Taxation est. · year 1
- Rental income
- $15,141
- − Mortgage interest
- −$3,753
- − Property taxes
- −$1,211
- − Insurance
- −$335
- − Repairs & maintenance
- −$1,211
- − Management
- −$1,211
- − Depreciation
- −$1,949
- Taxable income
- $5,470
- Est. tax owed @ 24.0%
- −$1,313
- After-tax cash flow
- $4,886/yr
For passive investors: Depreciation is non-cash, so a rental often shows a tax loss while cash-flowing — sheltering income. Rental losses are passive: they offset passive income freely, and up to $25,000/yr can offset ordinary (W-2) income if you actively participate and your MAGI is under $100k (phasing out to $0 by $150k); unused losses carry forward. On sale, claimed depreciation is recaptured at up to 25%, and gains may owe capital-gains tax (a 1031 exchange can defer both). Figures are a year-1 estimate at your 24.0% rate — not tax advice; consult a CPA.
Schools (NCES district)
- District
- RSU 19
- NCES district ID
- 2314785
- Math proficiency
- 73% ▲ 53.00%
- Reading proficiency
- 81% ▲ 39.00%
- Median HH income
- $41,866
- Composite
- 64.37/100
- National rank
- #548
- State rank
- #96 of 112 in ME
Livability — Palmyra
No livability data for this city. (Only ~50 U.S. cities are tracked.)
Census & demographics
- Population (ZIP)
- 2,150
Population outlook (Somerset County) Hauer SSP2
- Today (2025)
- 48,335 people
- By 2030
- 46,268 · -4.3%
- By 2040
- 41,276 · -14.6%
- By 2050
- 36,137 · -25.2%
- By 2075
- 26,408 · -45.4%
- By 2100
- 18,836 · -61.0%
Race, ethnicity, and origin ACS 2023
- Neighborhood character
- Predominantly White (99%)
- Race & ethnicity
- White 99%
- Common ancestry
- Lithuanian 9% Romanian 2% Portuguese 1%
- Foreign-born
- 2%
Political lean MEDSL · Somerset
- 2024 margin
- Strong R (+27.1) · D 35.6% · R 62.7% · Other 1.7%
- 2008→2024 swing
- -32.8pp toward R · 2008: 5.7pp · 2024: -27.1pp
- All cycles
- 2024: R+27.1 2020: R+23.4 2016: R+22.8 2012: D+1.7 2008: D+5.7
Not yet ingested
- Civics
- —
Market trends
- HPI YoY
- ▲ 6.14%
- Current HPI
- 230.6987
- Rent YoY
- —
- Metro
- —
- State GDP YoY
- —
- F500 in state
- 0
Price history
-15.2% since first listed16 events — show timeline
- 2026-04-21 Price Changed $67,000 MREIS
- 2025-05-29 Listed $73,150 MREIS
- 2025-04-05 Price Changed $71,700 MREIS
- 2025-03-25 Price Changed $71,900 MREIS
- 2025-03-23 Price Changed $72,200 MREIS
- 2025-03-19 Price Changed $72,400 MREIS
- 2025-03-13 Price Changed $72,800 MREIS
- 2025-03-06 Price Changed $73,200 MREIS
- 2025-02-27 Price Changed $73,400 MREIS
- 2025-02-17 Price Changed $73,600 MREIS
- 2025-02-16 Price Changed $73,700 MREIS
- 2025-02-14 Price Changed $73,800 MREIS
- 2025-02-12 Price Changed $73,900 MREIS
- 2025-02-03 Price Changed $74,000 MREIS
- 2025-01-24 Price Changed $78,800 MREIS
- 2024-12-28 Price Changed $79,000 MREIS
Property tax history
+2.8%/yrLatest (2025): $1,211 · +8.0% YoY. Source: county tax records.
Cash-flow waterfall
monthlySold comps — $/sqft
last 12 mo · ≤1 miLoading sold comps…