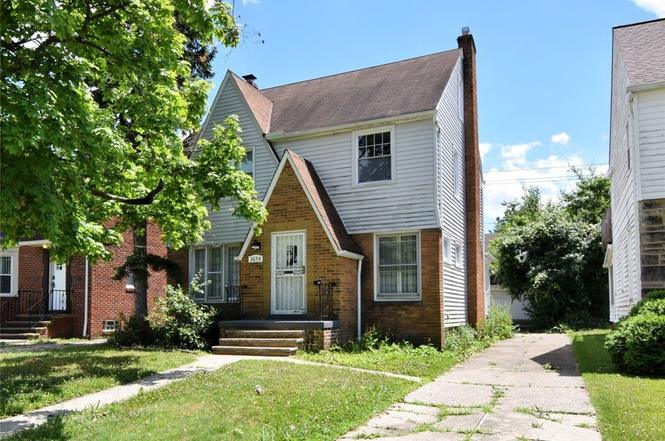
3654 Bainbridge · Cleveland Heights, OH
Flood risk 1/10 · Minimal
- FEMA flood zone
- X (unshaded)
- Chance of flooding over 30 yrs
- 0.0%
- Est. flood insurance / yr
- $473 – $860
Fire risk 1/10 · Minimal
- Est. fire insurance / yr
- $713 – $1,323
Heat risk 2/10 · Minimal
- Hot days now (above 96°F)
- 7 days/yr
- Hot days in 30 yrs
- 17 days/yr
Wind risk 1/10 · Minimal
- Chance of severe wind over 30 yrs
- —
Air-quality risk 3/10 · Minor
- Unhealthy air days now
- 2 days/yr
- Unhealthy air days in 30 yrs
- 5 days/yr
Risk factors via First Street. Map © Google.
Why this score? — see what drove the C- grade
The composite is a weighted blend of 9 inputs, each scored 0–100. Each bar is that input's sub-score; the figure is the points it added to the 100-point composite (weight × sub-score).
- ARV discount +15.0/15.0
- Cash flow +13.4/30.0
- 1% rule +5.3/10.0
- Livability +4.5/5.0
- DSCR +4.0/10.0
- Rent growth +3.9/5.0
- Schools +2.8/10.0
- Condition / age +2.5/5.0
- Appreciation +0.0/10.0
$169,900
🖨 Deal sheet 📄 Offer letter ✓ Due diligence
Listing remarks
Welcome to this classic Cleveland Heights Colonial offering timeless charm and flexible living space across four levels. The first floor features a spacious living room filled with natural light, a formal dining room perfect for entertaining, an eat-in kitchen with ample space for casual dining, and a bright sunroom that makes an ideal relaxation space. The second floor includes three comfortable bedrooms and a full bathroom, while the finished third floor provides a fourth bedroom, bonus room, playroom, office, or guest space to suit your needs. Conveniently located near parks, shopping, restaurants, and all that Cleveland Heights has to offer, this home presents a wonderful opportunity to
Key facts
- Finished third floor
- Formal dining room
- Eat-in kitchen
Tags
Neighborhood map
What this means for you Summary
Snapshot
- This is a 3-bed/1.5-bath single-family listed at $170k.
Deal economics
- At list price, monthly cash flow is $4 ($44/yr) — positive.
- The deal already cash-flows at list — no discount required.
- Meets the 1% rule at list price ($2k rent vs $170k).
- Cap rate 6.3% vs local median 4.4% in Cleveland Heights — top-decile yield for the area; either an underpriced asset or a hidden risk that comps aren't pricing in. Stress-test before assuming the spread holds.
Location & tenants
- Location reads 89/100 on livability (#12 in OH, #124 nationally) — a professional / high-income tenant draw. Strengths: amenities A+, commute A+, cost of living A+.
- Cleveland Heights-University Heights City (suburban): math 23% / reading 41% proficiency, ranked #568 of 656 in OH (top 87%) — families likely to look elsewhere, expect single-tenant / working-renter base with shorter leases; 64% free/reduced lunch — lower-income household profile, screen leases tightly.
- Market conditions: Rents rising fast (+5.7%/yr); 253 active listings in the ZIP; 40 comparable units currently listed for rent nearby; rentals at typical pace (median 15d on market — plan ~3-4 weeks tenant-placement turnaround); solid renter incomes; 1,441 units permitted in Cuyahoga County in 2024 (700 in 5+ unit buildings).
Forward outlook
- Local home prices are declining (-3.0%/yr); year-one equity from $1k of loan paydown is wiped out by about $5k of value loss. Plan a longer hold.
- Cuyahoga County population projected to shrink 8% by 2050 — rents likely to lag national; underwrite the cash flow, not the appreciation.
Negotiation context
- Only 2 days on market — expect competitive offers; lowballing is unlikely to land.
- 7 sale attempts since 36y ago with the ask held roughly flat each time — persistent listings suggest the price (not the market) is what's stuck; bring a comps-based counter.
Risks & watch-outs
- Watch-outs: property tax is 2.9% of price; built in 1927 — expect roof / HVAC / electrical / plumbing capex.
Questions for the listing agent
- Built in 1927 — when were the roof, HVAC, electrical panel, plumbing, and water heater last replaced?
- Property tax is high relative to price — has the assessment been appealed recently, and will the sale trigger a re-assessment?
- Is there a deadline driving the sale (1031 exchange, divorce, estate, relocation)? That informs how much negotiation room exists.
- Schools are A-rated — typically a magnet for longer-tenancy family renters. What's the average tenant stay here, and is there a school-zone premium baked into asking?
- What's the average days-on-market for RENTAL listings here right now (not sales)? A rising rental-DOM trend means longer vacancies and softer asking-rent achievability than the comps imply.
- What's the recent tenant-quality profile in this submarket — average credit score on applications, eviction rate, late-payment / NSF rate, and stable-employment percentage? A property-management company in the area should have these aggregated.
- How much new for-sale + rental construction is in the pipeline within 1–3 miles? Heavy new supply typically softens prices + rents 12–24 months out; constrained supply supports both.
Investment metrics
- 1% rule
- 1.03% ✓
- Cap rate
- 6.32%
- Cash-on-cash
- 0.09%
- DSCR
- 1.00
- GRM
- 8.1
CMA / ARV
- ARV (on-the-fly)
- $211,599
- Comps found
- 12
Show comp detail 12 sales within ~0.75 mi
| Address | Dist | Beds/Ba | Sqft | Sold | Price | $/sf | Match |
|---|---|---|---|---|---|---|---|
| 3699 Bainbridge Rd | 0.09mi | 3/1.5 | 1,363 (-1%) | 2mo | $208,000 | $153 | 92 |
| 3742 E Antisdale Rd | 0.27mi | 3/1.5 | 1,344 (-3%) | 2mo | $157,000 | $117 | 81 |
| 1948 Staunton Rd | 0.17mi | 3/1.0 | 1,268 (-8%) | 0mo | $180,000 | $142 | 76 |
| 3798 Grosvenor Rd | 0.38mi | 3/2.0 | 1,340 (-3%) | 2mo | $275,000 | $205 | 74 |
| 3750 Bainbridge Rd | 0.18mi | 3/2.0 | 1,508 (+9%) | 1mo | $259,900 | $172 | 73 |
| 2203 Brockway Rd | 0.64mi | 3/2.5 | 1,388 (+0%) | 2mo | $277,500 | $200 | 64 |
| 3733 E Antisdale Rd | 0.24mi | 3/1.5 | 1,582 (+14%) | 1mo | $155,000 | $98 | 64 |
| 3412 Euclid Heights Blvd | 0.55mi | 3/1.5 | 1,460 (+6%) | 2mo | $230,000 | $158 | 63 |
| 4037 Wilmington Rd | 0.73mi | 3/1.0 | 1,351 (-2%) | 2mo | $127,000 | $94 | 59 |
| 4041 Wilmington Rd | 0.74mi | 3/1.0 | 1,350 (-2%) | 2mo | $170,000 | $126 | 58 |
| 3322 Altamont Ave | 0.66mi | 3/2.0 | 1,322 (-4%) | 2mo | $183,000 | $138 | 58 |
| 3814 Bushnell Rd | 0.74mi | 4/1.5 (+1) | 1,531 (+11%) | 2mo | $285,000 | $186 | 41 |
Match score weights: distance 35% · size 25% · config 20% · recency 20%. Top-matched comps best support the ARV.
Projected returns pro-forma
-3.0% appreciation · 5.7% rent growth · sell at horizon
- IRR
- -12.6%
- Equity multiple
- 0.53×
- Total profit
- $-22,287
- Equity at exit
- $25,333
- IRR
- 0.7%
- Equity multiple
- 1.05×
- Total profit
- $2,589
- Equity at exit
- $14,690
Cash invested: $47,572 (down + closing). Projections, not guarantees.
Landlord ↔ Tenant lean methodology
- Overall (STATE)
- 73 Landlord-Friendly
- State Ohio
- 73 Landlord-Friendly · R+6
- County
- — inherits STATE
- City
- — inherits STATE
ZIP-level market 44118
- Rents YoY
- 5.7%
- Active inventory
- 253
- Price-to-rent
- 8.1×
Monthly cashflow live
- Estimated rent
- $1,743 high interval (Pro) →
- Mortgage (P&I)
- −$891
- Tax from tax record
- −$412 /mo · $4,940/yr
- Insurance
- −$71
- HOA
- −$0
- Vacancy / Maint / Mgmt
- −$366
- Net cashflow
- $4
Break-even live
UW: 25.0% down · 7.5% · 30yr · 1.5% tax · 5.0% vac · 8.0% maint · 8.0% mgmt
Financing live
Cash to close
- Down payment
- $42,475
- Closing costs
- $5,097
- Reserves months
- —
- Total cash needed
- —
Loan-product check · same deal, 3 products live
Conventional
25% down · 7.5% · 30yr
- Down + closing
- —
- Monthly P&I
- —
- Monthly cashflow
- —
- DSCR
- —
- Eligible?
- —
Personal DTI + credit; lowest rate.
DSCR
20% down · 8.5% · 30yr
- Down + closing
- —
- Monthly P&I
- —
- Monthly cashflow
- —
- DSCR
- —
- Eligible?
- —
No personal income docs; deal must DSCR.
Hard money
10% down · 12.0% · 12mo
- Down + closing
- —
- Monthly P&I
- —
- Monthly cashflow
- —
- DSCR
- —
- Eligible?
- —
Short-term bridge; refi at stabilization.
Rent comps 40 comps
| Address | Beds | Baths | Sqft | Rent | $/sqft | DOM | Units | Dist |
|---|---|---|---|---|---|---|---|---|
| 3699 Bainbridge Rd Cleveland, OH | 3.0 | 1.5 | 1866 | $1,900 | $1.02 | 16d | 1 | 0.10mi |
| 3722 Bainbridge Rd Cleveland, OH | 3.0 | 1.5 | 1326 | $4,500 | $3.39 | 24d | 1 | 0.14mi |
| 3830 Berkeley Rd Cleveland, OH | 3.0 | 1.5 | 1318 | $1,800 | $1.37 | 24d | 1 | 0.36mi |
| 3428 Superior Park Dr Cleveland Heights, OH | 3.0 | 2.0 | 1704 | $1,325 | $0.78 | 21d | 1 | 0.44mi |
| 3855 Grosvenor Rd Unit 1496039P South Euclid, OH | 2.0 | 1.0 | 1388 | $3,823 | $2.75 | 3d | 1 | 0.46mi |
| 3407 Altamont Rd Unit 2nd Floor Cleveland, OH | 3.0 | 1.0 | 1212 | $1,095 | $0.90 | 24d | 1 | 0.50mi |
| 13641 Cedar Rd University Heights, OH | 2.0 | 1.0 | 1036 | $1,350 | $1.30 | 24d | 1 | 0.51mi |
| 13645 Cedar Rd University Heights, OH | 2.0 | 1.0 | 1102 | $1,295 | $1.18 | 24d | 1 | 0.51mi |
| 13645 Cedar Rd University Heights, OH | 2.0 | 1.0 | 1102 | $1,395 | $1.27 | 4d | 1 | 0.51mi |
| 3411 Beechwood Ave Unit 2nd floor Cleveland Heights, OH | 3.0 | 1.0 | 1452 | $1,687 | $1.16 | 4d | 1 | 0.52mi |
| 13630 Cedar Rd University Heights, OH | 2.0 | 2.5 | 1288 | $1,450 | $1.13 | 3d | 1 | 0.55mi |
| 1584 Maple Rd Cleveland, OH | 3.0 | 2.0 | 1359 | $1,700 | $1.25 | 24d | 1 | 0.58mi |
| 13789 Cedar Rd Unit 300 South Euclid, OH | 2.0 | 1.0 | 1100 | $1,349 | $1.23 | 17d | 1 | 0.58mi |
| 3342 Desota Ave Unit 2 Cleveland Heights, OH | 3.0 | 1.0 | 1316 | $1,299 | $0.99 | 8d | 1 | 0.59mi |
| 30 Severance Cir Cleveland Heights, OH | 1.0–2.0 | 1.0–2.0 | 762 | $1,700 | $2.23 | 2d | 18 | 0.60mi |
| 3911 Warrendale Rd Cleveland, OH | 4.0 | 2.0 | 1381 | $1,830 | $1.33 | 2d | 1 | 0.61mi |
| 3895 Colony Rd Cleveland, OH | 3.0 | 2.0 | 1800 | $1,700 | $0.94 | 16d | 1 | 0.62mi |
| 3290 Desota Ave Cleveland, OH | 4.0 | 1.0 | 1094 | $1,325 | $1.21 | 24d | 1 | 0.68mi |
| 3829 Washington Blvd University Heights, OH | 3.0 | 1.0 | 1577 | $2,250 | $1.43 | 16d | 1 | 0.69mi |
| 3412 Kildare Rd Cleveland Heights, OH | 3.0 | 1.0 | 1296 | $1,731 | $1.34 | 3d | 1 | 0.75mi |
| 35 Severance Cir Cleveland Heights, OH | 1.0–2.0 | 1.0–2.0 | 832 | $1,570 | $1.89 | 2d | 26 | 0.75mi |
| 3621 Silsby Rd Unit 1496056P University Heights, OH | 4.0 | 2.5 | 1603 | $7,927 | $4.95 | 3d | 1 | 0.76mi |
| 4055 Verona Rd Unit 1496083P South Euclid, OH | 3.0 | 3.0 | 1065 | $5,069 | $4.76 | 15d | 1 | 0.80mi |
| 3230 Euclid Heights Blvd Unit NA Cleveland Heights, OH | 4.0 | 1.0 | 1705 | $2,270 | $1.33 | 24d | 1 | 0.82mi |
| 1462 Parkhill Rd Cleveland, OH | 4.0 | 1.0 | 1451 | $1,950 | $1.34 | 2d | 1 | 0.83mi |
| 4023 Okalona Rd Cleveland, OH | 3.0 | 1.5 | 1400 | $2,500 | $1.79 | 44d | 1 | 0.84mi |
| 4070 Wyncote Rd Cleveland, OH | 3.0 | 2.0 | 1233 | $1,749 | $1.42 | 2d | 1 | 0.85mi |
| 3755 Mayfield Rd Cleveland Heights, OH | 1.0–2.0 | 1.0 | 800 | $1,175 | $1.47 | 24d | 1 | 0.87mi |
| 3746 Northwood Rd Unit 1496093P University Heights, OH | 3.0 | 1.5 | 1291 | $5,767 | $4.47 | 2d | 1 | 0.88mi |
| 1497 S Noble Rd Cleveland, OH | 4.0 | 1.0 | 1250 | $2,650 | $2.12 | 2d | 1 | 0.88mi |
| 3241 Kildare Rd Unit 3241 Kildare Lower Cleveland Heights, OH | 2.0 | 1.0 | 900 | $1,095 | $1.22 | 8d | 1 | 0.90mi |
| 4165 Harwood Rd Cleveland, OH | 4.0 | 2.0 | 1608 | $1,950 | $1.21 | 44d | 1 | 1.00mi |
| 4166 Ellison Rd Cleveland, OH | 3.0 | 2.0 | 1131 | $1,695 | $1.50 | 3d | 1 | 1.01mi |
| 4049 Bushnell Rd Cleveland, OH | 3.0 | 1.5 | 1552 | $2,100 | $1.35 | 2d | 1 | 1.04mi |
| 1599 Felton Rd Cleveland, OH | 3.0 | 1.5 | 1248 | $1,650 | $1.32 | 44d | 1 | 1.05mi |
| 1478 Sherbrook Rd Cleveland, OH | 3.0 | 1.0 | 1170 | $1,195 | $1.02 | 44d | 1 | 1.05mi |
| 2223 Lee Rd Cleveland, OH | 2.0 | 1.0–2.0 | 1015 | $2,850 | $2.81 | 2d | 60 | 1.07mi |
| 3810 Parkdale Rd Cleveland, OH | 3.0 | 1.5 | 1281 | $2,067 | $1.61 | 2d | 1 | 1.08mi |
| 3300 Dellwood Rd Cleveland, OH | 3.0 | 1.0 | 1560 | $1,585 | $1.02 | 15d | 1 | 1.10mi |
| 4241 Bayard Rd Cleveland, OH | 3.0 | 2.0 | 1350 | $1,995 | $1.48 | 24d | 1 | 1.13mi |
Listing history 3 events
-
2026-06-18days on market $169,900 Active 2 DOM
-
2026-06-17remarks 699-char remark
-
2026-06-17$169,900 Active 1 DOM
ⓘ Source: listings_history table (triggers on properties + properties_extension) + one-shot
backfill from property_details.listing_events for pre-trigger history.
Tax reassessment forecast OH · Partial reset (capped growth)
- Current annual tax
- $4,940 · $412/mo
- Projected year-2 tax
- $4,940 · $412/mo
- Expected delta
- $0/yr ($0/mo · 0.0%)
ⓘ Screening estimate from a state-policy table — verify with the county assessor before closing.
Climate risk First Street
- Flood 1/10 Low FEMA zone X (unshaded) · 0% chance over 30 yrs
- Wildfire 1/10 Low
- Heat 2/10 Low 7 d/yr ≥96°F today · 17 d/yr by 30 yrs out
- Wind 1/10 Low
- Air quality 3/10 Moderate 2 unhealthy d/yr today · 5 by 30 yrs out
Nearby sold comps map
Loading sold comps map…
Walkable amenities ~0.75 mi
Loading nearby amenities…
Taxation est. · year 1
- Rental income
- $20,918
- − Mortgage interest
- −$9,517
- − Property taxes
- −$4,940
- − Insurance
- −$850
- − Repairs & maintenance
- −$1,673
- − Management
- −$1,673
- − Depreciation
- −$4,943
- Taxable loss
- −$2,678
- Est. tax savings @ 24.0%
- +$643
- After-tax cash flow
- $687/yr
For passive investors: Depreciation is non-cash, so a rental often shows a tax loss while cash-flowing — sheltering income. Rental losses are passive: they offset passive income freely, and up to $25,000/yr can offset ordinary (W-2) income if you actively participate and your MAGI is under $100k (phasing out to $0 by $150k); unused losses carry forward. On sale, claimed depreciation is recaptured at up to 25%, and gains may owe capital-gains tax (a 1031 exchange can defer both). Figures are a year-1 estimate at your 24.0% rate — not tax advice; consult a CPA.
Schools (NCES district)
- District
- Cleveland Heights-University Heights City
- NCES district ID
- 3904379
- Math proficiency
- 23% ▼ -22.00%
- Reading proficiency
- 41% ▼ -12.00%
- Median HH income
- $53,451
- Composite
- 28.12/100
- National rank
- #6822
- State rank
- #568 of 656 in OH
Livability — Cleveland Heights
- Score
- 89/100
- State rank
- #12
- US rank
- #124
Category grades
Schools grade is shown separately in the Schools card above.
Census & demographics
- Census place
- Cleveland Heights, OH
- County
- Cuyahoga County · 1,090,369 people
- City population
- 32,312
- Metro
- Cleveland-Elyria, OH
- Population (ZIP)
- 40,715
- Household income
- $77,555
- Rent vs Own
- Severe rent burden
- 1847.0
Population outlook (Cuyahoga County) Hauer SSP2
- Today (2025)
- 1,244,621 people
- By 2030
- 1,230,093 · -1.2%
- By 2040
- 1,189,108 · -4.5%
- By 2050
- 1,145,706 · -7.9%
- By 2075
- 1,076,557 · -13.5%
- By 2100
- 978,987 · -21.3%
Race, ethnicity, and origin ACS 2023
- Neighborhood character
- Diverse neighborhood (Simpson 0.56)
- Race & ethnicity
- White 57% Black 33% Two or more races 4% Asian 3% Hispanic / Latino 2%
- Common ancestry
- Romanian 4% Scotch-Irish 2% Italian 2%
- Foreign-born
- 6% · Canada, China
- Languages at home
- 92% English-only · Spanish 2% Russian/Polish/Slavic 1% Other Indo-European 1%
Political lean MEDSL · Cuyahoga
- 2024 margin
- Solid D (+31.5) · D 65.4% · R 33.9%
- 2008→2024 swing
- -7.4pp toward R · 2008: 38.9pp · 2024: 31.5pp
- All cycles
- 2024: D+31.5 2020: D+34.1 2016: D+35.0 2012: D+38.7 2008: D+38.9
Not yet ingested
- Civics
- —
Market trends
- HPI YoY
- ▼ -319.62%
- Current HPI
- 204.5504
- Rent YoY
- ▲ 5.70%
- Metro
- Cleveland-Elyria, OH
- State GDP YoY
- ▲ 1.98%
- F500 in state
- 48
Industry mix (Fortune 500 HQ in OH)
| Industry | F500 HQs | Revenue |
|---|---|---|
| Insurance | 3 | $145B |
|
||
| Industrial Machinery | 3 | $49B |
|
||
| Financial Services | 3 | $24B |
|
||
| Consumer Goods | 2 | $93B |
|
||
| Aerospace / Defense | 2 | $47B |
|
||
| Utilities | 2 | $33B |
|
||
Price history
+553.5% since first listed17 events — show timeline
- 2026-06-12 Listed $169,900 MLSNOW
- 2017-06-13 Sold (Public Records) $843,690 Public Records
- 2017-04-28 Listing Removed — MLSNOW
- 2017-04-26 Listed $95,900 MLSNOW
- 2008-11-09 Listing Removed — MLSNOW
- 2008-05-09 Listed $107,900 MLSNOW
- 2008-01-04 Sold (MLS) $44,000 MLSNOW
- 2007-10-09 Listed $47,900 MLSNOW
- 1991-10-01 Sold (MLS) $59,500 MLSNOW
- 1991-09-30 Sold (Public Records) $59,500 Public Records
- 1991-07-20 Listed $59,900 MLSNOW
- 1991-07-12 Listing Removed — MLSNOW
- 1991-04-07 Listing Removed — MLSNOW
- 1991-02-12 Listed $59,900 MLSNOW
- 1990-10-07 Listed $59,900 MLSNOW
- 1979-12-18 Sold (Public Records) $41,000 Public Records
- 1977-09-01 Sold (Public Records) $26,000 Public Records
Property tax history
+4.3%/yrLatest (2025): $4,940 · -2.0% YoY. Source: county tax records.
Cash-flow waterfall
monthlySold comps — $/sqft
last 12 mo · ≤1 miLoading sold comps…