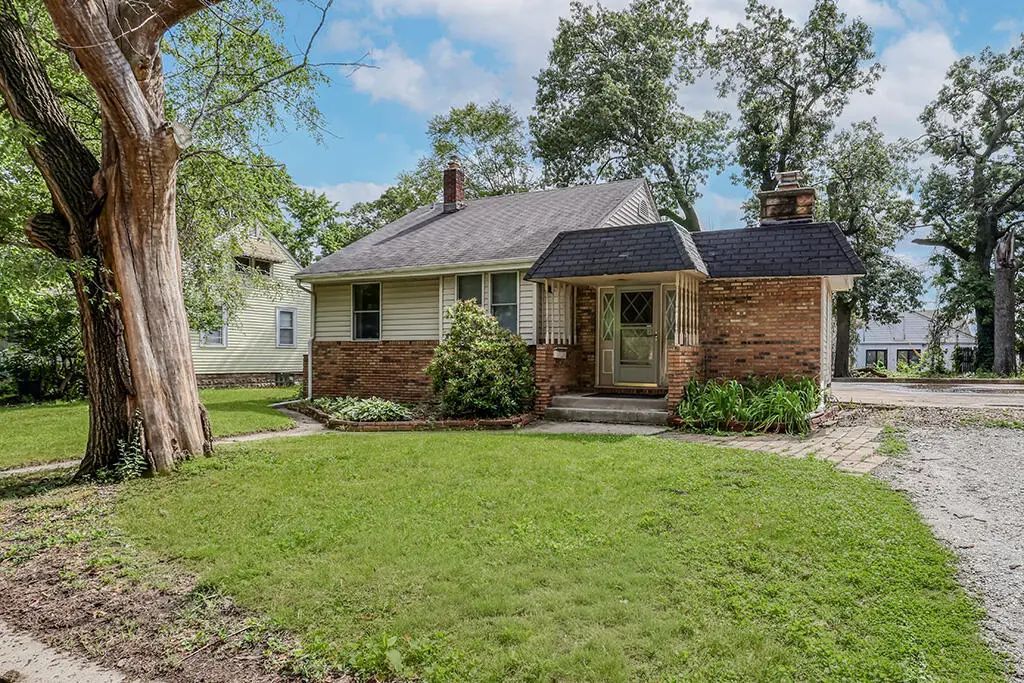
131 N Harvey St · Griffith, IN
Flood risk 1/10 · Minimal
- FEMA flood zone
- X (unshaded)
- Chance of flooding over 30 yrs
- 0.0%
- Est. flood insurance / yr
- $473 – $860
Fire risk 1/10 · Minimal
- Est. fire insurance / yr
- $717 – $1,331
Heat risk 3/10 · Minor
- Hot days now (above 102°F)
- 7 days/yr
- Hot days in 30 yrs
- 15 days/yr
Wind risk 2/10 · Minimal
- Chance of severe wind over 30 yrs
- 0.0%
Air-quality risk 3/10 · Minor
- Unhealthy air days now
- 2 days/yr
- Unhealthy air days in 30 yrs
- 3 days/yr
Risk factors via First Street. Map © Google.
Why this score? — see what drove the D+ grade
The composite is a weighted blend of 9 inputs, each scored 0–100. Each bar is that input's sub-score; the figure is the points it added to the 100-point composite (weight × sub-score).
- ARV discount +15.0/15.0
- Cash flow +13.4/30.0
- DSCR +4.0/10.0
- 1% rule +3.6/10.0
- Livability +3.5/5.0
- Schools +3.0/10.0
- Rent growth +2.5/5.0
- Condition / age +2.5/5.0
- Appreciation +0.0/10.0
$175,000
🖨 Deal sheet 📄 Offer letter ✓ Due diligence
Listing remarks
Located on a quiet dead-end street just a few blocks from downtown Griffith, this 3 bedroom, 1 bath home offers 1,111 square feet, a great layout, and a large . 29 acre lot. Features include some hardwood flooring, a full basement sealed by EverDry Waterproofing, and a new water heater in 2025. Plenty of opportunity to update and make it your own. Sold as-is.
Key facts
- New water heater
- 0.29 acre lot
- Garage
Tags
Property features AI
Finance
- Other: Property listed as owner-occupied (occupant type: Owner)
Exterior
- Parking: Detached garage with alley access and garage facing rear; 1 garage space
- Security: Smoke detector(s)
- Utilities: Public water; Public sewer; Natural gas connected; Electricity connected with circuit breakers; Cable available/connected
- Home design: One-level home; Built in 1941; Fixer condition
- Construction: Brick and vinyl siding exterior; Shingle roof; Foundation with crawl space
- Exterior features: Partial fencing; Neighborhood view; Garage(s) on property; Crawl space and unfinished basement with interior entry and storage space
Interior
- Kitchen: Gas range; Range hood
- Bedrooms: Primary bedroom; Bedroom 2; Bedroom 3; Bedroom on lower level
- Flooring: Hardwood; Carpet; Vinyl; Tile; Laminate; Concrete
- Bathrooms: 1 full bathroom
- Heating & cooling: Central heating (forced air); Central air conditioning; Ceiling fan(s)
- Interior features: Ceiling fans; Pantry; Blinds; Insulated windows; Smoke detectors; Rain gutters
- Laundry & utility: Washer hookup; Gas dryer hookup; Laundry sink; Washer and dryer included; Gas water heater
Neighborhood map
What this means for you Summary
Snapshot
- This is a 3-bed/1.0-bath single-family listed at $175k.
Deal economics
- At list price, monthly cash flow is $3 ($36/yr) — positive.
- The deal already cash-flows at list — no discount required.
- To meet the 1% rule (rent ≥ 1% of price), the offer needs to be $151k (13.8% below list).
- Recommended offer: $151k (13.8% below list) — sets the bar for 1% rule.
- Cap rate 6.3% vs local median 4.9% in Griffith — meaningfully above typical; check what's discounted (condition, days-on-market, listing class) to confirm the premium yield is real.
Location & tenants
- Location reads 70/100 on livability (#146 in IN) — a middle-class / working-renter tenant base. Strengths: cost of living A+, housing A+, crime A; Watch: amenities F, commute F, health & safety F.
- Griffith Public Schools (suburban): math 31% / reading 38% proficiency, ranked #189 of 301 in IN (top 63%) — families likely to look elsewhere, expect single-tenant / working-renter base with shorter leases.
- Zoned schools: Beiriger Elementary School (math 45% / reading 35%, grade F, #494 of 994 statewide, top 50%, 443 students, 58% FRL); Griffth Jr/Sr High School (math 32% / reading 62%, grade D-, #143 of 369 statewide, top 44%, 1,059 students, 55% FRL).
- Market conditions: 66 active listings in the ZIP; 7 comparable units currently listed for rent nearby; rentals leasing fast (median 7d on market — plan ~1-2 weeks tenant-placement turnaround); 1,642 units permitted in Lake County in 2024 (14 in 5+ unit buildings).
Forward outlook
- Local home prices are declining (-3.0%/yr); year-one equity from $1k of loan paydown is wiped out by about $5k of value loss. Plan a longer hold.
- Lake County population projected to shrink 7% by 2050 — rents likely to lag national; underwrite the cash flow, not the appreciation.
Negotiation context
- Only 1 days on market — expect competitive offers; lowballing is unlikely to land.
- 2 sale attempts with the ask held roughly flat each time — persistent listings suggest the price (not the market) is what's stuck; bring a comps-based counter.
Risks & watch-outs
- Watch-outs: built in 1941 — expect roof / HVAC / electrical / plumbing capex.
Questions for the listing agent
- Built in 1941 — when were the roof, HVAC, electrical panel, plumbing, and water heater last replaced?
- Is there a deadline driving the sale (1031 exchange, divorce, estate, relocation)? That informs how much negotiation room exists.
- The area grade is low — what's the realistic commute time and amenity access for the typical tenant pool here? Any planned neighborhood developments (good or bad) we should know about?
- What's the average days-on-market for RENTAL listings here right now (not sales)? A rising rental-DOM trend means longer vacancies and softer asking-rent achievability than the comps imply.
- What's the recent tenant-quality profile in this submarket — average credit score on applications, eviction rate, late-payment / NSF rate, and stable-employment percentage? A property-management company in the area should have these aggregated.
- How much new for-sale + rental construction is in the pipeline within 1–3 miles? Heavy new supply typically softens prices + rents 12–24 months out; constrained supply supports both.
Investment metrics
- 1% rule
- 0.86% ✗
- Cap rate
- 6.31%
- Cash-on-cash
- 0.07%
- DSCR
- 1.00
- GRM
- 9.7
CMA / ARV
- ARV (on-the-fly)
- $228,866
- Comps found
- 12
Show comp detail 12 sales within ~0.75 mi
| Address | Dist | Beds/Ba | Sqft | Sold | Price | $/sf | Match |
|---|---|---|---|---|---|---|---|
| 238 N Indiana St | 0.32mi | 3/1.0 | 1,042 (-6%) | 1mo | $150,000 | $144 | 74 |
| 213 N Woodlawn Ave | 0.11mi | 2/2.0 (-1) | 1,062 (-4%) | 14mo | $239,899 | $226 | 67 |
| 614 W Elm St | 0.51mi | 3/1.5 | 1,152 (+4%) | 2mo | $215,000 | $187 | 66 |
| 233 N Ernest St | 0.34mi | 3/1.5 | 1,232 (+11%) | 0mo | $227,000 | $184 | 64 |
| 606 N Lindberg St | 0.62mi | 3/1.0 | 1,064 (-4%) | 2mo | $249,900 | $235 | 62 |
| 234 N Woodlawn Ave | 0.17mi | 2/1.0 (-1) | 1,252 (+13%) | 5mo | $140,000 | $112 | 62 |
| 139 N Dwiggins St | 0.50mi | 2/1.0 (-1) | 1,128 (+2%) | 11mo | $135,000 | $120 | 60 |
| 702 N Lindberg St | 0.73mi | 3/1.0 | 1,120 (+1%) | 6mo | $260,000 | $232 | 59 |
| 555 W Pine St | 0.70mi | 3/1.0 | 1,064 (-4%) | 2mo | $235,000 | $221 | 59 |
| 716 N Cline Ave | 0.75mi | 3/1.0 | 1,120 (+1%) | 10mo | $254,900 | $228 | 56 |
| 141 N Dwiggins St | 0.50mi | 2/1.0 (-1) | 1,232 (+11%) | 2mo | $235,000 | $191 | 52 |
| 539 S Rensselaer St | 0.74mi | 4/1.0 (+1) | 1,260 (+13%) | 1mo | $259,900 | $206 | 37 |
Match score weights: distance 35% · size 25% · config 20% · recency 20%. Top-matched comps best support the ARV.
Projected returns pro-forma
-3.0% appreciation · 3.0% rent growth · sell at horizon
- IRR
- -16.2%
- Equity multiple
- 0.43×
- Total profit
- $-28,158
- Equity at exit
- $26,093
- IRR
- -7.9%
- Equity multiple
- 0.51×
- Total profit
- $-24,235
- Equity at exit
- $15,131
Cash invested: $49,000 (down + closing). Projections, not guarantees.
Landlord ↔ Tenant lean methodology
- Overall (STATE)
- 90 Strongly Landlord-Friendly
- State Indiana
- 90 Strongly Landlord-Friendly · R+11
- County
- — inherits STATE
- City
- — inherits STATE
ZIP-level market 46319
- Home prices YoY
- -25.5%
- Active inventory
- 66
- Price-to-rent
- 9.7×
Monthly cashflow live
- Estimated rent
- $1,508 high interval (Pro) →
- Mortgage (P&I)
- −$918
- Tax from tax record
- −$197 /mo · $2,370/yr
- Insurance
- −$73
- HOA
- −$0
- Vacancy / Maint / Mgmt
- −$317
- Net cashflow
- $3
Break-even live
UW: 25.0% down · 7.5% · 30yr · 1.5% tax · 5.0% vac · 8.0% maint · 8.0% mgmt
Financing live
Cash to close
- Down payment
- $43,750
- Closing costs
- $5,250
- Reserves months
- —
- Total cash needed
- —
Loan-product check · same deal, 3 products live
Conventional
25% down · 7.5% · 30yr
- Down + closing
- —
- Monthly P&I
- —
- Monthly cashflow
- —
- DSCR
- —
- Eligible?
- —
Personal DTI + credit; lowest rate.
DSCR
20% down · 8.5% · 30yr
- Down + closing
- —
- Monthly P&I
- —
- Monthly cashflow
- —
- DSCR
- —
- Eligible?
- —
No personal income docs; deal must DSCR.
Hard money
10% down · 12.0% · 12mo
- Down + closing
- —
- Monthly P&I
- —
- Monthly cashflow
- —
- DSCR
- —
- Eligible?
- —
Short-term bridge; refi at stabilization.
Rent comps 7 comps
| Address | Beds | Baths | Sqft | Rent | $/sqft | DOM | Units | Dist |
|---|---|---|---|---|---|---|---|---|
| 420 N Broad St Unit 1 Griffith, IN | 2.0 | 1.0 | 825 | $1,295 | $1.57 | 1d | 1 | 0.35mi |
| 422 N Dwiggins St Griffith, IN | 2.0 | 1.0 | 1135 | $1,650 | $1.45 | 24d | 1 | 0.60mi |
| 329 N Jay St Griffith, IN | 2.0 | 1.0 | 832 | $1,450 | $1.74 | 12d | 1 | 0.62mi |
| 632 N Elmer St Apt C Griffith, IN 46319 Griffith, IN | 2.0 | 1.0 | 870 | $1,300 | $1.49 | 7d | 1 | 0.73mi |
| 820 N Wheeler St Griffith, IN | 1.0–2.0 | 1.0 | 870 | $1,400 | $1.61 | 1d | 1 | 1.18mi |
| 9616 Farmer Dr Highland, IN | 2.0 | 1.0 | 960 | $1,516 | $1.58 | 1d | 1 | 1.32mi |
| 9616 Farmer Dr Highland, IN | 2.0 | 1.0 | 960 | $1,629 | $1.70 | 16d | 1 | 1.32mi |
Listing history 2 events
-
2026-06-13remarks 361-char remark
-
2026-06-13$175,000 Pending 1 DOM
ⓘ Source: listings_history table (triggers on properties + properties_extension) + one-shot
backfill from property_details.listing_events for pre-trigger history.
Tax reassessment forecast IN · Partial reset (capped growth)
- Current annual tax
- $2,370 · $197/mo
- Projected year-2 tax
- $2,370 · $197/mo
- Expected delta
- $0/yr ($0/mo · 0.0%)
ⓘ Screening estimate from a state-policy table — verify with the county assessor before closing.
Climate risk First Street
- Flood 1/10 Low FEMA zone X (unshaded) · 0% chance over 30 yrs
- Wildfire 1/10 Low
- Heat 3/10 Moderate 7 d/yr ≥102°F today · 15 d/yr by 30 yrs out
- Wind 2/10 Low 0% chance of damaging wind over 30 yrs
- Air quality 3/10 Moderate 2 unhealthy d/yr today · 3 by 30 yrs out
Nearby sold comps map
Loading sold comps map…
Walkable amenities ~0.75 mi
Loading nearby amenities…
Taxation est. · year 1
- Rental income
- $18,093
- − Mortgage interest
- −$9,803
- − Property taxes
- −$2,370
- − Insurance
- −$875
- − Repairs & maintenance
- −$1,447
- − Management
- −$1,447
- − Depreciation
- −$5,091
- Taxable loss
- −$2,941
- Est. tax savings @ 24.0%
- +$706
- After-tax cash flow
- $742/yr
For passive investors: Depreciation is non-cash, so a rental often shows a tax loss while cash-flowing — sheltering income. Rental losses are passive: they offset passive income freely, and up to $25,000/yr can offset ordinary (W-2) income if you actively participate and your MAGI is under $100k (phasing out to $0 by $150k); unused losses carry forward. On sale, claimed depreciation is recaptured at up to 25%, and gains may owe capital-gains tax (a 1031 exchange can defer both). Figures are a year-1 estimate at your 24.0% rate — not tax advice; consult a CPA.
Schools (NCES district)
- District
- Griffith Public Schools
- NCES district ID
- 1804170
- Math proficiency
- 31% ▼ -15.00%
- Reading proficiency
- 38% ▼ -5.00%
- Median HH income
- $54,808
- Composite
- 30.37/100
- National rank
- #6254
- State rank
- #189 of 301 in IN
Livability — Griffith
- Score
- 70/100
- State rank
- #146
- US rank
- #7400
Category grades
Schools grade is shown separately in the Schools card above.
Census & demographics
- Census place
- Griffith, IN
- County
- Lake County · 422,878 people
- City population
- 17,847
- Metro
- Chicago-Naperville-Elgin, IL-IN-WI
- Population (ZIP)
- 17,847
- Household income
- $74,662
- Rent vs Own
- Severe rent burden
- 504.0
Population outlook (Lake County) Hauer SSP2
- Today (2025)
- 484,026 people
- By 2030
- 478,091 · -1.2%
- By 2040
- 462,974 · -4.3%
- By 2050
- 449,894 · -7.1%
- By 2075
- 436,169 · -9.9%
- By 2100
- 426,607 · -11.9%
Race, ethnicity, and origin ACS 2023
- Neighborhood character
- Majority White (64%)
- Race & ethnicity
- White 64% Hispanic / Latino 17% Black 13% Two or more races 12% Asian 2%
- Hispanic origin (detail)
- Mexican 14% Puerto Rican 1%
- Common ancestry
- Romanian 14% Iranian 4% Lithuanian 2%
- Foreign-born
- 6% · Canada, Philippines, China
- Languages at home
- 88% English-only · Spanish 9% Russian/Polish/Slavic 1% Other Asian/Pacific 1%
Political lean MEDSL · Lake
- 2024 margin
- Lean D (+5.6) · D 52.1% · R 46.5% · Other 1.5%
- 2008→2024 swing
- -28.6pp toward R · 2008: 34.3pp · 2024: 5.6pp
- All cycles
- 2024: D+5.6 2020: D+15.1 2016: D+20.6 2012: D+31.0 2008: D+34.3
Not yet ingested
- Civics
- —
Market trends
- HPI YoY
- ▼ -95.17%
- Current HPI
- 278.3139
- Rent YoY
- —
- Metro
- Chicago-Naperville-Elgin, IL-IN-WI
- State GDP YoY
- ▲ 2.90%
- F500 in state
- 18
Industry mix (Fortune 500 HQ in IN)
| Industry | F500 HQs | Revenue |
|---|---|---|
| Industrial Machinery | 2 | $37B |
|
||
| Healthcare | 1 | $177B |
|
||
| Pharmaceuticals | 1 | $45B |
|
||
| Metals / Steel | 1 | $18B |
|
||
| Agriculture | 1 | $17B |
|
||
| Packaging | 1 | $12B |
|
||
Price history
+0.0% since first listed4 events — show timeline
- 2026-06-13 Pending — NIRA MLS as Distributed by MLS Grid
- 2026-06-12 Listing Removed — NIRA MLS as Distributed by MLS Grid
- 2026-06-12 Listed $175,000 NIRA MLS as Distributed by MLS Grid
- 2026-05-21 Listed $175,000 NIRA MLS as Distributed by MLS Grid
Property tax history
+8.8%/yrLatest (2024): $2,370 · +3.8% YoY. Source: county tax records.
Cash-flow waterfall
monthlySold comps — $/sqft
last 12 mo · ≤1 miLoading sold comps…