 🏷️ Likely Rental
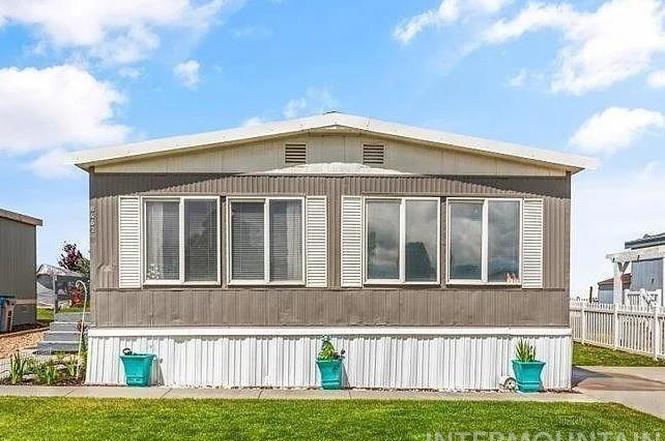
8463 Blue Heaven Ln · Boise City, ID
Flood risk No data
- FEMA flood zone
- —
- Chance of flooding over 30 yrs
- —
- Est. flood insurance / yr
- —
Fire risk No data
- Est. fire insurance / yr
- —
Heat risk No data
- Hot days now (above threshold)
- —
- Hot days in 30 yrs
- —
Wind risk No data
- Chance of severe wind over 30 yrs
- —
Air-quality risk No data
- Unhealthy air days now
- —
- Unhealthy air days in 30 yrs
- —
Risk factors via First Street. Map © Google.
Why this score? — see what drove the B+ grade
The composite is a weighted blend of 9 inputs, each scored 0–100. Each bar is that input's sub-score; the figure is the points it added to the 100-point composite (weight × sub-score).
- Cash flow +30.0/30.0
- ARV discount +15.0/15.0
- 1% rule +10.0/10.0
- DSCR +10.0/10.0
- Schools +4.2/10.0
- Rent growth +3.7/5.0
- Livability +2.5/5.0
- Condition / age +2.5/5.0
- Appreciation +0.0/10.0
$110,000
🖨 Deal sheet 📄 Offer letter ✓ Due diligence
Listing remarks
Wonderful community. Newer paint inside & out. Appliances are included. Large master bedroom and master bath. Blue Valley Mobile Home Park is located close to interstate & stores. The park has a lake and walking paths to enjoy. No back neighbors with beautiful view of sunsets. Buyer to purchase property in "as is" condition. Application and background check must be completed and approved by [email protected]. BTVA
Key facts
- Pond
- Walking paths
- Built 1978
Tags
Property features AI
Exterior
- Utilities: Community water service; Sewer connected
- Home design: Mobile/manufactured home on a rented lot
- Construction: Metal siding; Built in 1978
- Exterior features: Metal roof; Irrigation available; Manual sprinkler system; Paved road access; Located in a mobile home park
Interior
- Kitchen: Kitchen on main level; Breakfast bar; Pantry; Dishwasher; Disposal; Oven/Range (freestanding); Refrigerator
- Bedrooms: 3 bedrooms (all on the main level)
- Bathrooms: 2 bathrooms
- Heating & cooling: Electric forced-air heating; Wall/window air conditioning units
- Interior features: Master bedroom on main level; Breakfast bar; Pantry
- Laundry & utility: Washer; Dryer; Electric water heater
Neighborhood map
What this means for you Summary
Snapshot
- This is a 3-bed/2.0-bath manufactured listed at $110k.
Deal economics
- At list price, monthly cash flow is $1k ($14k/yr) — positive.
- The deal already cash-flows at list — no discount required.
- Meets the 1% rule at list price ($2k rent vs $110k).
- Recommended offer: $97k (12.0% below list) — sets the bar for market timing.
- Cap rate 19.1% vs local median 2.6% in Boise City — top-decile yield for the area; either an underpriced asset or a hidden risk that comps aren't pricing in. Stress-test before assuming the spread holds.
Location & tenants
- Location reads: area grade B — affects rentability + tenant quality, not the cash-flow math above.
- Boise Independent District (urban): math 42% / reading 56% proficiency, ranked #36 of 92 in ID (top 39%) — families likely to look elsewhere, expect single-tenant / working-renter base with shorter leases.
- Zoned schools: Timberline High School (math 53% / reading 74%, grade B-, #14 of 169 statewide, top 8%, 1,398 students, 10% FRL) — zoned schools average 10% FRL vs 33% district-wide (24 pts lower); this property's tenant base skews higher-income than the district average.
- Zoned-school proficiency averages 64% at this address vs 49% district-wide (+14 pts) — the actual schools serving this property are materially stronger than the Boise Independent District average implies; a family-tenant draw the district grade alone would hide.
- Market conditions: Rents rising fast (+4.8%/yr); 328 active listings in the ZIP; high-income renter base; 5,129 units permitted in Ada County in 2024 (414 in 5+ unit buildings).
Forward outlook
- Local home prices are declining (-3.0%/yr); year-one equity from $761 of loan paydown is wiped out by about $3k of value loss. Plan a longer hold.
- Ada County population projected at +45% by 2050 — long-run rental-demand tailwind backs the buy-and-hold thesis.
- At projected returns (-3.0% appreciation + 4.8% rent growth), your $31k cash investment doubles in ~3 years — after that, you're playing with house money.
Negotiation context
- It's been on market 121 days — a 12% lower offer ($97k) is reasonable based on typical stale-listing flexibility.
- 4 sale attempts since 8y ago; this cycle's ask is 10% above the opening price — seller raised mid-cycle; expect resistance to lowballs.
Questions for the listing agent
- It's been on market 121 days. Have you received any prior offers? Is the seller open to a 12% concession, seller financing, or rate buy-down credit?
- Built in 1978 — when were the roof, HVAC, electrical panel, plumbing, and water heater last replaced?
- Why hasn't it sold? Are there any deal-killer items the seller is aware of (foundation, flood, title, zoning, code violations)?
- Is there a deadline driving the sale (1031 exchange, divorce, estate, relocation)? That informs how much negotiation room exists.
- What's the average days-on-market for RENTAL listings here right now (not sales)? A rising rental-DOM trend means longer vacancies and softer asking-rent achievability than the comps imply.
- What's the recent tenant-quality profile in this submarket — average credit score on applications, eviction rate, late-payment / NSF rate, and stable-employment percentage? A property-management company in the area should have these aggregated.
- How much new for-sale + rental construction is in the pipeline within 1–3 miles? Heavy new supply typically softens prices + rents 12–24 months out; constrained supply supports both.
Investment metrics
- 1% rule
- 2.22% ✓
- Cap rate
- 19.09%
- Cash-on-cash
- 45.70%
- DSCR
- 3.03
- GRM
- 3.7
CMA / ARV
- ARV (on-the-fly)
- $154,560
- Comps found
- 12
Show comp detail 12 sales within ~0.75 mi
| Address | Dist | Beds/Ba | Sqft | Sold | Price | $/sf | Match |
|---|---|---|---|---|---|---|---|
| 2164 Blue Spruce Ln #194 | 0.14mi | 3/2.0 | 1,296 (-4%) | 1mo | $229,999 | $177 | 87 |
| 8287 S Blue Rim Lane #22 Ln | 0.19mi | 3/2.0 | 1,344 (0%) | 6mo | $169,900 | $126 | 86 |
| 8433 Blue Heaven Ln | 0.02mi | 3/2.0 | 1,404 (+4%) | 10mo | $140,000 | $100 | 84 |
| 8255 Blue Ridge Lane #6 Ln | 0.20mi | 3/2.0 | 1,368 (+2%) | 10mo | $150,000 | $110 | 80 |
| 8533 Blue Hill Lane #134 #134 | 0.06mi | 3/2.0 | 1,493 (+11%) | 6mo | $174,000 | $117 | 74 |
| 8426 S Blue Heaven Ln | 0.04mi | 4/2.0 (+1) | 1,440 (+7%) | 9mo | $149,900 | $104 | 74 |
| 1984 Blue Spruce Lane #170 Ln | 0.06mi | 3/2.0 | 1,512 (+12%) | 9mo | $174,000 | $115 | 69 |
| 8426 Blue Heaven #149 #149 | 0.04mi | 4/2.0 (+1) | 1,536 (+14%) | 3mo | $144,200 | $94 | 67 |
| 2119 E Blue Sage | 0.15mi | 3/2.0 | 1,152 (-14%) | 2mo | $145,900 | $127 | 67 |
| 2312 Blue Lake Lane #70 #70 | 0.25mi | 3/2.0 | 1,493 (+11%) | 4mo | $151,000 | $101 | 66 |
| 8283 Blue Heaven | 0.11mi | 3/2.0 | 1,512 (+12%) | 10mo | $165,000 | $109 | 66 |
| 2309 Blue Sage Lane #96 Ln | 0.24mi | 3/2.0 | 1,492 (+11%) | 10mo | $179,000 | $120 | 62 |
Match score weights: distance 35% · size 25% · config 20% · recency 20%. Top-matched comps best support the ARV.
Projected returns pro-forma
-3.0% appreciation · 4.78% rent growth · sell at horizon
- IRR
- 44.9%
- Equity multiple
- 2.99×
- Total profit
- $61,386
- Equity at exit
- $16,401
- IRR
- 51.6%
- Equity multiple
- 6.48×
- Total profit
- $168,791
- Equity at exit
- $9,511
Cash invested: $30,800 (down + closing). Projections, not guarantees.
Landlord ↔ Tenant lean methodology
- Overall (STATE)
- 91 Strongly Landlord-Friendly
- State Idaho
- 91 Strongly Landlord-Friendly · R+18
- County
- — inherits STATE
- City
- — inherits STATE
ZIP-level market 83716
- Home prices YoY
- -22.8%
- Rents YoY
- 4.8%
- Active inventory
- 328
- Price-to-rent
- 3.7×
Monthly cashflow live
- Estimated rent
- $2,447 medium interval (Pro) →
- Mortgage (P&I)
- −$577
- Tax est. 1.5%
- −$138 /mo · $1,650/yr
- Insurance
- −$46
- HOA
- −$0
- Vacancy / Maint / Mgmt
- −$514
- Net cashflow
- $1,173
Break-even live
UW: 25.0% down · 7.5% · 30yr · 1.5% tax · 5.0% vac · 8.0% maint · 8.0% mgmt
Financing live
Cash to close
- Down payment
- $27,500
- Closing costs
- $3,300
- Reserves months
- —
- Total cash needed
- —
Loan-product check · same deal, 3 products live
Conventional
25% down · 7.5% · 30yr
- Down + closing
- —
- Monthly P&I
- —
- Monthly cashflow
- —
- DSCR
- —
- Eligible?
- —
Personal DTI + credit; lowest rate.
DSCR
20% down · 8.5% · 30yr
- Down + closing
- —
- Monthly P&I
- —
- Monthly cashflow
- —
- DSCR
- —
- Eligible?
- —
No personal income docs; deal must DSCR.
Hard money
10% down · 12.0% · 12mo
- Down + closing
- —
- Monthly P&I
- —
- Monthly cashflow
- —
- DSCR
- —
- Eligible?
- —
Short-term bridge; refi at stabilization.
Listing history 29 events
-
2026-06-18days on market $110,000 Active 121 DOM
-
2026-06-17days on market $110,000 Active 120 DOM
-
2026-06-16days on market $110,000 Active 119 DOM
-
2026-06-15price $110,000 Active 118 DOM
-
2026-06-15days on market $99,800 Active 118 DOM
-
2026-06-13days on market $99,800 Active 116 DOM
-
2026-06-10days on market $99,800 Active 113 DOM
-
2026-06-09days on market $99,800 Active 112 DOM
-
2026-06-08days on market $99,800 Active 111 DOM
-
2026-06-07days on market $99,800 Active 110 DOM
-
2026-06-05days on market $99,800 Active 107 DOM
-
2026-06-03days on market $99,800 Active 106 DOM
-
2026-06-03days on market $99,800 Active 105 DOM
-
2026-06-01days on market $99,800 Active 104 DOM
-
2026-05-31days on market $99,800 Active 103 DOM
-
2026-04-10price $99,800
-
2026-03-06price $99,900
-
2026-02-17$100,000 Active
-
2024-08-15historical
-
2024-06-29$110,000 Active
-
2019-06-01historical
-
2019-05-15price $49,000
-
2019-03-26price $54,000
-
2019-01-03price $57,000
-
2018-12-12price $67,000
-
2018-12-11status Active
-
2018-10-20historical
-
2018-08-17price $47,000
-
2018-08-15$57,000 Active
ⓘ Source: listings_history table (triggers on properties + properties_extension) + one-shot
backfill from property_details.listing_events for pre-trigger history.
Nearby sold comps map
Loading sold comps map…
Walkable amenities ~0.75 mi
Loading nearby amenities…
Taxation est. · year 1
- Rental income
- $29,366
- − Mortgage interest
- −$6,162
- − Property taxes
- −$1,650
- − Insurance
- −$550
- − Repairs & maintenance
- −$2,349
- − Management
- −$2,349
- − Depreciation
- −$3,200
- Taxable income
- $13,106
- Est. tax owed @ 24.0%
- −$3,145
- After-tax cash flow
- $10,931/yr
For passive investors: Depreciation is non-cash, so a rental often shows a tax loss while cash-flowing — sheltering income. Rental losses are passive: they offset passive income freely, and up to $25,000/yr can offset ordinary (W-2) income if you actively participate and your MAGI is under $100k (phasing out to $0 by $150k); unused losses carry forward. On sale, claimed depreciation is recaptured at up to 25%, and gains may owe capital-gains tax (a 1031 exchange can defer both). Figures are a year-1 estimate at your 24.0% rate — not tax advice; consult a CPA.
Schools (NCES district)
- District
- Boise Independent District
- NCES district ID
- 1600360
- Math proficiency
- 42% ▼ -5.00%
- Reading proficiency
- 56% ▼ -1.00%
- Median HH income
- $49,135
- Composite
- 41.82/100
- National rank
- #3388
- State rank
- #36 of 92 in ID
Livability — Boise City
No livability data for this city. (Only ~50 U.S. cities are tracked.)
Census & demographics
- Census place
- Boise City, ID
- County
- Ada County · 522,161 people
- City population
- 152,689
- Metro
- Boise City, ID
- Population (ZIP)
- 21,402
- Household income
- $128,822
- Rent vs Own
- Severe rent burden
- 408.0
Population outlook (Ada County) Hauer SSP2
- Today (2025)
- 535,818 people
- By 2030
- 585,751 · +9.3%
- By 2040
- 682,435 · +27.4%
- By 2050
- 775,818 · +44.8%
- By 2075
- 994,458 · +85.6%
- By 2100
- 1,148,884 · +114.4%
Race, ethnicity, and origin ACS 2023
- Neighborhood character
- Predominantly White (77%)
- Race & ethnicity
- White 77% Asian 9% Two or more races 7% Hispanic / Latino 6%
- Hispanic origin (detail)
- Mexican 3%
- Common ancestry
- Italian 6% Portuguese 2% Slovak 2%
- Foreign-born
- 11% · Canada, China, South Korea
- Languages at home
- 87% English-only · Spanish 4% Chinese 2% Other Asian/Pacific 2%
Political lean MEDSL · Ada
- 2024 margin
- R (+10.3) · D 43.4% · R 53.8% · Other 2.8%
- 2008→2024 swing
- -4.2pp toward R · 2008: -6.2pp · 2024: -10.3pp
- All cycles
- 2024: R+10.3 2020: R+3.9 2016: R+9.2 2012: R+11.3 2008: R+6.2
Not yet ingested
- Civics
- —
Market trends
- HPI YoY
- ▼ -97.80%
- Current HPI
- 332.0696
- Rent YoY
- ▲ 4.78%
- Metro
- Boise City, ID
- State GDP YoY
- ▲ 4.51%
- F500 in state
- 6
Industry mix (Fortune 500 HQ in ID)
| Industry | F500 HQs | Revenue |
|---|---|---|
| Retail | 1 | $79B |
|
||
| Technology | 1 | $25B |
|
||
| Food / Agriculture | 1 | $6B |
|
||
Price history
+75.1% since first listed14 events — show timeline
- 2026-04-10 Price Changed $99,800 IMLS
- 2026-03-06 Price Changed $99,900 IMLS
- 2026-02-17 Listed $100,000 IMLS
- 2024-08-15 Listing Removed — IMLS
- 2024-06-29 Listed $110,000 IMLS
- 2019-06-01 Listing Removed — IMLS
- 2019-05-15 Price Changed $49,000 IMLS
- 2019-03-26 Price Changed $54,000 IMLS
- 2019-01-03 Price Changed $57,000 IMLS
- 2018-12-12 Price Changed $67,000 IMLS
- 2018-12-11 Relisted — IMLS
- 2018-10-20 Listing Removed — IMLS
- 2018-08-17 Price Changed $47,000 IMLS
- 2018-08-15 Listed $57,000 IMLS
Cash-flow waterfall
monthlySold comps — $/sqft
last 12 mo · ≤1 miLoading sold comps…