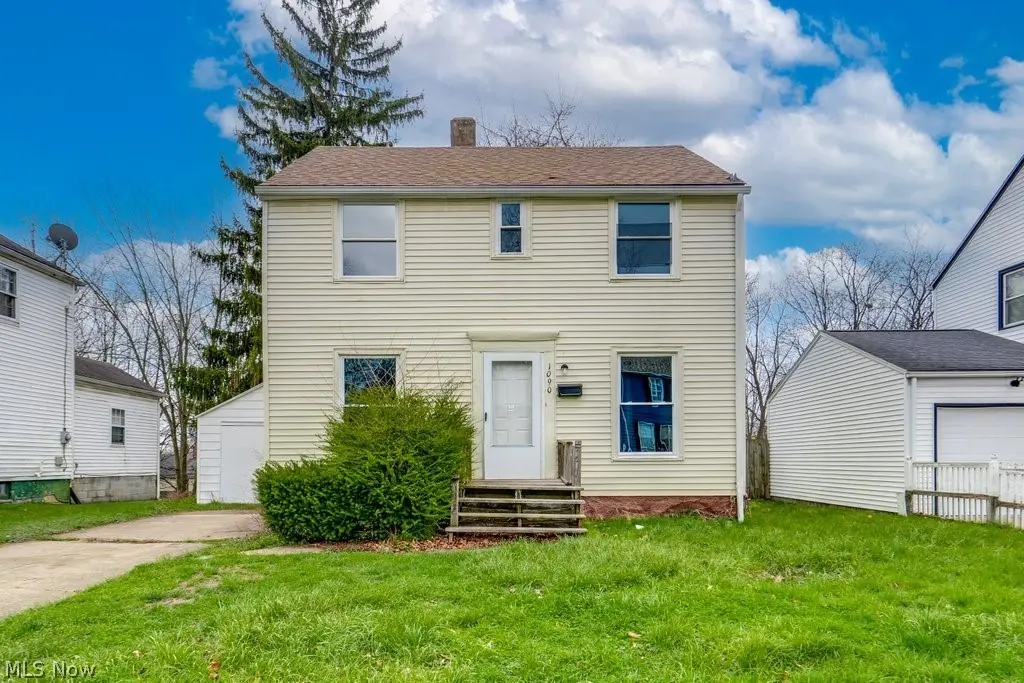
1090 Greenwood Ave · Akron, OH
Flood risk 1/10 · Minimal
- FEMA flood zone
- X (unshaded)
- Chance of flooding over 30 yrs
- 0.0%
- Est. flood insurance / yr
- $473 – $860
Fire risk 1/10 · Minimal
- Est. fire insurance / yr
- $713 – $1,323
Heat risk 3/10 · Minor
- Hot days now (above 97°F)
- 7 days/yr
- Hot days in 30 yrs
- 17 days/yr
Wind risk 1/10 · Minimal
- Chance of severe wind over 30 yrs
- —
Air-quality risk 2/10 · Minimal
- Unhealthy air days now
- 1 days/yr
- Unhealthy air days in 30 yrs
- 2 days/yr
Risk factors via First Street. Map © Google.
Why this score? — see what drove the C- grade
The composite is a weighted blend of 9 inputs, each scored 0–100. Each bar is that input's sub-score; the figure is the points it added to the 100-point composite (weight × sub-score).
- Cash flow +17.2/30.0
- ARV discount +12.1/15.0
- DSCR +5.4/10.0
- 1% rule +5.3/10.0
- Livability +4.0/5.0
- Rent growth +2.9/5.0
- Condition / age +2.5/5.0
- Schools +2.1/10.0
- Appreciation +0.0/10.0
$125,000
🖨 Deal sheet 📄 Offer letter ✓ Due diligence
Listing remarks
Welcome to 1090 Greenwood Ave in Akron! This 4-bedroom, 1.5-bath home offers a spacious and functional layout with flexibility to fit your needs. The main level features a living room, kitchen, a convenient first-floor bedroom, and a half bathroom, along with a bonus room just off the kitchen—perfect for a home office, dining area, or additional living space. Upstairs, you’ll find three additional bedrooms and a full bathroom. Whether you're looking for your next home or an investment opportunity, this property offers great potential. Conveniently located near shopping, dining, and major roadways for easy commuting. Contact your preferred real estate professional to schedule you
Key facts
- Bonus room
- First floor bedroom
- 6,599 sq ft lot
Tags
Property features AI
Exterior
- Parking: Driveway
- Utilities: Public water; Public sewer
- Home design: Two-story house; Updated/remodeled condition; Above-grade finished living area reported
- Construction: Aluminum and vinyl siding; Asphalt shingle roof; Concrete perimeter foundation; Built (year per public records)
- Exterior features: Shed(s)
Interior
- Kitchen: Range; Refrigerator
- Bedrooms: One main-level bedroom
- Bathrooms: One full bathroom; One half bathroom; One main-level bathroom
- Heating & cooling: Forced-air heating
- Interior features: ENERGY STAR qualified windows; Unfinished basement
- Laundry & utility: Laundry in the basement
Neighborhood map
What this means for you Summary
Snapshot
- This is a 4-bed/1.5-bath single-family listed at $125k.
Deal economics
- At list price, monthly cash flow is $90 ($1k/yr) — positive.
- The deal already cash-flows at list — no discount required.
- Meets the 1% rule at list price ($1k rent vs $125k).
- Recommended offer: $121k (3.0% below list) — sets the bar for market timing.
Location & tenants
- Location reads 81/100 on livability (#104 in OH, #1,591 nationally) — a professional / high-income tenant draw. Strengths: amenities A+, commute A+, cost of living A+; Watch: crime F, employment F.
- Akron City (urban): math 22% / reading 30% proficiency, ranked #602 of 656 in OH (top 92%) — low school quality limits family demand, transient renter base, plan for 1-2y turnover; 66% free/reduced lunch — lower-income household profile, screen leases tightly.
- Market conditions: Rents rising (+1.6%/yr); 102 active listings in the ZIP; 29 comparable units currently listed for rent nearby; rentals lingering (median 44d on market — plan ~5-8 weeks vacancy on turnover, expect pricing pressure); 52% of comp listings sitting > 30 days — soft ceiling on asking rent; lower-income renter base — watch delinquency; 1,114 units permitted in Summit County in 2024 (397 in 5+ unit buildings).
- This rent runs 37% of the median local income ($41k/yr) — at the standard rent-burdened threshold; future hikes will face affordability resistance.
Forward outlook
- Local home prices are declining (-3.0%/yr); year-one equity from $864 of loan paydown is wiped out by about $4k of value loss. Plan a longer hold.
- Summit County population projected to shrink 6% by 2050 — rents likely to lag national; underwrite the cash flow, not the appreciation.
Negotiation context
- It's been on market 41 days — a 3% lower offer ($121k) is reasonable based on typical stale-listing flexibility.
- 2 sale attempts; this cycle's ask has dropped $10k (7%) from the opening price — seller is motivated, your offer sets the floor, not the list.
Risks & watch-outs
- Watch-outs: built in 1944 — expect roof / HVAC / electrical / plumbing capex.
Questions for the listing agent
- It's been on market 41 days. Have you received any prior offers? Is the seller open to a 3% concession, seller financing, or rate buy-down credit?
- Built in 1944 — when were the roof, HVAC, electrical panel, plumbing, and water heater last replaced?
- Is there a deadline driving the sale (1031 exchange, divorce, estate, relocation)? That informs how much negotiation room exists.
- Crime grade is F in this area — have there been break-ins, vandalism, or insurance claims at this property in the last 3 years? What carrier currently insures it and at what premium?
- What's the average days-on-market for RENTAL listings here right now (not sales)? A rising rental-DOM trend means longer vacancies and softer asking-rent achievability than the comps imply.
- What's the recent tenant-quality profile in this submarket — average credit score on applications, eviction rate, late-payment / NSF rate, and stable-employment percentage? A property-management company in the area should have these aggregated.
- How much new for-sale + rental construction is in the pipeline within 1–3 miles? Heavy new supply typically softens prices + rents 12–24 months out; constrained supply supports both.
Investment metrics
- 1% rule
- 1.03% ✓
- Cap rate
- 7.16%
- Cash-on-cash
- 3.09%
- DSCR
- 1.14
- GRM
- 8.1
CMA / ARV
- ARV (median comp)
- $139,305
- List price
- $125,000
- Delta
- -10.27%
- Verdict
- UNDERPRICED
- Comps
- 20 within 1.0 mi
Show comp detail 12 sales within ~0.75 mi
| Address | Dist | Beds/Ba | Sqft | Sold | Price | $/sf | Match |
|---|---|---|---|---|---|---|---|
| 1037 Hardesty Blvd | 0.19mi | 3/1.0 (-1) | 1,109 (-11%) | 1mo | $98,000 | $88 | 65 |
| 1024 Roslyn Ave | 0.22mi | 3/1.5 (-1) | 1,100 (-12%) | 6mo | $152,000 | $138 | 61 |
| 761 Glendora Ave | 0.59mi | 3/1.0 (-1) | 1,210 (-3%) | 3mo | $60,000 | $50 | 59 |
| 1194 Diagonal Rd | 0.58mi | 3/1.0 (-1) | 1,295 (+4%) | 4mo | $48,650 | $38 | 56 |
| 861 Glenn St | 0.56mi | 3/2.0 (-1) | 1,300 (+4%) | 5mo | $157,000 | $121 | 55 |
| 1352 Diagonal Rd | 0.59mi | 3/1.0 (-1) | 1,200 (-4%) | 5mo | $108,500 | $90 | 55 |
| 1255 Dover Ave | 0.47mi | 3/1.0 (-1) | 1,383 (+11%) | 3mo | $150,000 | $108 | 50 |
| 1041 Diagonal Rd | 0.72mi | 3/1.5 (-1) | 1,332 (+7%) | 3mo | $30,000 | $23 | 47 |
| 1042 Frederick Blvd | 0.43mi | 3/1.0 (-1) | 1,091 (-12%) | 7mo | $110,000 | $101 | 46 |
| 801 Storer Ave | 0.58mi | 4/1.0 | 1,423 (+14%) | 3mo | $72,500 | $51 | 44 |
| 615 Noah Ave | 0.64mi | 3/1.5 (-1) | 1,418 (+14%) | 2mo | $158,000 | $111 | 40 |
| 636 Noble Ave | 0.66mi | 3/2.0 (-1) | 1,388 (+12%) | 5mo | $52,000 | $37 | 38 |
Match score weights: distance 35% · size 25% · config 20% · recency 20%. Top-matched comps best support the ARV.
Projected returns pro-forma
-3.0% appreciation · 1.65% rent growth · sell at horizon
- IRR
- -13.0%
- Equity multiple
- 0.54×
- Total profit
- $-16,175
- Equity at exit
- $18,638
- IRR
- -6.3%
- Equity multiple
- 0.62×
- Total profit
- $-13,326
- Equity at exit
- $10,808
Cash invested: $35,000 (down + closing). Projections, not guarantees.
Landlord ↔ Tenant lean methodology
- Overall (STATE)
- 73 Landlord-Friendly
- State Ohio
- 73 Landlord-Friendly · R+6
- County
- — inherits STATE
- City
- — inherits STATE
ZIP-level market 44320
- Rents YoY
- 1.6%
- Active inventory
- 102
- Price-to-rent
- 8.1×
Monthly cashflow live
- Estimated rent
- $1,282 high interval (Pro) →
- Mortgage (P&I)
- −$656
- Tax from tax record
- −$215 /mo · $2,577/yr
- Insurance
- −$52
- HOA
- −$0
- Vacancy / Maint / Mgmt
- −$269
- Net cashflow
- $90
Break-even live
UW: 25.0% down · 7.5% · 30yr · 1.5% tax · 5.0% vac · 8.0% maint · 8.0% mgmt
Financing live
Cash to close
- Down payment
- $31,250
- Closing costs
- $3,750
- Reserves months
- —
- Total cash needed
- —
Loan-product check · same deal, 3 products live
Conventional
25% down · 7.5% · 30yr
- Down + closing
- —
- Monthly P&I
- —
- Monthly cashflow
- —
- DSCR
- —
- Eligible?
- —
Personal DTI + credit; lowest rate.
DSCR
20% down · 8.5% · 30yr
- Down + closing
- —
- Monthly P&I
- —
- Monthly cashflow
- —
- DSCR
- —
- Eligible?
- —
No personal income docs; deal must DSCR.
Hard money
10% down · 12.0% · 12mo
- Down + closing
- —
- Monthly P&I
- —
- Monthly cashflow
- —
- DSCR
- —
- Eligible?
- —
Short-term bridge; refi at stabilization.
Rent comps 29 comps
| Address | Beds | Baths | Sqft | Rent | $/sqft | DOM | Units | Dist |
|---|---|---|---|---|---|---|---|---|
| 1090 Hartford Ave Akron, OH | 4.0 | 1.0 | 1328 | $1,125 | $0.85 | 43d | 1 | 0.08mi |
| 1161 Seward Ave Akron, OH | 3.0 | 1.5 | 1000 | $1,200 | $1.20 | 14d | 1 | 0.29mi |
| 1331 Thurston St Unit 1326 Akron, OH | 3.0 | 1.0 | 900 | $925 | $1.03 | 43d | 1 | 0.29mi |
| 1326 Thurston St Unit 1326 Akron, OH | 3.0 | 1.0 | 900 | $925 | $1.03 | 23d | 1 | 0.30mi |
| 1328 Thurston St Unit 1328 Akron, OH | 3.0 | 1.0 | 900 | $925 | $1.03 | 23d | 1 | 0.30mi |
| 1092 Peerless Ave Akron, OH | 3.0 | 1.0 | 998 | $1,200 | $1.20 | 43d | 1 | 0.42mi |
| 1040 Mercer Ave Akron, OH | 3.0 | 1.0 | 850 | $1,400 | $1.65 | 21d | 1 | 0.46mi |
| 1494 Diagonal Rd Akron, OH | 3.0 | 1.0 | 1064 | $1,495 | $1.41 | 43d | 1 | 0.57mi |
| 961 Lawton St Akron, OH | 3.0 | 1.0 | 1144 | $1,450 | $1.27 | 14d | 1 | 0.58mi |
| 730 Noble Ave Akron, OH | 3.0 | 1.0 | 1092 | $1,200 | $1.10 | 23d | 1 | 0.61mi |
| 575 Noble Ave Akron, OH | 3.0 | 1.0 | 1300 | $1,350 | $1.04 | 14d | 1 | 0.72mi |
| 1047 Yukon Ave Akron, OH | 3.0 | 1.0 | 966 | $995 | $1.03 | 21d | 1 | 0.75mi |
| 637 Storer Ave Akron, OH | 3.0 | 1.5 | 1322 | $1,250 | $0.95 | 14d | 1 | 0.76mi |
| 783 Leonard St Akron, OH | 3.0 | 1.0 | 1040 | $1,250 | $1.20 | 43d | 1 | 0.76mi |
| 844 Lawton St Akron, OH | 4.0 | 2.0 | 1240 | $1,175 | $0.95 | 43d | 1 | 0.78mi |
| 991 Diana Ave Akron, OH | 3.0 | 2.0 | 1264 | $1,325 | $1.05 | 43d | 1 | 0.80mi |
| 601 Glendora Ave Akron, OH | 3.0 | 1.0 | 1310 | $1,200 | $0.92 | 43d | 1 | 0.89mi |
| 1032 Andrew St Akron, OH | 3.0 | 1.0 | 960 | $1,097 | $1.14 | 43d | 1 | 0.97mi |
| 295 Noble Ave Akron, OH | 3.0 | 2.5 | 1488 | $1,600 | $1.08 | 43d | 1 | 1.08mi |
| 321 Grace Ave Akron, OH | 3.0 | 2.0 | 1484 | $1,175 | $0.79 | 14d | 1 | 1.11mi |
| 924 Hamlin St Akron, OH | 3.0 | 1.0 | 1106 | $1,300 | $1.18 | 43d | 1 | 1.14mi |
| 677 Crossings Ln Akron, OH | 3.0 | 2.5 | 1440 | $1,950 | $1.35 | 23d | 1 | 1.15mi |
| 918 Bye St Akron, OH | 3.0 | 1.0 | 1248 | $1,200 | $0.96 | 43d | 1 | 1.19mi |
| 685 Longview Ave Akron, OH | 3.0 | 1.0 | 1100 | $1,150 | $1.05 | 43d | 1 | 1.22mi |
| 1313 Manchester Rd Akron, OH | 3.0 | 1.0 | 1221 | $1,200 | $0.98 | 21d | 1 | 1.27mi |
| 1161 La Croix Ave Akron, OH | 3.0 | 1.0 | 1452 | $1,200 | $0.83 | 23d | 1 | 1.33mi |
| 1859 Delia Ave Akron, OH | 3.0 | 1.0 | 1040 | $1,395 | $1.34 | 21d | 1 | 1.39mi |
| 1142 Jefferson Ave Unit 2 Akron, OH | 3.0 | 1.0 | 1200 | $1,150 | $0.96 | 43d | 1 | 1.45mi |
| 378 Trigonia Dr Akron, OH | 3.0 | 1.5 | 1090 | $1,200 | $1.10 | 43d | 1 | 1.47mi |
Listing history 20 events
-
2026-06-18days on market $125,000 Active 41 DOM
-
2026-06-17days on market $125,000 Active 40 DOM
-
2026-06-16days on market $125,000 Active 39 DOM
-
2026-06-15days on market $125,000 Active 38 DOM
-
2026-06-14days on market $125,000 Active 36 DOM
-
2026-06-13days on market $125,000 Active 35 DOM
-
2026-06-10days on market $125,000 Active 33 DOM
-
2026-06-09days on market $125,000 Active 32 DOM
-
2026-06-08days on market $125,000 Active 31 DOM
-
2026-06-07days on market $125,000 Active 30 DOM
-
2026-06-05days on market $125,000 Active 27 DOM
-
2026-06-03pricedays on market $125,000 Active 26 DOM
-
2026-06-02days on market $134,900 Active 25 DOM
-
2026-06-01days on market $134,900 Active 24 DOM
-
2026-05-31days on market $134,900 Active 23 DOM
-
2026-05-31days on market $134,900 Active 22 DOM
-
2026-05-09$134,900 Active 715-char remark
-
2026-05-01historical
-
2026-04-08$134,900 Active
-
2022-04-13soldstatus $125,000
ⓘ Source: listings_history table (triggers on properties + properties_extension) + one-shot
backfill from property_details.listing_events for pre-trigger history.
Tax reassessment forecast OH · Partial reset (capped growth)
- Current annual tax
- $2,577 · $215/mo
- Projected year-2 tax
- $2,577 · $215/mo
- Expected delta
- $0/yr ($0/mo · 0.0%)
ⓘ Screening estimate from a state-policy table — verify with the county assessor before closing.
Climate risk First Street
- Flood 1/10 Low FEMA zone X (unshaded) · 0% chance over 30 yrs
- Wildfire 1/10 Low
- Heat 3/10 Moderate 7 d/yr ≥97°F today · 17 d/yr by 30 yrs out
- Wind 1/10 Low
- Air quality 2/10 Low 1 unhealthy d/yr today · 2 by 30 yrs out
Nearby sold comps map
Loading sold comps map…
Walkable amenities ~0.75 mi
Loading nearby amenities…
Taxation est. · year 1
- Rental income
- $15,381
- − Mortgage interest
- −$7,002
- − Property taxes
- −$2,577
- − Insurance
- −$625
- − Repairs & maintenance
- −$1,230
- − Management
- −$1,230
- − Depreciation
- −$3,636
- Taxable loss
- −$921
- Est. tax savings @ 24.0%
- +$221
- After-tax cash flow
- $1,303/yr
For passive investors: Depreciation is non-cash, so a rental often shows a tax loss while cash-flowing — sheltering income. Rental losses are passive: they offset passive income freely, and up to $25,000/yr can offset ordinary (W-2) income if you actively participate and your MAGI is under $100k (phasing out to $0 by $150k); unused losses carry forward. On sale, claimed depreciation is recaptured at up to 25%, and gains may owe capital-gains tax (a 1031 exchange can defer both). Figures are a year-1 estimate at your 24.0% rate — not tax advice; consult a CPA.
Schools (NCES district)
- District
- Akron City
- NCES district ID
- 3904348
- Math proficiency
- 22% ▼ -17.00%
- Reading proficiency
- 30% ▼ -12.00%
- Median HH income
- $33,811
- Composite
- 21.31/100
- National rank
- #8383
- State rank
- #602 of 656 in OH
Livability — Akron
- Score
- 81/100
- State rank
- #104
- US rank
- #1591
Category grades
Schools grade is shown separately in the Schools card above.
Census & demographics
- Census place
- Akron, OH
- County
- Summit County · 440,783 people
- City population
- 174,375
- Metro
- Akron, OH
- Population (ZIP)
- 17,690
- Household income
- $41,241
- Rent vs Own
- Severe rent burden
- 1316.0
Population outlook (Summit County) Hauer SSP2
- Today (2025)
- 546,583 people
- By 2030
- 544,028 · -0.5%
- By 2040
- 531,363 · -2.8%
- By 2050
- 514,923 · -5.8%
- By 2075
- 481,765 · -11.9%
- By 2100
- 432,265 · -20.9%
Race, ethnicity, and origin ACS 2023
- Neighborhood character
- Majority Black (63%)
- Race & ethnicity
- Black 63% White 27% Two or more races 7% Hispanic / Latino 4%
- Common ancestry
- Romanian 2% Italian 1% Scotch-Irish 1%
- Foreign-born
- 2% · Canada
- Languages at home
- 97% English-only · Spanish 1% Other Indo-European 1%
Political lean MEDSL · Summit
- 2024 margin
- Lean D (+7.0) · D 53.0% · R 46.0%
- 2008→2024 swing
- -9.6pp toward R · 2008: 16.6pp · 2024: 7.0pp
- All cycles
- 2024: D+7.0 2020: D+9.6 2016: D+8.2 2012: D+14.8 2008: D+16.6
Not yet ingested
- Civics
- —
Market trends
- HPI YoY
- ▼ -117.69%
- Current HPI
- 122.9888
- Rent YoY
- ▲ 1.65%
- Metro
- Akron, OH
- State GDP YoY
- ▲ 1.98%
- F500 in state
- 48
Industry mix (Fortune 500 HQ in OH)
| Industry | F500 HQs | Revenue |
|---|---|---|
| Insurance | 3 | $145B |
|
||
| Industrial Machinery | 3 | $49B |
|
||
| Financial Services | 3 | $24B |
|
||
| Consumer Goods | 2 | $93B |
|
||
| Aerospace / Defense | 2 | $47B |
|
||
| Utilities | 2 | $33B |
|
||
Price history
+0.0% since first listed5 events — show timeline
- 2026-06-03 Price Changed $125,000 MLSNOW
- 2026-05-09 Listed $134,900 MLSNOW
- 2026-05-01 Listing Removed — MLSNOW
- 2026-04-08 Listed $134,900 MLSNOW
- 2022-04-13 Sold (Public Records) $125,000 Public Records
Property tax history
+6.5%/yrLatest (2025): $2,577 · +0.2% YoY. Source: county tax records.
Cash-flow waterfall
monthlySold comps — $/sqft
last 12 mo · ≤1 miLoading sold comps…