285 Hope Orchards Dr · Lavon, TX
Flood risk No data
- FEMA flood zone
- —
- Chance of flooding over 30 yrs
- —
- Est. flood insurance / yr
- —
Fire risk No data
- Est. fire insurance / yr
- —
Heat risk No data
- Hot days now (above threshold)
- —
- Hot days in 30 yrs
- —
Wind risk No data
- Chance of severe wind over 30 yrs
- —
Air-quality risk No data
- Unhealthy air days now
- —
- Unhealthy air days in 30 yrs
- —
Risk factors via First Street. Map © Google.
Why this score? — see what drove the F grade
The composite is a weighted blend of 9 inputs, each scored 0–100. Each bar is that input's sub-score; the figure is the points it added to the 100-point composite (weight × sub-score).
- Cash flow +10.8/30.0
- ARV discount +5.6/15.0
- 1% rule +3.8/10.0
- Livability +3.3/5.0
- Schools +3.2/10.0
- DSCR +3.1/10.0
- Rent growth +2.5/5.0
- Condition / age +2.5/5.0
- Appreciation +0.0/10.0
$329,990
🖨 Deal sheet (PDF) 📄 Offer letter ✓ Due diligence
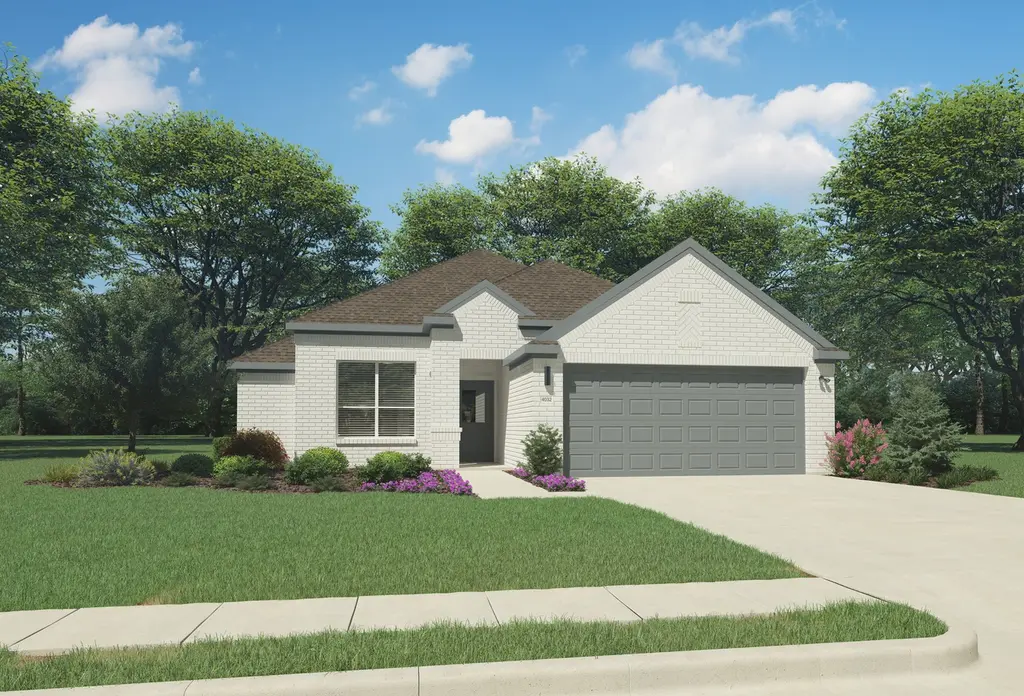
Listing remarks
The Emmy II boasts an expansive main living area with a gourmet island kitchen, beautiful living room and snug dining area. The addition of a covered patio amplifies your entertaining space, so be sure to add a bistro table and chairs for morning cappuccino al fresco with neighbors. Three secondary bedrooms offer private space but can flex into the ultimate hobby room, yoga spot or home office!
Key facts
- Hobby room
- Covered patio
- Private space
Tags
Property features AI
Finance
- Other: List price $329,990; Address: 285 Hope Orchards Dr, Lavon, TX 75166
- HOA & community: Association fee: $155
Exterior
- Parking: 2 garage spaces; 2 total parking spaces
- Home design: Single-family home; Active listing
- Exterior features: 1,800 living area
Interior
- Bedrooms: 5 bedrooms
- Bathrooms: 4 full bathrooms
- Interior features: Spec home (new construction inventory)
Neighborhood map
What this means for you Summary
Snapshot
- This is a 5-bed/4.0-bath single-family listed at $330k.
Deal economics
- At list price, monthly cash flow is $-151 ($-2k/yr) — negative.
- To cash-flow at today's rent, offer at most $308k (6.6% below list).
- To meet the 1% rule (rent ≥ 1% of price), the offer needs to be $289k (12.4% below list).
- Recommended offer: $289k (12.4% below list) — sets the bar for 1% rule.
- Cap rate 5.7% vs local median 4.5% in Lavon — meaningfully above typical; check what's discounted (condition, days-on-market, listing class) to confirm the premium yield is real.
Location & tenants
- Location reads 66/100 on livability (#588 in TX) — a middle-class / working-renter tenant base. Strengths: employment A+, housing A+, cost of living B; Watch: amenities F, commute F, health & safety F.
- Community ISD (rural): math 30% / reading 38% proficiency, ranked #479 of 826 in TX (top 58%) — families likely to look elsewhere, expect single-tenant / working-renter base with shorter leases.
- Zoned schools: Leland E Edge Middle (math 25% / reading 35%, grade F, #1,056 of 1,662 statewide, top 65%, 931 students, 53% FRL) — zoned schools average 53% FRL vs 36% district-wide (18 pts higher); higher-poverty schools than district average — tighter screening recommended.
- Market conditions: 642 active listings in the ZIP; 11 comparable units currently listed for rent nearby; rentals at typical pace (median 28d on market — plan ~3-4 weeks tenant-placement turnaround); 45% of comp listings sitting > 30 days — soft ceiling on asking rent; high-income renter base; 19,194 units permitted in Collin County in 2024 (3,988 in 5+ unit buildings).
Forward outlook
- Local home prices are declining (-3.0%/yr); year-one equity from $2k of loan paydown is wiped out by about $10k of value loss. Plan a longer hold.
- Collin County population projected at +60% by 2050 — long-run rental-demand tailwind backs the buy-and-hold thesis.
Negotiation context
- Only 10 days on market — expect competitive offers; lowballing is unlikely to land.
Questions for the listing agent
- What do current leases actually rent for vs. the listed asking? Can we see a recent rent roll and the last 12 months of T-12 income?
- What does the HOA fee cover, when was the last increase, and are there any pending special assessments or reserve-fund shortfalls?
- Is there a deadline driving the sale (1031 exchange, divorce, estate, relocation)? That informs how much negotiation room exists.
- The area grade is low — what's the realistic commute time and amenity access for the typical tenant pool here? Any planned neighborhood developments (good or bad) we should know about?
- What's the average days-on-market for RENTAL listings here right now (not sales)? A rising rental-DOM trend means longer vacancies and softer asking-rent achievability than the comps imply.
- What's the recent tenant-quality profile in this submarket — average credit score on applications, eviction rate, late-payment / NSF rate, and stable-employment percentage? A property-management company in the area should have these aggregated.
- How much new for-sale + rental construction is in the pipeline within 1–3 miles? Heavy new supply typically softens prices + rents 12–24 months out; constrained supply supports both.
Investment metrics
- 1% rule
- 0.88% ✗
- Cap rate
- 5.74%
- Cash-on-cash
- -1.96%
- DSCR
- 0.91
- GRM
- 9.5
CMA / ARV
- ARV (on-the-fly)
- $316,800
- Comps found
- 12
Show comp detail 12 sales within ~0.75 mi
| Address | Dist | Beds/Ba | Sqft | Sold | Price | $/sf | Match |
|---|---|---|---|---|---|---|---|
| 1149 Little Hills Way | 0.28mi | 4/2.0 (-1) | 1,791 (-0%) | 2mo | $314,990 | $176 | 71 |
| 1119 Little Hills Way | 0.25mi | 4/2.0 (-1) | 1,791 (-0%) | 6mo | $289,990 | $162 | 70 |
| 264 Bright Alcove Ct | 0.05mi | 4/2.0 (-1) | 1,889 (+5%) | 9mo | $339,990 | $180 | 69 |
| 216 Hope Orchards | 0.17mi | 4/2.0 (-1) | 1,861 (+3%) | 6mo | $359,000 | $193 | 68 |
| 1160 Little Hills Way | 0.31mi | 4/2.0 (-1) | 1,809 (+0%) | 4mo | $309,990 | $171 | 68 |
| 755 Grand Dale Dr | 0.32mi | 4/2.0 (-1) | 1,837 (+2%) | 1mo | $349,990 | $191 | 68 |
| 226 Twin View Vista Dr | 0.20mi | 4/2.0 (-1) | 1,866 (+4%) | 4mo | $339,990 | $182 | 68 |
| 251 Bright Alcove Ct | 0.10mi | 4/2.0 (-1) | 1,866 (+4%) | 13mo | $352,900 | $189 | 66 |
| 788 Grand Dale Dr | 0.24mi | 4/2.0 (-1) | 2,029 (+13%) | 2mo | $344,990 | $170 | 53 |
| 716 Tawny Turn | 0.46mi | 4/2.0 (-1) | 1,934 (+7%) | 10mo | $329,990 | $171 | 45 |
| 193 Gracefly Sage Ln | 0.44mi | 4/2.5 (-1) | 2,068 (+15%) | 4mo | $319,990 | $155 | 40 |
| 156 Gracefly Sage Ln | 0.52mi | 4/2.5 (-1) | 2,068 (+15%) | 6mo | $309,990 | $150 | 35 |
Match score weights: distance 35% · size 25% · config 20% · recency 20%. Top-matched comps best support the ARV.
Projected returns pro-forma
-3.0% appreciation · 3.0% rent growth · sell at horizon
- IRR
- -19.5%
- Equity multiple
- 0.32×
- Total profit
- $-62,950
- Equity at exit
- $49,203
- IRR
- -12.1%
- Equity multiple
- 0.28×
- Total profit
- $-66,633
- Equity at exit
- $28,532
Cash invested: $92,397 (down + closing). Projections, not guarantees.
Landlord ↔ Tenant lean methodology
- Overall (STATE)
- 87 Strongly Landlord-Friendly
- State Texas
- 87 Strongly Landlord-Friendly · R+5
- County
- — inherits STATE
- City
- — inherits STATE
ZIP-level market 75166
- Home prices YoY
- -9.9%
- Active inventory
- 642
- Price-to-rent
- 9.5×
Monthly cashflow live
- Estimated rent
- $2,892 high interval (Pro) →
- Mortgage (P&I)
- −$1,731
- Tax est. 1.5%
- −$412 /mo · $4,950/yr
- Insurance
- −$137
- HOA
- −$155
- Lot rent
- −$0
- Vacancy / Maint / Mgmt
- −$607
- Net cashflow
- $-151
Break-even live
Sensitivity live
| Price | -10% $77 | -5% $-37 | +0% $-151 | +5% $-265 | +10% $-379 |
|---|---|---|---|---|---|
| Rent | -10% $-379 | -5% $-265 | +0% $-151 | +5% $-37 | +10% $77 |
| Rate | -1.0pp $15 | -0.5pp $-67 | base $-151 | +0.5pp $-236 | +1.0pp $-323 |
UW: 25.0% down · 7.5% · 30yr · 1.5% tax · 5.0% vac · 8.0% maint · 8.0% mgmt
Financing live
Cash to close
- Down payment
- $82,498
- Closing costs
- $9,900
- Reserves months
- —
- Total cash needed
- —
Loan-product check · same deal, 3 products live
Conventional
25% down · 7.5% · 30yr
- Down + closing
- —
- Monthly P&I
- —
- Monthly cashflow
- —
- DSCR
- —
- Eligible?
- —
Personal DTI + credit; lowest rate.
DSCR
20% down · 8.5% · 30yr
- Down + closing
- —
- Monthly P&I
- —
- Monthly cashflow
- —
- DSCR
- —
- Eligible?
- —
No personal income docs; deal must DSCR.
Hard money
10% down · 12.0% · 12mo
- Down + closing
- —
- Monthly P&I
- —
- Monthly cashflow
- —
- DSCR
- —
- Eligible?
- —
Short-term bridge; refi at stabilization.
Rent comps 11 comps
| Address | Beds | Baths | Sqft | Rent | $/sqft | DOM | Units | Dist |
|---|---|---|---|---|---|---|---|---|
| 257 Hope Orchards Dr Lavon, TX | 4.0 | 3.0 | 2164 | $2,500 | $1.16 | 0d | 1 | 0.04mi |
| 759 Gentle Bird Dr Lavon, TX | 4.0 | 2.5 | 2400 | $2,900 | $1.21 | 27d | 1 | 0.47mi |
| 344 Cyprus Grove Dr Lavon, TX | 4.0 | 3.0 | 2353 | $2,600 | $1.10 | 27d | 1 | 1.00mi |
| 860 Moonwake Dr Lavon, TX | 4.0 | 2.5 | 2011 | $2,800 | $1.39 | 46d | 1 | 1.06mi |
| 544 Oak Creek Dr Lavon, TX | 4.0 | 2.0 | 1800 | $2,150 | $1.19 | 21d | 1 | 1.06mi |
| 358 Rockstream Dr Lavon, TX | 4.0 | 3.0 | 2201 | $2,395 | $1.09 | 27d | 1 | 1.22mi |
| 383 Silver Springs Ln Lavon, TX | 4.0 | 3.0 | 2466 | $2,500 | $1.01 | 46d | 1 | 1.26mi |
| 269 Sunshine Ln Lavon, TX | 4.0 | 3.0 | 2072 | $2,700 | $1.30 | 46d | 1 | 1.27mi |
| 361 Silver Springs Ln Lavon, TX | 4.0 | 3.0 | 2466 | $2,295 | $0.93 | 46d | 1 | 1.27mi |
| 117 Community Dr Lavon, TX | 4.0 | 3.5 | 2356 | $2,600 | $1.10 | 27d | 1 | 1.28mi |
| 239 Tallgrass Dr Lavon, TX | 5.0 | 3.0 | 2394 | $3,500 | $1.46 | 46d | 1 | 1.28mi |
HOA detail
- Monthly dues
- $155 · $1,860/yr
Listing history 8 events
-
2026-06-22days on market $329,990 Active 10 DOM
-
2026-06-21days on market $329,990 Active 9 DOM
-
2026-06-18days on market $329,990 Active 6 DOM
-
2026-06-17days on market $329,990 Active 5 DOM
-
2026-06-16days on market $329,990 Active 4 DOM
-
2026-06-15days on market $329,990 Active 3 DOM
-
2026-06-13remarks 397-char remark
-
2026-06-13$329,990 Active 1 DOM
ⓘ Source: listings_history table (triggers on properties + properties_extension) + one-shot
backfill from property_details.listing_events for pre-trigger history.
Nearby sold comps map
Loading sold comps map…
Walkable amenities ~0.75 mi
Loading nearby amenities…
Taxation est. · year 1
- Rental income
- $34,701
- − Mortgage interest
- −$18,485
- − Property taxes
- −$4,950
- − Insurance
- −$1,650
- − Repairs & maintenance
- −$2,776
- − Management
- −$2,776
- − HOA
- −$1,860
- − Depreciation
- −$9,600
- Taxable loss
- −$7,395
- Est. tax savings @ 24.0%
- +$1,775
- After-tax cash flow
- $-37/yr
For passive investors: Depreciation is non-cash, so a rental often shows a tax loss while cash-flowing — sheltering income. Rental losses are passive: they offset passive income freely, and up to $25,000/yr can offset ordinary (W-2) income if you actively participate and your MAGI is under $100k (phasing out to $0 by $150k); unused losses carry forward. On sale, claimed depreciation is recaptured at up to 25%, and gains may owe capital-gains tax (a 1031 exchange can defer both). Figures are a year-1 estimate at your 24.0% rate — not tax advice; consult a CPA.
Schools (NCES district)
- District
- Community ISD
- NCES district ID
- 4814850
- Math proficiency
- 30% ▼ -23.00%
- Reading proficiency
- 38% ▼ -11.00%
- Median HH income
- $71,841
- Composite
- 31.58/100
- National rank
- #5951
- State rank
- #479 of 826 in TX
Livability — Lavon
- Score
- 66/100
- State rank
- #588
- US rank
- #11230
Category grades
Schools grade is shown separately in the Schools card above.
Census & demographics
- County
- Collin County · 1,159,394 people
- City population
- 6,989
- Metro
- Dallas-Fort Worth-Arlington, TX
- Population (ZIP)
- 6,989
- Household income
- $132,101
- Rent vs Own
- Severe rent burden
- 41.0
Population outlook (Collin County) Hauer SSP2
- Today (2025)
- 1,210,074 people
- By 2030
- 1,358,201 · +12.2%
- By 2040
- 1,654,061 · +36.7%
- By 2050
- 1,937,359 · +60.1%
- By 2075
- 2,567,039 · +112.1%
- By 2100
- 2,952,048 · +144.0%
Race, ethnicity, and origin ACS 2023
- Neighborhood character
- Diverse neighborhood (Simpson 0.63)
- Race & ethnicity
- White 55% Hispanic / Latino 24% Two or more races 15% Black 7% Asian 4% Native American 2% Pacific Islander 1%
- Hispanic origin (detail)
- Mexican 15% Puerto Rican 3%
- Common ancestry
- Slovak 2% Serbian 2% Lithuanian 2%
- Foreign-born
- 8% · Canada
- Languages at home
- 84% English-only · Spanish 11% Other Indo-European 3% Arabic 1%
Political lean MEDSL · Collin
- 2024 margin
- R (+11.1) · D 43.1% · R 54.3% · Other 2.6%
- 2008→2024 swing
- +14.4pp toward D · 2008: -25.6pp · 2024: -11.1pp
- All cycles
- 2024: R+11.1 2020: R+4.3 2016: R+17.0 2012: R+31.6 2008: R+25.6
Not yet ingested
- Civics
- —
Market trends
- HPI YoY
- ▼ -24.22%
- Current HPI
- 221.0
- Rent YoY
- —
- Metro
- Dallas-Fort Worth-Arlington, TX
- State GDP YoY
- ▲ 3.95%
- F500 in state
- 110
Industry mix (Fortune 500 HQ in TX)
| Industry | F500 HQs | Revenue |
|---|---|---|
| Energy | 16 | $1,198B |
|
||
| Technology | 5 | $198B |
|
||
| Engineering / Construction | 4 | $72B |
|
||
| Energy Services | 3 | $60B |
|
||
| Utilities | 3 | $41B |
|
||
| Healthcare | 2 | $330B |
|
||
Cash-flow waterfall
monthlySold comps — $/sqft
last 12 mo · ≤1 miLoading sold comps…