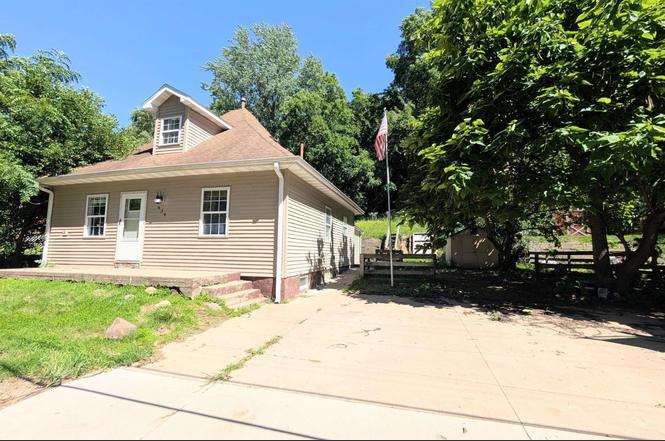
434 Wesley Rd · Creve Coeur, IL
Flood risk 1/10 · Minimal
- FEMA flood zone
- X (unshaded)
- Chance of flooding over 30 yrs
- 0.0%
- Est. flood insurance / yr
- $473 – $860
Fire risk 1/10 · Minimal
- Est. fire insurance / yr
- $804 – $1,492
Heat risk 3/10 · Minor
- Hot days now (above 105°F)
- 7 days/yr
- Hot days in 30 yrs
- 18 days/yr
Wind risk 2/10 · Minimal
- Chance of severe wind over 30 yrs
- 1.0%
Air-quality risk 3/10 · Minor
- Unhealthy air days now
- 1 days/yr
- Unhealthy air days in 30 yrs
- 3 days/yr
Risk factors via First Street. Map © Google.
Why this score? — see what drove the B grade
The composite is a weighted blend of 9 inputs, each scored 0–100. Each bar is that input's sub-score; the figure is the points it added to the 100-point composite (weight × sub-score).
- Cash flow +30.0/30.0
- ARV discount +15.0/15.0
- 1% rule +10.0/10.0
- DSCR +10.0/10.0
- Livability +3.2/5.0
- Rent growth +2.5/5.0
- Condition / age +2.5/5.0
- Schools +1.5/10.0
- Appreciation +0.0/10.0
$79,900
🖨 Deal sheet 📄 Offer letter ✓ Due diligence
Listing remarks
This is a lot of square foot for the money. Sits on a double lot. The cosmetics need a little love but all the big ticket items are newer. Roof, driveway, gutters/gutter guards, and siding new in 2014. HVAC and water heater 2021. Updated panel and windows, exact age unknown. This home is being sold As Is.
Key facts
- New siding
- New hvac
- New driveway
Tags
Property features AI
Exterior
- Parking: Parking pad (no garage)
- Utilities: Public water; Public sewer
- Home design: Single-family residence; Built in 1898
- Construction: Shingle roof; Original construction (not new)
- Exterior features: Shed(s); Replacement windows; Level to sloped lot
Interior
- Kitchen: Kitchen on main level (approx. 13 x 9, hardwood flooring)
- Bedrooms: 3 bedrooms; Primary bedroom on upper level (approx. 18 x 14, vinyl flooring, egress window); Second bedroom on main level (approx. 17 x 11, other flooring, egress window); Third bedroom on main level (approx. 12 x 12, carpet, no egress window)
- Flooring: Vinyl; Carpet; Hardwood; Other (in one bedroom)
- Bathrooms: 1 full bathroom
- Heating & cooling: Forced air heating; Central air conditioning
- Interior features: Attic storage; Ceiling fans; Has basement (crawl space, partial, partially finished)
- Laundry & utility: Main-level laundry room (approx. 8 x 7)
Neighborhood map
What this means for you Summary
Snapshot
- This is a 2-bed/1.0-bath single-family listed at $80k.
Deal economics
- At list price, monthly cash flow is $516 ($6k/yr) — positive.
- The deal already cash-flows at list — no discount required.
- Meets the 1% rule at list price ($1k rent vs $80k).
Location & tenants
- Location reads 63/100 on livability (#755 in IL) — a middle-class / working-renter tenant base. Strengths: cost of living A+, housing A-; Watch: employment D, amenities F, commute F.
- East Peoria Chsd 309 (suburban): math 17% / reading 15% proficiency, ranked #482 of 620 in IL (top 78%) — low school quality limits family demand, transient renter base, plan for 1-2y turnover.
- Zoned schools: East Peoria High School (math 17% / reading 15%, grade F, #457 of 693 statewide, top 66%, 947 students, 0% FRL).
- Market conditions: 129 active listings in the ZIP; 1 comparable units currently listed for rent nearby; 77 units permitted in Tazewell County in 2024 (0 in 5+ unit buildings).
Forward outlook
- Local home prices are declining (-3.0%/yr); year-one equity from $552 of loan paydown is wiped out by about $2k of value loss. Plan a longer hold.
- Tazewell County population projected at -15% by 2050 — secular population decline; favor cash flow + early exit over multi-decade hold.
- At projected returns (-3.0% appreciation + 3.0% rent growth), your $22k cash investment doubles in ~5 years — after that, you're playing with house money.
Negotiation context
- Only 1 days on market — expect competitive offers; lowballing is unlikely to land.
- Current owner paid $60k; 33% above their basis — modest negotiation headroom, anchor on the comps not their cost.
Risks & watch-outs
- Watch-outs: built in 1898 — expect roof / HVAC / electrical / plumbing capex.
Questions for the listing agent
- Built in 1898 — when were the roof, HVAC, electrical panel, plumbing, and water heater last replaced?
- Is there a deadline driving the sale (1031 exchange, divorce, estate, relocation)? That informs how much negotiation room exists.
- Schools are F-rated, which usually means shorter tenancies and higher turnover. Who's the typical renter profile here, and what's been the actual vacancy rate?
- What's the average days-on-market for RENTAL listings here right now (not sales)? A rising rental-DOM trend means longer vacancies and softer asking-rent achievability than the comps imply.
- What's the recent tenant-quality profile in this submarket — average credit score on applications, eviction rate, late-payment / NSF rate, and stable-employment percentage? A property-management company in the area should have these aggregated.
- How much new for-sale + rental construction is in the pipeline within 1–3 miles? Heavy new supply typically softens prices + rents 12–24 months out; constrained supply supports both.
Investment metrics
- 1% rule
- 1.69% ✓
- Cap rate
- 14.04%
- Cash-on-cash
- 27.67%
- DSCR
- 2.23
- GRM
- 4.9
CMA / ARV
- ARV (on-the-fly)
- $129,744
- Comps found
- 8
Show comp detail 8 sales within ~0.75 mi
| Address | Dist | Beds/Ba | Sqft | Sold | Price | $/sf | Match |
|---|---|---|---|---|---|---|---|
| 401 N Highland Ave | 0.36mi | 3/1.0 (+1) | 1,268 (-0%) | 3mo | $159,999 | $126 | 75 |
| 472 Hillcrest Dr | 0.09mi | 2/1.0 | 1,128 (-11%) | 2mo | $115,000 | $102 | 75 |
| 104 Oaklawn Ter | 0.33mi | 2/1.0 | 1,108 (-13%) | 8mo | $75,000 | $68 | 56 |
| 317 Smith St | 0.66mi | 3/1.0 (+1) | 1,270 (-0%) | 13mo | $120,000 | $94 | 53 |
| 317 N Highland St | 0.38mi | 3/1.5 (+1) | 1,165 (-8%) | 10mo | $117,000 | $100 | 53 |
| 411 W Muller Rd | 0.72mi | 2/1.0 | 1,302 (+2%) | 12mo | $121,500 | $93 | 52 |
| 269 S Thorncrest Ave | 0.58mi | 3/2.0 (+1) | 1,183 (-7%) | 2mo | $130,000 | $110 | 51 |
| 110 Castleman Ct | 0.72mi | 2/1.5 | 1,100 (-14%) | 10mo | $169,900 | $154 | 34 |
Match score weights: distance 35% · size 25% · config 20% · recency 20%. Top-matched comps best support the ARV.
Projected returns pro-forma
-3.0% appreciation · 3.0% rent growth · sell at horizon
- IRR
- 21.8%
- Equity multiple
- 1.89×
- Total profit
- $19,923
- Equity at exit
- $11,913
- IRR
- 29.8%
- Equity multiple
- 3.67×
- Total profit
- $59,729
- Equity at exit
- $6,908
Cash invested: $22,372 (down + closing). Projections, not guarantees.
Landlord ↔ Tenant lean methodology
- Overall (STATE)
- 43 Moderately Tenant-Leaning
- State Illinois
- 43 Moderately Tenant-Leaning · D+7
- County
- — inherits STATE
- City
- — inherits STATE
ZIP-level market 61571
- Active inventory
- 129
- Price-to-rent
- 4.9×
Monthly cashflow live
- Estimated rent
- $1,350 medium interval (Pro) →
- Mortgage (P&I)
- −$419
- Tax from tax record
- −$98 /mo · $1,181/yr
- Insurance
- −$33
- HOA
- −$0
- Vacancy / Maint / Mgmt
- −$284
- Net cashflow
- $516
Break-even live
UW: 25.0% down · 7.5% · 30yr · 1.5% tax · 5.0% vac · 8.0% maint · 8.0% mgmt
Financing live
Cash to close
- Down payment
- $19,975
- Closing costs
- $2,397
- Reserves months
- —
- Total cash needed
- —
Loan-product check · same deal, 3 products live
Conventional
25% down · 7.5% · 30yr
- Down + closing
- —
- Monthly P&I
- —
- Monthly cashflow
- —
- DSCR
- —
- Eligible?
- —
Personal DTI + credit; lowest rate.
DSCR
20% down · 8.5% · 30yr
- Down + closing
- —
- Monthly P&I
- —
- Monthly cashflow
- —
- DSCR
- —
- Eligible?
- —
No personal income docs; deal must DSCR.
Hard money
10% down · 12.0% · 12mo
- Down + closing
- —
- Monthly P&I
- —
- Monthly cashflow
- —
- DSCR
- —
- Eligible?
- —
Short-term bridge; refi at stabilization.
Rent comps 1 comps
| Address | Beds | Baths | Sqft | Rent | $/sqft | DOM | Units | Dist |
|---|---|---|---|---|---|---|---|---|
| 204 Pekin Ave Apt 2 East Peoria, IL | 2.0 | 1.0 | 1150 | $1,350 | $1.17 | 13d | 1 | 1.44mi |
Listing history 3 events
-
2026-06-19status $79,900 Pending 1 DOM
-
2026-06-17remarks 308-char remark
-
2026-06-17$79,900 Active 1 DOM
ⓘ Source: listings_history table (triggers on properties + properties_extension) + one-shot
backfill from property_details.listing_events for pre-trigger history.
Tax reassessment forecast IL · Partial reset (capped growth)
- Current annual tax
- $1,181 · $98/mo
- Projected year-2 tax
- $1,497 · $125/mo
- Expected delta
- +$316/yr (+$26/mo · 26.8%)
ⓘ Screening estimate from a state-policy table — verify with the county assessor before closing.
Climate risk First Street
- Flood 1/10 Low FEMA zone X (unshaded) · 0% chance over 30 yrs
- Wildfire 1/10 Low
- Heat 3/10 Moderate 7 d/yr ≥105°F today · 18 d/yr by 30 yrs out
- Wind 2/10 Low 100% chance of damaging wind over 30 yrs
- Air quality 3/10 Moderate 1 unhealthy d/yr today · 3 by 30 yrs out
Nearby sold comps map
Loading sold comps map…
Walkable amenities ~0.75 mi
Loading nearby amenities…
Taxation est. · year 1
- Rental income
- $16,200
- − Mortgage interest
- −$4,476
- − Property taxes
- −$1,181
- − Insurance
- −$400
- − Repairs & maintenance
- −$1,296
- − Management
- −$1,296
- − Depreciation
- −$2,324
- Taxable income
- $5,228
- Est. tax owed @ 24.0%
- −$1,255
- After-tax cash flow
- $4,935/yr
For passive investors: Depreciation is non-cash, so a rental often shows a tax loss while cash-flowing — sheltering income. Rental losses are passive: they offset passive income freely, and up to $25,000/yr can offset ordinary (W-2) income if you actively participate and your MAGI is under $100k (phasing out to $0 by $150k); unused losses carry forward. On sale, claimed depreciation is recaptured at up to 25%, and gains may owe capital-gains tax (a 1031 exchange can defer both). Figures are a year-1 estimate at your 24.0% rate — not tax advice; consult a CPA.
Schools (NCES district)
- District
- East Peoria Chsd 309
- NCES district ID
- 1713230
- Math proficiency
- 17% ▼ -6.00%
- Reading proficiency
- 15% ▼ -9.00%
- Median HH income
- $51,439
- Composite
- 14.75/100
- National rank
- #9394
- State rank
- #482 of 620 in IL
Livability — Creve Coeur
- Score
- 63/100
- State rank
- #755
- US rank
- #15292
Category grades
Schools grade is shown separately in the Schools card above.
Census & demographics
- Census place
- Creve Coeur, IL
- City population
- 4,572
- Population (ZIP)
- 24,544
Population outlook (Tazewell County) Hauer SSP2
- Today (2025)
- 131,252 people
- By 2030
- 128,028 · -2.5%
- By 2040
- 120,443 · -8.2%
- By 2050
- 111,872 · -14.8%
- By 2075
- 89,843 · -31.5%
- By 2100
- 66,468 · -49.4%
Race, ethnicity, and origin ACS 2023
- Neighborhood character
- Predominantly White (93%)
- Race & ethnicity
- White 93% Hispanic / Latino 3% Two or more races 3% Asian 1%
- Common ancestry
- Lithuanian 4% Italian 3% Iranian 2%
- Foreign-born
- 2% · Canada, China
- Languages at home
- 97% English-only · Spanish 2%
Political lean MEDSL · Tazewell
- 2024 margin
- Strong R (+26.7) · D 35.8% · R 62.5% · Other 1.8%
- 2008→2024 swing
- -20.6pp toward R · 2008: -6.0pp · 2024: -26.7pp
- All cycles
- 2024: R+26.7 2020: R+25.6 2016: R+28.5 2012: R+17.9 2008: R+6.0
Not yet ingested
- Civics
- —
Market trends
- HPI YoY
- ▼ -135.85%
- Current HPI
- 149.5627
- Rent YoY
- —
- Metro
- —
- State GDP YoY
- ▲ 1.59%
- F500 in state
- 60
Industry mix (Fortune 500 HQ in IL)
| Industry | F500 HQs | Revenue |
|---|---|---|
| Insurance | 4 | $201B |
|
||
| Consumer Goods | 4 | $87B |
|
||
| Industrial Machinery | 3 | $64B |
|
||
| Healthcare | 2 | $55B |
|
||
| Retail / Pharmacy | 1 | $148B |
|
||
| Agriculture / Food | 1 | $86B |
|
||
Price history
+840.0% since first listed3 events — show timeline
- 2026-06-17 Listed $79,900 RMLSA as Distributed by MLS Grid
- 2005-05-17 Sold (Public Records) $60,000 Public Records
- 1998-07-23 Sold (Public Records) $8,500 Public Records
Property tax history
+14.8%/yrLatest (2024): $1,181 · +8.5% YoY. Source: county tax records.
Cash-flow waterfall
monthlySold comps — $/sqft
last 12 mo · ≤1 miLoading sold comps…