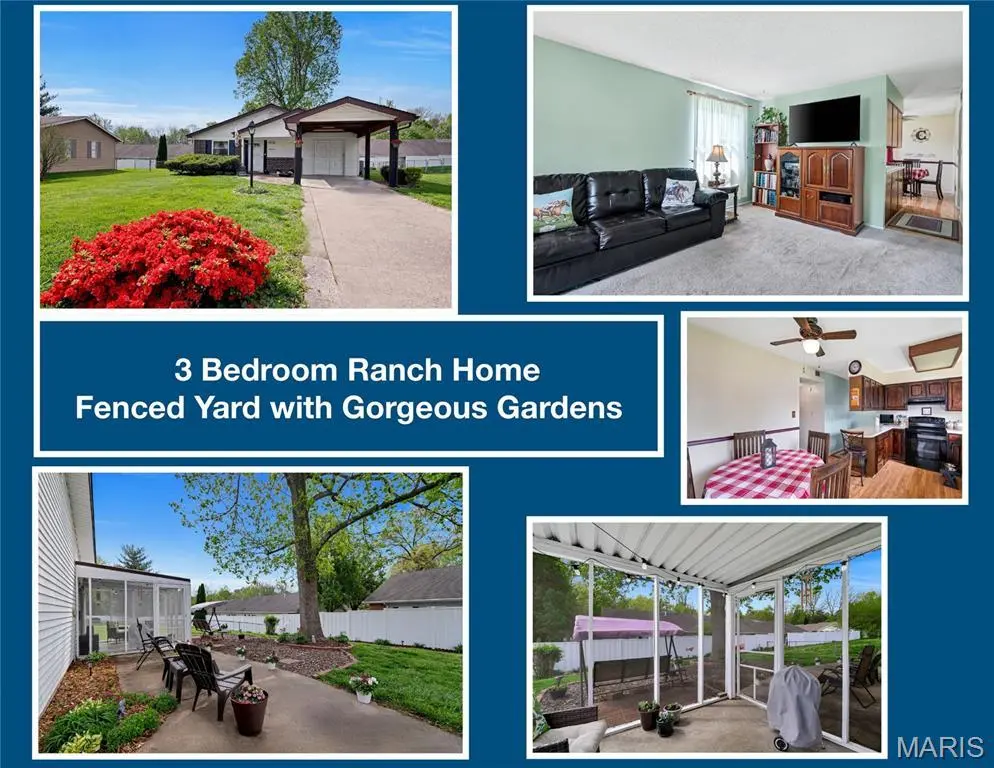
47 Southwinds Dr · St. Peters, MO
Flood risk 1/10 · Minimal
- FEMA flood zone
- X (unshaded)
- Chance of flooding over 30 yrs
- 0.0%
- Est. flood insurance / yr
- $507 – $1,088
Fire risk 1/10 · Minimal
- Est. fire insurance / yr
- $1,054 – $1,958
Heat risk 5/10 · Moderate
- Hot days now (above 108°F)
- 7 days/yr
- Hot days in 30 yrs
- 20 days/yr
Wind risk 2/10 · Minimal
- Chance of severe wind over 30 yrs
- 1.0%
Air-quality risk 2/10 · Minimal
- Unhealthy air days now
- 1 days/yr
- Unhealthy air days in 30 yrs
- 1 days/yr
Risk factors via First Street. Map © Google.
Why this score? — see what drove the C grade
The composite is a weighted blend of 9 inputs, each scored 0–100. Each bar is that input's sub-score; the figure is the points it added to the 100-point composite (weight × sub-score).
- Cash flow +18.5/30.0
- ARV discount +15.0/15.0
- DSCR +5.8/10.0
- Schools +5.1/10.0
- 1% rule +4.5/10.0
- Rent growth +3.2/5.0
- Livability +2.5/5.0
- Condition / age +2.5/5.0
- Appreciation +0.0/10.0
$230,000
🖨 Deal sheet 📄 Offer letter ✓ Due diligence
Listing remarks
Step into this beautiful 3-bedroom, 1-bath home full of natural light and charm. The living room features large windows that let in plenty of sunlight, making the space feel open and airy. The eat-in kitchen has easy-maintenance Pergo flooring, kitchen cabinets that have been refreshed and a fresh coat of paint that creates a bright and inviting space to cook and entertain. Just off the kitchen, you'll find a delightful screened in porch —the perfect spot for reading, hosting game night, or simply enjoying views of the outdoors. Enjoy the Spacious Full Bath that has an updated and easy-to-clean BathFitter tub/shower as well as Vanity and Toilet. The large fenced-in backyard offers amp
Key facts
- 7,710 sq ft lot
- 3 parking spots
- Built 1974
Property features AI
Finance
- Other: Property type: Residential, Single Family Residence
- Financial info: Lease not considered; No home warranty indicated
Exterior
- Parking: 3 total parking spaces; Attached carport (1 space); Driveway; Oversized parking area; Aggregate surface
- Utilities: Public water; Public sewer; Single-phase electric; Cable connected; Electricity connected; Natural gas connected; Phone connected; Water connected; Sewer connected
- Home design: Single-family residence; Private ownership; One story
- Construction: Brick veneer and vinyl siding exterior; Composition roof; Concrete perimeter foundation; Built above grade (living area reported by assessor)
- Exterior features: Front porch; Rear porch; Patio (screened); Screened porch; Landscaped yard; Some trees; Rectangular lot
Interior
- Kitchen: Eat-in kitchen with island
- Bedrooms: 3 bedrooms on the main level (all bedrooms located on main level)
- Bathrooms: 1 full bathroom (main level)
- Heating & cooling: Forced air heating (natural gas); Central air conditioning; Ceiling fans for additional cooling
- Interior features: Ceiling fans; Eat-in kitchen; Kitchen island; Wi-Fi; Patio; Storage
- Laundry & utility: Laundry on main level
Neighborhood map
What this means for you Summary
Snapshot
- This is a 3-bed/1.0-bath single-family listed at $230k.
Deal economics
- At list price, monthly cash flow is $218 ($3k/yr) — positive.
- The deal already cash-flows at list — no discount required.
- To meet the 1% rule (rent ≥ 1% of price), the offer needs to be $219k (4.8% below list).
- Recommended offer: $219k (4.8% below list) — sets the bar for 1% rule.
- Cap rate 7.4% vs local median 4.2% in St. Peters — top-decile yield for the area; either an underpriced asset or a hidden risk that comps aren't pricing in. Stress-test before assuming the spread holds.
Location & tenants
- Location reads: area grade C — affects rentability + tenant quality, not the cash-flow math above.
- Ft. Zumwalt R-II (suburban): math 54% / reading 60% proficiency, ranked #14 of 324 in MO (top 4%) — acceptable for families but not a draw, mixed tenant base, ~2y average lease; only 18% free/reduced lunch — higher-income household profile.
- Zoned schools: St. Peters Elem. (384 students, 32% FRL); Ft. Zumwalt South High (math 57% / reading 70%, grade B-, #24 of 521 statewide, top 4%, 1,334 students, 15% FRL).
- Market conditions: Rents rising (+2.7%/yr); 290 active listings in the ZIP; 4 comparable units currently listed for rent nearby; rentals at typical pace (median 24d on market — plan ~3-4 weeks tenant-placement turnaround); solid renter incomes; 2,021 units permitted in St. Charles County in 2024 (568 in 5+ unit buildings).
Forward outlook
- Local home prices are declining (-3.0%/yr); year-one equity from $2k of loan paydown is wiped out by about $7k of value loss. Plan a longer hold.
- St. Charles County population projected at +22% by 2050 — long-run rental-demand tailwind backs the buy-and-hold thesis.
Negotiation context
- Only 8 days on market — expect competitive offers; lowballing is unlikely to land.
- Current owner paid $66k; list at $230k implies a 246% gain — meaningful room to come down on a strong offer.
Risks & watch-outs
- Climate carrying-cost: extreme-heat days projected 7→20/yr by 2055 (HVAC capex compounding) — expect insurance premiums to compound above CPI over the hold.
Questions for the listing agent
- Built in 1974 — when were the roof, HVAC, electrical panel, plumbing, and water heater last replaced?
- Is there a deadline driving the sale (1031 exchange, divorce, estate, relocation)? That informs how much negotiation room exists.
- What's the average days-on-market for RENTAL listings here right now (not sales)? A rising rental-DOM trend means longer vacancies and softer asking-rent achievability than the comps imply.
- What's the recent tenant-quality profile in this submarket — average credit score on applications, eviction rate, late-payment / NSF rate, and stable-employment percentage? A property-management company in the area should have these aggregated.
- How much new for-sale + rental construction is in the pipeline within 1–3 miles? Heavy new supply typically softens prices + rents 12–24 months out; constrained supply supports both.
Investment metrics
- 1% rule
- 0.95% ✗
- Cap rate
- 7.43%
- Cash-on-cash
- 4.06%
- DSCR
- 1.18
- GRM
- 8.8
CMA / ARV
- ARV (on-the-fly)
- $291,084
- Comps found
- 12
Show comp detail 12 sales within ~0.75 mi
| Address | Dist | Beds/Ba | Sqft | Sold | Price | $/sf | Match |
|---|---|---|---|---|---|---|---|
| 47 Southwinds Dr | 0.00mi | 3/1.0 | 1,146 (0%) | 1mo | $230,000 | $201 | 99 |
| 13 Northwinds Dr | 0.15mi | 3/2.0 | 1,142 (-0%) | 2mo | $289,900 | $254 | 86 |
| 23 Northwinds Dr | 0.11mi | 3/1.5 | 1,164 (+2%) | 6mo | $250,000 | $215 | 86 |
| 34 Southwinds Dr | 0.08mi | 3/1.0 | 1,020 (-11%) | 3mo | $250,000 | $245 | 76 |
| 124 Del Oro Dr | 0.32mi | 3/2.0 | 1,154 (+1%) | 12mo | $300,000 | $260 | 70 |
| 47 W Douglas Dr | 0.42mi | 3/2.0 | 1,144 (-0%) | 11mo | $300,000 | $262 | 67 |
| 159 Blue Water Dr | 0.39mi | 3/2.0 | 1,230 (+7%) | 9mo | $350,000 | $285 | 58 |
| 8 Soutee Dr | 0.62mi | 3/1.5 | 1,104 (-4%) | 7mo | $276,000 | $250 | 57 |
| 21 Sun Beam Ct | 0.73mi | 3/2.0 | 1,200 (+5%) | 3mo | $325,000 | $271 | 52 |
| 251 Timberbrook Dr Unit B | 0.52mi | 2/1.0 (-1) | 1,040 (-9%) | 5mo | $189,900 | $183 | 51 |
| 112 Hollow Creek Dr | 0.66mi | 3/2.5 | 1,090 (-5%) | 12mo | $299,000 | $274 | 45 |
| 6 Tori Ann Dr | 0.74mi | 3/2.0 | 1,295 (+13%) | 2mo | $299,900 | $232 | 39 |
Match score weights: distance 35% · size 25% · config 20% · recency 20%. Top-matched comps best support the ARV.
Projected returns pro-forma
-3.0% appreciation · 2.69% rent growth · sell at horizon
- IRR
- -10.3%
- Equity multiple
- 0.63×
- Total profit
- $-24,079
- Equity at exit
- $34,294
- IRR
- -1.4%
- Equity multiple
- 0.91×
- Total profit
- $-5,921
- Equity at exit
- $19,886
Cash invested: $64,400 (down + closing). Projections, not guarantees.
Landlord ↔ Tenant lean methodology
- Overall (STATE)
- 81 Strongly Landlord-Friendly
- State Missouri
- 81 Strongly Landlord-Friendly · R+10
- County
- — inherits STATE
- City
- — inherits STATE
ZIP-level market 63376
- Rents YoY
- 2.7%
- Active inventory
- 290
- Price-to-rent
- 8.8×
Monthly cashflow live
- Estimated rent
- $2,190 medium interval (Pro) →
- Mortgage (P&I)
- −$1,206
- Tax from tax record
- −$210 /mo · $2,525/yr
- Insurance
- −$96
- HOA
- −$0
- Vacancy / Maint / Mgmt
- −$460
- Net cashflow
- $218
Break-even live
UW: 25.0% down · 7.5% · 30yr · 1.5% tax · 5.0% vac · 8.0% maint · 8.0% mgmt
Financing live
Cash to close
- Down payment
- $57,500
- Closing costs
- $6,900
- Reserves months
- —
- Total cash needed
- —
Loan-product check · same deal, 3 products live
Conventional
25% down · 7.5% · 30yr
- Down + closing
- —
- Monthly P&I
- —
- Monthly cashflow
- —
- DSCR
- —
- Eligible?
- —
Personal DTI + credit; lowest rate.
DSCR
20% down · 8.5% · 30yr
- Down + closing
- —
- Monthly P&I
- —
- Monthly cashflow
- —
- DSCR
- —
- Eligible?
- —
No personal income docs; deal must DSCR.
Hard money
10% down · 12.0% · 12mo
- Down + closing
- —
- Monthly P&I
- —
- Monthly cashflow
- —
- DSCR
- —
- Eligible?
- —
Short-term bridge; refi at stabilization.
Rent comps 4 comps
| Address | Beds | Baths | Sqft | Rent | $/sqft | DOM | Units | Dist |
|---|---|---|---|---|---|---|---|---|
| 10 Kingsmont Ct Saint Peters, MO | 3.0 | 2.0 | 1488 | $2,446 | $1.64 | 22d | 1 | 0.81mi |
| 43 Kingspointe Dr Saint Peters, MO | 3.0 | 2.0 | 1072 | $2,125 | $1.98 | 23d | 1 | 1.05mi |
| 8 Oak Dr Saint Peters, MO | 3.0 | 1.5 | 1134 | $2,231 | $1.97 | 3d | 1 | 1.28mi |
| 131 Oak Dr Saint Peters, MO | 3.0 | 2.0 | 1500 | $1,950 | $1.30 | 23d | 1 | 1.30mi |
Listing history 7 events
-
2026-05-02status Pending
-
2026-04-24$230,000 Active
-
2026-04-16historical $230,000
-
1998-05-11soldstatus $66,500
-
1990-01-01soldstatus $56,000
-
1988-07-01soldstatus $57,000
-
1984-08-01soldstatus
ⓘ Source: listings_history table (triggers on properties + properties_extension) + one-shot
backfill from property_details.listing_events for pre-trigger history.
Tax reassessment forecast MO · Resets to sale price
- Current annual tax
- $2,525 · $210/mo
- Projected year-2 tax
- $2,525 · $210/mo
- Expected delta
- $0/yr ($0/mo · 0.0%)
ⓘ Screening estimate from a state-policy table — verify with the county assessor before closing.
Climate risk First Street
- Flood 1/10 Low FEMA zone X (unshaded) · 0% chance over 30 yrs
- Wildfire 1/10 Low
- Heat 5/10 Major 7 d/yr ≥108°F today · 20 d/yr by 30 yrs out
- Wind 2/10 Low 100% chance of damaging wind over 30 yrs
- Air quality 2/10 Low 1 unhealthy d/yr today · 1 by 30 yrs out
Nearby sold comps map
Loading sold comps map…
Walkable amenities ~0.75 mi
Loading nearby amenities…
Taxation est. · year 1
- Rental income
- $26,285
- − Mortgage interest
- −$12,884
- − Property taxes
- −$2,525
- − Insurance
- −$1,150
- − Repairs & maintenance
- −$2,103
- − Management
- −$2,103
- − Depreciation
- −$6,691
- Taxable loss
- −$1,170
- Est. tax savings @ 24.0%
- +$281
- After-tax cash flow
- $2,897/yr
For passive investors: Depreciation is non-cash, so a rental often shows a tax loss while cash-flowing — sheltering income. Rental losses are passive: they offset passive income freely, and up to $25,000/yr can offset ordinary (W-2) income if you actively participate and your MAGI is under $100k (phasing out to $0 by $150k); unused losses carry forward. On sale, claimed depreciation is recaptured at up to 25%, and gains may owe capital-gains tax (a 1031 exchange can defer both). Figures are a year-1 estimate at your 24.0% rate — not tax advice; consult a CPA.
Schools (NCES district)
- District
- Ft. Zumwalt R-II
- NCES district ID
- 2908370
- Math proficiency
- 54% ▼ -7.00%
- Reading proficiency
- 60% ▼ -4.00%
- Median HH income
- $75,817
- Composite
- 51.04/100
- National rank
- #1772
- State rank
- #14 of 324 in MO
Livability — St. Peters
No livability data for this city. (Only ~50 U.S. cities are tracked.)
Census & demographics
- County
- Saint Charles County · 399,703 people
- City population
- 74,876
- Metro
- St. Louis, MO-IL
- Population (ZIP)
- 74,962
- Household income
- $96,393
- Rent vs Own
- Severe rent burden
- 964.0
Population outlook (St. Charles County) Hauer SSP2
- Today (2025)
- 437,857 people
- By 2030
- 461,707 · +5.4%
- By 2040
- 503,222 · +14.9%
- By 2050
- 534,684 · +22.1%
- By 2075
- 597,047 · +36.4%
- By 2100
- 609,682 · +39.2%
Race, ethnicity, and origin ACS 2023
- Neighborhood character
- Predominantly White (86%)
- Race & ethnicity
- White 86% Two or more races 6% Black 5% Hispanic / Latino 2% Asian 2%
- Common ancestry
- Lithuanian 3% Romanian 3% Italian 2%
- Foreign-born
- 3% · China, Canada
- Languages at home
- 96% English-only · Spanish 1% Chinese 1% Other Asian/Pacific 1%
Political lean MEDSL · St. Charles
- 2024 margin
- R (+17.0) · D 40.8% · R 57.8% · Other 1.4%
- 2008→2024 swing
- -7.2pp toward R · 2008: -9.7pp · 2024: -17.0pp
- All cycles
- 2024: R+17.0 2020: R+17.5 2016: R+26.4 2012: R+21.0 2008: R+9.7
Not yet ingested
- Civics
- —
Market trends
- HPI YoY
- ▼ -315.50%
- Current HPI
- 230.3362
- Rent YoY
- ▲ 2.69%
- Metro
- St. Louis, MO-IL
- State GDP YoY
- ▲ 1.84%
- F500 in state
- 20
Industry mix (Fortune 500 HQ in MO)
| Industry | F500 HQs | Revenue |
|---|---|---|
| Healthcare | 1 | $163B |
|
||
| Insurance | 1 | $21B |
|
||
| Industrial Technology | 1 | $17B |
|
||
| Retail | 1 | $16B |
|
||
| Industrial Distribution | 1 | $10B |
|
||
| Utilities | 1 | $9B |
|
||
Price history
+303.5% since first listed7 events — show timeline
- 2026-05-02 Pending — MARIS as Distributed by MLS Grid
- 2026-04-24 Listed $230,000 MARIS as Distributed by MLS Grid
- 2026-04-16 Coming Soon $230,000 MARIS as Distributed by MLS Grid
- 1998-05-11 Sold (Public Records) $66,500 Public Records
- 1990-01-01 Sold (Public Records) $56,000 Public Records
- 1988-07-01 Sold (Public Records) $57,000 Public Records
- 1984-08-01 Sold (Public Records) — Public Records
Property tax history
+5.2%/yrLatest (2025): $2,525 · +10.8% YoY. Source: county tax records.
Cash-flow waterfall
monthlySold comps — $/sqft
last 12 mo · ≤1 miLoading sold comps…