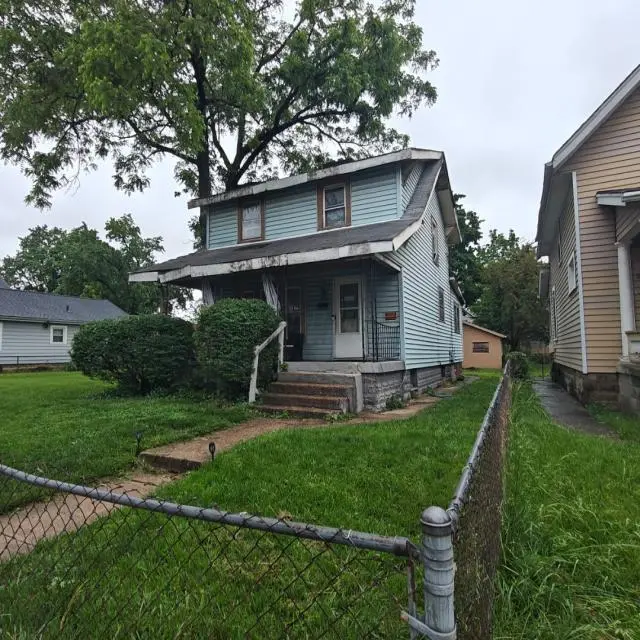
288 Midland Ave · Columbus, OH
Flood risk 1/10 · Minimal
- FEMA flood zone
- X (unshaded)
- Chance of flooding over 30 yrs
- 0.0%
- Est. flood insurance / yr
- $473 – $860
Fire risk 1/10 · Minimal
- Est. fire insurance / yr
- $713 – $1,323
Heat risk 4/10 · Minor
- Hot days now (above 100°F)
- 7 days/yr
- Hot days in 30 yrs
- 18 days/yr
Wind risk 2/10 · Minimal
- Chance of severe wind over 30 yrs
- 1.0%
Air-quality risk 2/10 · Minimal
- Unhealthy air days now
- 1 days/yr
- Unhealthy air days in 30 yrs
- 2 days/yr
Risk factors via First Street. Map © Google.
Why this score? — see what drove the D grade
The composite is a weighted blend of 9 inputs, each scored 0–100. Each bar is that input's sub-score; the figure is the points it added to the 100-point composite (weight × sub-score).
- Cash flow +15.0/30.0
- ARV discount +7.5/15.0
- 1% rule +5.0/10.0
- DSCR +5.0/10.0
- Livability +4.0/5.0
- Rent growth +3.7/5.0
- Condition / age +2.5/5.0
- Schools +1.7/10.0
- Appreciation +0.0/10.0
$1
🖨 Deal sheet 📄 Offer letter ✓ Due diligence
Key facts
- 5,227 sq ft lot
- 2 garage spots
- Built 1928
Neighborhood map
What this means for you Summary
Snapshot
- This is a 3-bed/1.0-bath single-family listed at $1.
Deal economics
- At list price, monthly cash flow is $1k ($13k/yr) — positive.
- The deal already cash-flows at list — no discount required.
- Meets the 1% rule at list price ($1k rent vs $1).
- Cap rate 1318305.8% vs local median 3.8% in Columbus — top-decile yield for the area; either an underpriced asset or a hidden risk that comps aren't pricing in. Stress-test before assuming the spread holds.
Location & tenants
- Location reads 81/100 on livability (#97 in OH, #1,491 nationally) — a professional / high-income tenant draw. Strengths: commute A+, cost of living A+, housing A+; Watch: employment C-, crime F.
- Columbus City School District (urban): math 15% / reading 26% proficiency, ranked #626 of 656 in OH (top 95%) — low school quality limits family demand, transient renter base, plan for 1-2y turnover; 72% free/reduced lunch — lower-income household profile, screen leases tightly.
- Market conditions: Rents rising fast (+4.6%/yr); 144 active listings in the ZIP; 40 comparable units currently listed for rent nearby; rentals at typical pace (median 21d on market — plan ~3-4 weeks tenant-placement turnaround); 8,139 units permitted in Franklin County in 2024 (5,940 in 5+ unit buildings).
- This rent runs 36% of the median local income ($47k/yr) — at the standard rent-burdened threshold; future hikes will face affordability resistance.
Forward outlook
- Local home prices are declining (-3.0%/yr); year-one equity from $0 of loan paydown is wiped out by about $0 of value loss. Plan a longer hold.
- Franklin County population projected at +34% by 2050 — long-run rental-demand tailwind backs the buy-and-hold thesis.
- At projected returns (-3.0% appreciation + 4.6% rent growth), your $0 cash investment doubles in ~1 year — after that, you're playing with house money.
Negotiation context
- Only 0 days on market — expect competitive offers; lowballing is unlikely to land.
Risks & watch-outs
- Watch-outs: built in 1928 — expect roof / HVAC / electrical / plumbing capex.
Questions for the listing agent
- Built in 1928 — when were the roof, HVAC, electrical panel, plumbing, and water heater last replaced?
- Is there a deadline driving the sale (1031 exchange, divorce, estate, relocation)? That informs how much negotiation room exists.
- Crime grade is F in this area — have there been break-ins, vandalism, or insurance claims at this property in the last 3 years? What carrier currently insures it and at what premium?
- The area grade is low — what's the realistic commute time and amenity access for the typical tenant pool here? Any planned neighborhood developments (good or bad) we should know about?
- What's the average days-on-market for RENTAL listings here right now (not sales)? A rising rental-DOM trend means longer vacancies and softer asking-rent achievability than the comps imply.
- What's the recent tenant-quality profile in this submarket — average credit score on applications, eviction rate, late-payment / NSF rate, and stable-employment percentage? A property-management company in the area should have these aggregated.
- How much new for-sale + rental construction is in the pipeline within 1–3 miles? Heavy new supply typically softens prices + rents 12–24 months out; constrained supply supports both.
Investment metrics
- 1% rule
- 139062.00% ✓
- Cap rate
- 1318305.76%
- Cash-on-cash
- 4708212.38%
- DSCR
- 209489.96
- GRM
- 0.0
CMA / ARV
- ARV (on-the-fly)
- $161,944
- Comps found
- 12
Show comp detail 12 sales within ~0.75 mi
| Address | Dist | Beds/Ba | Sqft | Sold | Price | $/sf | Match |
|---|---|---|---|---|---|---|---|
| 283 Whitethorne Ave | 0.04mi | 3/1.5 | 1,376 (+5%) | 1mo | $170,000 | $124 | 86 |
| 479 Nashoba Ave | 0.42mi | 3/1.0 | 1,332 (+2%) | 2mo | $119,000 | $89 | 76 |
| 1930 Floral Ave | 0.43mi | 3/1.5 | 1,328 (+2%) | 1mo | $220,000 | $166 | 74 |
| 237 Midland Ave | 0.08mi | 4/1.0 (+1) | 1,452 (+11%) | 1mo | $159,000 | $110 | 72 |
| 321 Belvidere Ave | 0.13mi | 3/1.0 | 1,494 (+14%) | 1mo | $85,000 | $57 | 69 |
| 246 S Terrace Ave | 0.47mi | 3/1.0 | 1,232 (-6%) | 0mo | $205,000 | $166 | 68 |
| 106 S Oakley Ave | 0.38mi | 2/1.0 (-1) | 1,244 (-5%) | 2mo | $99,000 | $80 | 68 |
| 1924 Sullivant Ave | 0.39mi | 3/2.5 | 1,360 (+4%) | 2mo | $210,000 | $154 | 67 |
| 468 S Ogden Ave | 0.72mi | 3/1.5 | 1,316 (+1%) | 1mo | $180,000 | $137 | 62 |
| 427 S Richardson Ave | 0.60mi | 4/1.0 (+1) | 1,378 (+6%) | 0mo | $160,000 | $116 | 58 |
| 229 S Richardson Ave | 0.57mi | 3/1.0 | 1,168 (-11%) | 1mo | $165,000 | $141 | 55 |
| 416 S Burgess Ave | 0.63mi | 2/1.0 (-1) | 1,210 (-7%) | 0mo | $134,900 | $111 | 53 |
Match score weights: distance 35% · size 25% · config 20% · recency 20%. Top-matched comps best support the ARV.
Projected returns pro-forma
-3.0% appreciation · 4.61% rent growth · sell at horizon
- IRR
- —
- Equity multiple
- 258139.82×
- Total profit
- $72,279
- Equity at exit
- $0
- IRR
- —
- Equity multiple
- 581525.37×
- Total profit
- $162,827
- Equity at exit
- $0
Cash invested: $0 (down + closing). Projections, not guarantees.
Landlord ↔ Tenant lean methodology
- Overall (STATE)
- 73 Landlord-Friendly
- State Ohio
- 73 Landlord-Friendly · R+6
- County
- — inherits STATE
- City
- — inherits STATE
ZIP-level market 43223
- Rents YoY
- 4.6%
- Active inventory
- 144
Monthly cashflow live
- Estimated rent
- $1,391 high interval (Pro) →
- Mortgage (P&I)
- −$0
- Tax est. 1.5%
- −$0 /mo · $0/yr
- Insurance
- −$0
- HOA
- −$0
- Vacancy / Maint / Mgmt
- −$292
- Net cashflow
- $1,099
Break-even live
UW: 25.0% down · 7.5% · 30yr · 1.5% tax · 5.0% vac · 8.0% maint · 8.0% mgmt
Financing live
Cash to close
- Down payment
- $0
- Closing costs
- $0
- Reserves months
- —
- Total cash needed
- —
Loan-product check · same deal, 3 products live
Conventional
25% down · 7.5% · 30yr
- Down + closing
- —
- Monthly P&I
- —
- Monthly cashflow
- —
- DSCR
- —
- Eligible?
- —
Personal DTI + credit; lowest rate.
DSCR
20% down · 8.5% · 30yr
- Down + closing
- —
- Monthly P&I
- —
- Monthly cashflow
- —
- DSCR
- —
- Eligible?
- —
No personal income docs; deal must DSCR.
Hard money
10% down · 12.0% · 12mo
- Down + closing
- —
- Monthly P&I
- —
- Monthly cashflow
- —
- DSCR
- —
- Eligible?
- —
Short-term bridge; refi at stabilization.
Rent comps 40 comps
| Address | Beds | Baths | Sqft | Rent | $/sqft | DOM | Units | Dist |
|---|---|---|---|---|---|---|---|---|
| 257 Clarendon Ave Unit 257,259,261,263 Columbus, OH | 2.0 | 1.0 | 1000 | $1,200 | $1.20 | 43d | 1 | 0.10mi |
| 255 Belvidere Ave Columbus, OH | 2.0 | 1.0 | 1144 | $1,195 | $1.04 | 16d | 1 | 0.11mi |
| 170 S Highland Ave Columbus, OH | 2.0 | 1.0 | 950 | $895 | $0.94 | 43d | 1 | 0.23mi |
| 95-97 Whitethorne Ave Columbus, OH | 3.0 | 1.5 | 1260 | $1,475 | $1.17 | 19d | 1 | 0.25mi |
| 95-97 Whitethorne Ave Columbus, OH | 3.0 | 1.5 | 1260 | $1,375 | $1.09 | 3d | 1 | 0.25mi |
| 2205 Sullivant Ave Columbus, OH | 3.0 | 1.0 | 1275 | $1,200 | $0.94 | 43d | 1 | 0.26mi |
| 1964 Sullivant Ave Columbus, OH | 4.0 | 2.0 | 1580 | $1,650 | $1.04 | 23d | 1 | 0.34mi |
| 190 Nashoba Ave Columbus, OH | 2.0 | 1.0 | 1030 | $1,450 | $1.41 | 19d | 1 | 0.35mi |
| 190 Nashoba Ave Columbus, OH | 2.0 | 1.0 | 1030 | $1,450 | $1.41 | 12d | 1 | 0.35mi |
| 252-254 S Wayne Ave Unit 254 Columbus, OH | 3.0 | 1.0 | 1120 | $1,300 | $1.16 | 17d | 1 | 0.35mi |
| 329 S Wayne Ave Columbus, OH | 3.0 | 1.0 | 1120 | $1,425 | $1.27 | 3d | 1 | 0.39mi |
| 41 S Oakley Ave Columbus, OH | 3.0 | 1.5 | 1428 | $1,550 | $1.09 | 43d | 1 | 0.46mi |
| 548 S Wayne Ave Columbus, OH | 3.0 | 1.0 | 1008 | $1,225 | $1.22 | 19d | 1 | 0.51mi |
| 521-523 S Wayne Ave Columbus, OH | 3.0 | 1.0 | 1092 | $1,195 | $1.09 | 3d | 1 | 0.52mi |
| 488 Woodbury Ave Columbus, OH | 3.0 | 1.5 | 1222 | $1,250 | $1.02 | 43d | 1 | 0.57mi |
| 530 S Terrace Ave Columbus, OH | 2.0 | 1.0 | 896 | $900 | $1.00 | 23d | 1 | 0.60mi |
| 543 Woodbury Ave Unit NA Columbus, OH | 3.0 | 1.0 | 1308 | $1,645 | $1.26 | 14d | 1 | 0.60mi |
| 692 S Wheatland Ave Columbus, OH | 3.0 | 1.0 | 1608 | $1,547 | $0.96 | 43d | 1 | 0.62mi |
| 29 S Terrace Ave Columbus, OH | 3.0 | 1.0 | 1144 | $1,260 | $1.10 | 23d | 1 | 0.62mi |
| 27-29 N Terrace Ave Unit 29 Columbus, OH | 3.0 | 1.0 | 1144 | $1,260 | $1.10 | 23d | 1 | 0.62mi |
| 2545-2547 Sullivant Ave Columbus, OH | 3.0 | 1.0 | 1064 | $1,100 | $1.03 | 10d | 1 | 0.64mi |
| 39 Eldon Ave Unit 1 Columbus, OH | 3.0 | 2.0 | 1043 | $1,500 | $1.44 | 23d | 1 | 0.68mi |
| 174 N Wheatland Ave Columbus, OH | 2.0 | 1.0 | 917 | $1,046 | $1.14 | 3d | 3 | 0.71mi |
| 695 S Eureka Ave Columbus, OH | 3.0 | 1.0 | 1344 | $1,425 | $1.06 | 21d | 1 | 0.72mi |
| 133 N Eureka Ave Columbus, OH | 3.0 | 1.0 | 1484 | $1,350 | $0.91 | 12d | 1 | 0.73mi |
| 1928-1930 Vaughn St Unit 1928 Columbus, OH | 2.0 | 1.0 | 919 | $957 | $1.04 | 43d | 1 | 0.74mi |
| 427 S Ogden Ave Unit 427 Columbus, OH | 2.0 | 1.0 | 980 | $1,350 | $1.38 | 7d | 1 | 0.75mi |
| 791-793 Butler Ave Unit 791 Columbus, OH | 3.0 | 1.0 | 1000 | $1,395 | $1.40 | 3d | 1 | 0.75mi |
| 475 S Ogden Ave Columbus, OH | 2.0 | 1.0 | 888 | $1,100 | $1.24 | 23d | 1 | 0.77mi |
| 436 Catherine St Columbus, OH | 2.0 | 1.5 | 960 | $1,300 | $1.35 | 7d | 1 | 0.79mi |
| 432 Catherine St Columbus, OH | 3.0 | 1.0 | 1073 | $1,325 | $1.23 | 14d | 1 | 0.79mi |
| 432 Catherine St Columbus, OH | 3.0 | 1.0 | 1073 | $1,325 | $1.23 | 12d | 1 | 0.79mi |
| 80 S Warren Ave Columbus, OH | 3.0 | 1.0 | 1258 | $1,345 | $1.07 | 3d | 1 | 0.80mi |
| 80 S Warren Ave Columbus, OH | 3.0 | 1.0 | 1258 | $1,345 | $1.07 | 43d | 1 | 0.80mi |
| 2676 Sullivant Ave Columbus, OH | 3.0 | 1.0 | 1524 | $1,200 | $0.79 | 43d | 1 | 0.80mi |
| 616-618 S Ogden Ave Columbus, OH | 3.0 | 1.0 | 1100 | $1,125 | $1.02 | 43d | 1 | 0.82mi |
| 54 N Ogden Ave Columbus, OH | 3.0 | 1.0 | 1176 | $950 | $0.81 | 2d | 1 | 0.83mi |
| 661-663 S Burgess Ave Columbus, OH | 3.0 | 1.0 | 1100 | $1,028 | $0.93 | 43d | 1 | 0.83mi |
| 87-97 N Burgess Ave Unit 93 Columbus, OH | 2.0 | 1.5 | 1050 | $1,250 | $1.19 | 23d | 1 | 0.84mi |
| 87-97 N Burgess Ave Columbus, OH | 2.0 | 1.0 | 950 | $1,250 | $1.32 | 43d | 1 | 0.84mi |
Listing history 1 events
-
2026-06-18$1 Pending
ⓘ Source: listings_history table (triggers on properties + properties_extension) + one-shot
backfill from property_details.listing_events for pre-trigger history.
Climate risk First Street
- Flood 1/10 Low FEMA zone X (unshaded) · 0% chance over 30 yrs
- Wildfire 1/10 Low
- Heat 4/10 Moderate 7 d/yr ≥100°F today · 18 d/yr by 30 yrs out
- Wind 2/10 Low 100% chance of damaging wind over 30 yrs
- Air quality 2/10 Low 1 unhealthy d/yr today · 2 by 30 yrs out
Nearby sold comps map
Loading sold comps map…
Walkable amenities ~0.75 mi
Loading nearby amenities…
Taxation est. · year 1
- Rental income
- $16,687
- − Mortgage interest
- −$0
- − Property taxes
- −$0
- − Insurance
- −$0
- − Repairs & maintenance
- −$1,335
- − Management
- −$1,335
- − Depreciation
- −$0
- Taxable income
- $14,017
- Est. tax owed @ 24.0%
- −$3,364
- After-tax cash flow
- $9,819/yr
For passive investors: Depreciation is non-cash, so a rental often shows a tax loss while cash-flowing — sheltering income. Rental losses are passive: they offset passive income freely, and up to $25,000/yr can offset ordinary (W-2) income if you actively participate and your MAGI is under $100k (phasing out to $0 by $150k); unused losses carry forward. On sale, claimed depreciation is recaptured at up to 25%, and gains may owe capital-gains tax (a 1031 exchange can defer both). Figures are a year-1 estimate at your 24.0% rate — not tax advice; consult a CPA.
Schools (NCES district)
- District
- Columbus City School District
- NCES district ID
- 3904380
- Math proficiency
- 15% ▼ -17.00%
- Reading proficiency
- 26% ▼ -12.00%
- Median HH income
- $38,483
- Composite
- 17.19/100
- National rank
- #9105
- State rank
- #626 of 656 in OH
Livability — Columbus
- Score
- 81/100
- State rank
- #97
- US rank
- #1491
Category grades
Schools grade is shown separately in the Schools card above.
Census & demographics
- Census place
- Columbus, OH
- County
- Franklin County · 1,351,780 people
- City population
- 612,189
- Metro
- Columbus, OH
- Population (ZIP)
- 28,187
- Household income
- $46,911
- Rent vs Own
- Severe rent burden
- 1689.0
Population outlook (Franklin County) Hauer SSP2
- Today (2025)
- 1,456,139 people
- By 2030
- 1,556,890 · +6.9%
- By 2040
- 1,757,349 · +20.7%
- By 2050
- 1,950,539 · +34.0%
- By 2075
- 2,376,171 · +63.2%
- By 2100
- 2,636,796 · +81.1%
Race, ethnicity, and origin ACS 2023
- Neighborhood character
- Diverse neighborhood (Simpson 0.55)
- Race & ethnicity
- White 63% Black 22% Two or more races 8% Hispanic / Latino 8%
- Hispanic origin (detail)
- Mexican 4% Puerto Rican 3%
- Common ancestry
- Romanian 4% Italian 1% Slovak 1%
- Foreign-born
- 5% · Canada
- Languages at home
- 91% English-only · Spanish 5%
Political lean MEDSL · Franklin
- 2024 margin
- Strong D (+28.4) · D 63.7% · R 35.3% · Other 1.0%
- 2008→2024 swing
- +7.7pp toward D · 2008: 20.7pp · 2024: 28.4pp
- All cycles
- 2024: D+28.4 2020: D+31.4 2016: D+25.9 2012: D+21.7 2008: D+20.7
Not yet ingested
- Civics
- —
Market trends
- HPI YoY
- ▼ -135.33%
- Current HPI
- 211.6742
- Rent YoY
- ▲ 4.61%
- Metro
- Columbus, OH
- State GDP YoY
- ▲ 1.98%
- F500 in state
- 48
Industry mix (Fortune 500 HQ in OH)
| Industry | F500 HQs | Revenue |
|---|---|---|
| Insurance | 3 | $145B |
|
||
| Industrial Machinery | 3 | $49B |
|
||
| Financial Services | 3 | $24B |
|
||
| Consumer Goods | 2 | $93B |
|
||
| Aerospace / Defense | 2 | $47B |
|
||
| Utilities | 2 | $33B |
|
||
Property tax history
+12.4%/yrLatest (2024): $2,192 · -0.9% YoY. Source: county tax records.
Cash-flow waterfall
monthlySold comps — $/sqft
last 12 mo · ≤1 miLoading sold comps…