 🏷️ Likely Rental
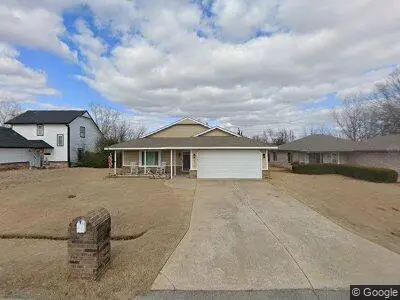
9415 E Sprucewood Dr · Verdigris, OK
Flood risk 1/10 · Minimal
- FEMA flood zone
- X (unshaded)
- Chance of flooding over 30 yrs
- 0.0%
- Est. flood insurance / yr
- $507 – $1,088
Fire risk 4/10 · Minor
- Est. fire insurance / yr
- $2,463 – $4,575
Heat risk 7/10 · Major
- Hot days now (above 110°F)
- 7 days/yr
- Hot days in 30 yrs
- 20 days/yr
Wind risk 2/10 · Minimal
- Chance of severe wind over 30 yrs
- 3.0%
Air-quality risk 2/10 · Minimal
- Unhealthy air days now
- 2 days/yr
- Unhealthy air days in 30 yrs
- 2 days/yr
Risk factors via First Street. Map © Google.
Why this score? — see what drove the D grade
The composite is a weighted blend of 9 inputs, each scored 0–100. Each bar is that input's sub-score; the figure is the points it added to the 100-point composite (weight × sub-score).
- Cash flow +15.0/30.0
- ARV discount +7.5/15.0
- 1% rule +5.0/10.0
- DSCR +5.0/10.0
- Livability +3.5/5.0
- Schools +3.1/10.0
- Rent growth +2.5/5.0
- Condition / age +2.5/5.0
- Appreciation +0.0/10.0
$10,000
🖨 Deal sheet (PDF) 📄 Offer letter ✓ Due diligence
Listing remarks MLS
Yay! Have you been searching for a great home? Reasonably priced? Larger lot? Well, this new listing has all of those things and so much more. Super clean, well cared for cutie! 3/2/2. Extra large backyard, with above ground pool . So many great and updated features. Some new windows, treated lawn. Bay window in dining. Patio access from master and dining. New appliances, frig stays. Desirable Verdigris School System. Come have a look at this wonderful home!
Key facts
- Laminate floors
- Fenced back yard
- Vaulted ceiling
Tags
Neighborhood map
What this means for you Summary
Snapshot
- This is a 3-bed/2.0-bath single-family listed at $10k.
Deal economics
- At list price, monthly cash flow is $1k ($14k/yr) — positive.
- The deal already cash-flows at list — no discount required.
- Meets the 1% rule at list price ($2k rent vs $10k).
- Cap rate 147.1% vs local median 4.0% in Verdigris — top-decile yield for the area; either an underpriced asset or a hidden risk that comps aren't pricing in. Stress-test before assuming the spread holds.
Location & tenants
- Location reads 70/100 on livability (#40 in OK) — a middle-class / working-renter tenant base. Strengths: crime A+, cost of living A+, housing A+; Watch: amenities F, commute F, health & safety F.
- Verdigris (rural): math 33% / reading 34% proficiency, ranked #29 of 270 in OK (top 11%) — families likely to look elsewhere, expect single-tenant / working-renter base with shorter leases; only 19% free/reduced lunch — higher-income household profile.
- Market conditions: 118 active listings in the ZIP; 1 comparable units currently listed for rent nearby; solid renter incomes; 608 units permitted in Rogers County in 2024 (7 in 5+ unit buildings).
Forward outlook
- Local home prices are declining (-3.0%/yr); year-one equity from $69 of loan paydown is wiped out by about $300 of value loss. Plan a longer hold.
- Rogers County population projected at +16% by 2050 — long-run rental-demand tailwind backs the buy-and-hold thesis.
- At projected returns (-3.0% appreciation + 3.0% rent growth), your $3k cash investment doubles in ~1 year — after that, you're playing with house money.
Negotiation context
- Only 8 days on market — expect competitive offers; lowballing is unlikely to land.
- 4 sale attempts since 21y ago with the ask held roughly flat each time — persistent listings suggest the price (not the market) is what's stuck; bring a comps-based counter.
Risks & watch-outs
- Climate carrying-cost: extreme-heat days projected 7→20/yr by 2055 (HVAC capex compounding) — expect insurance premiums to compound above CPI over the hold.
Questions for the listing agent
- Is there a deadline driving the sale (1031 exchange, divorce, estate, relocation)? That informs how much negotiation room exists.
- Schools are B-rated — typically a magnet for longer-tenancy family renters. What's the average tenant stay here, and is there a school-zone premium baked into asking?
- The area grade is low — what's the realistic commute time and amenity access for the typical tenant pool here? Any planned neighborhood developments (good or bad) we should know about?
- What's the average days-on-market for RENTAL listings here right now (not sales)? A rising rental-DOM trend means longer vacancies and softer asking-rent achievability than the comps imply.
- What's the recent tenant-quality profile in this submarket — average credit score on applications, eviction rate, late-payment / NSF rate, and stable-employment percentage? A property-management company in the area should have these aggregated.
- How much new for-sale + rental construction is in the pipeline within 1–3 miles? Heavy new supply typically softens prices + rents 12–24 months out; constrained supply supports both.
Investment metrics
- 1% rule
- 15.72% ✓
- Cap rate
- 147.07%
- Cash-on-cash
- 502.76%
- DSCR
- 23.37
- GRM
- 0.5
CMA / ARV
- ARV (on-the-fly)
- $208,332
- Comps found
- 12
Show comp detail 12 sales within ~0.75 mi
| Address | Dist | Beds/Ba | Sqft | Sold | Price | $/sf | Match |
|---|---|---|---|---|---|---|---|
| 9415 E Sprucewood Dr | 0.00mi | 3/2.0 | 1,286 (0%) | 3mo | $224,450 | $175 | 98 |
| 29412 S Eastwood Dr | 0.18mi | 3/2.0 | 1,279 (-0%) | 10mo | $219,000 | $171 | 82 |
| 9497 E Magnolia Wood Dr | 0.11mi | 3/2.0 | 1,379 (+7%) | 7mo | $220,000 | $160 | 77 |
| 24922 S Heartwood Dr | 0.16mi | 3/2.0 | 1,401 (+9%) | 1mo | $185,000 | $132 | 76 |
| 24892 S Heartwood Dr | 0.13mi | 3/2.0 | 1,404 (+9%) | 12mo | $225,000 | $160 | 69 |
| 25103 S Roselake Dr | 0.43mi | 3/2.0 | 1,202 (-6%) | 10mo | $215,000 | $179 | 60 |
| 9333 E Apple Ln | 0.37mi | 3/2.0 | 1,442 (+12%) | 4mo | $223,000 | $155 | 59 |
| 9697 E Turtle Dr | 0.36mi | 3/2.0 | 1,423 (+11%) | 8mo | $219,000 | $154 | 58 |
| 25082 S Brook Ln | 0.38mi | 3/2.0 | 1,152 (-10%) | 9mo | $213,000 | $185 | 58 |
| 9325 E 530 Rd | 0.26mi | 2/1.0 (-1) | 1,141 (-11%) | 8mo | $170,000 | $149 | 54 |
| 9488 E Mulberry Ln | 0.44mi | 3/2.0 | 1,451 (+13%) | 15mo | $235,000 | $162 | 46 |
| 25406 S Valley Dr | 0.71mi | 3/2.0 | 1,460 (+14%) | 1mo | $249,900 | $171 | 43 |
Match score weights: distance 35% · size 25% · config 20% · recency 20%. Top-matched comps best support the ARV.
Projected returns pro-forma
-3.0% appreciation · 3.0% rent growth · sell at horizon
- IRR
- —
- Equity multiple
- 27.11×
- Total profit
- $73,119
- Equity at exit
- $1,491
- IRR
- —
- Equity multiple
- 58.13×
- Total profit
- $159,975
- Equity at exit
- $865
Cash invested: $2,800 (down + closing). Projections, not guarantees.
Landlord ↔ Tenant lean methodology
- Overall (STATE)
- 83 Strongly Landlord-Friendly
- State Oklahoma
- 83 Strongly Landlord-Friendly · R+20
- County
- — inherits STATE
- City
- — inherits STATE
ZIP-level market 74019
- Home prices YoY
- -13.2%
- Active inventory
- 118
- Price-to-rent
- 0.5×
Monthly cashflow live
- Estimated rent
- $1,572 medium interval (Pro) →
- Mortgage (P&I)
- −$52
- Tax est. 1.5%
- −$12 /mo · $150/yr
- Insurance
- −$4
- HOA
- −$0
- Vacancy / Maint / Mgmt
- −$330
- Net cashflow
- $1,173
Break-even live
Sensitivity live
| Price | -10% $1,180 | -5% $1,177 | +0% $1,173 | +5% $1,170 | +10% $1,166 |
|---|---|---|---|---|---|
| Rent | -10% $1,049 | -5% $1,111 | +0% $1,173 | +5% $1,235 | +10% $1,297 |
| Rate | -1.0pp $1,178 | -0.5pp $1,176 | base $1,173 | +0.5pp $1,171 | +1.0pp $1,168 |
UW: 25.0% down · 7.5% · 30yr · 1.5% tax · 5.0% vac · 8.0% maint · 8.0% mgmt
Financing live
Cash to close
- Down payment
- $2,500
- Closing costs
- $300
- Reserves months
- —
- Total cash needed
- —
Loan-product check · same deal, 3 products live
Conventional
25% down · 7.5% · 30yr
- Down + closing
- —
- Monthly P&I
- —
- Monthly cashflow
- —
- DSCR
- —
- Eligible?
- —
Personal DTI + credit; lowest rate.
DSCR
20% down · 8.5% · 30yr
- Down + closing
- —
- Monthly P&I
- —
- Monthly cashflow
- —
- DSCR
- —
- Eligible?
- —
No personal income docs; deal must DSCR.
Hard money
10% down · 12.0% · 12mo
- Down + closing
- —
- Monthly P&I
- —
- Monthly cashflow
- —
- DSCR
- —
- Eligible?
- —
Short-term bridge; refi at stabilization.
Rent comps 1 comps
| Address | Beds | Baths | Sqft | Rent | $/sqft | DOM | Units | Dist |
|---|---|---|---|---|---|---|---|---|
| 24103 U.S. Route 66 Claremore, OK | 3.0 | 2.0 | 1203 | $1,450 | $1.21 | 2d | 1 | 0.84mi |
Listing history 6 events
-
2026-06-15days on market $10,000 Active 8 DOM
-
2026-06-13days on market $10,000 Active 6 DOM
-
2026-06-10days on market $10,000 Active 3 DOM
-
2026-06-09days on market $10,000 Active 2 DOM
-
2026-06-08remarks 195-char remark
-
2026-06-08$10,000 Active 1 DOM
ⓘ Source: listings_history table (triggers on properties + properties_extension) + one-shot
backfill from property_details.listing_events for pre-trigger history.
Climate risk First Street
- Flood 1/10 Low FEMA zone X (unshaded) · 0% chance over 30 yrs
- Wildfire 4/10 Moderate
- Heat 7/10 Severe 7 d/yr ≥110°F today · 20 d/yr by 30 yrs out
- Wind 2/10 Low 3% chance of damaging wind over 30 yrs
- Air quality 2/10 Low 2 unhealthy d/yr today · 2 by 30 yrs out
Nearby sold comps map
Loading sold comps map…
Walkable amenities ~0.75 mi
Loading nearby amenities…
Taxation est. · year 1
- Rental income
- $18,869
- − Mortgage interest
- −$560
- − Property taxes
- −$150
- − Insurance
- −$50
- − Repairs & maintenance
- −$1,510
- − Management
- −$1,510
- − Depreciation
- −$291
- Taxable income
- $14,799
- Est. tax owed @ 24.0%
- −$3,552
- After-tax cash flow
- $10,526/yr
For passive investors: Depreciation is non-cash, so a rental often shows a tax loss while cash-flowing — sheltering income. Rental losses are passive: they offset passive income freely, and up to $25,000/yr can offset ordinary (W-2) income if you actively participate and your MAGI is under $100k (phasing out to $0 by $150k); unused losses carry forward. On sale, claimed depreciation is recaptured at up to 25%, and gains may owe capital-gains tax (a 1031 exchange can defer both). Figures are a year-1 estimate at your 24.0% rate — not tax advice; consult a CPA.
Schools (NCES district)
- District
- Verdigris
- NCES district ID
- 4031110
- Math proficiency
- 33% ▼ -10.00%
- Reading proficiency
- 34% ▼ -10.00%
- Median HH income
- $67,371
- Composite
- 30.77/100
- National rank
- #6156
- State rank
- #29 of 270 in OK
Livability — Verdigris
- Score
- 70/100
- State rank
- #40
- US rank
- #7775
Category grades
Schools grade is shown separately in the Schools card above.
Census & demographics
- Census place
- Verdigris, OK
- County
- Rogers County · 50,229 people
- Metro
- Tulsa, OK
- Population (ZIP)
- 21,023
- Household income
- $84,342
- Rent vs Own
- Severe rent burden
- 150.0
Population outlook (Rogers County) Hauer SSP2
- Today (2025)
- 100,211 people
- By 2030
- 104,381 · +4.2%
- By 2040
- 111,567 · +11.3%
- By 2050
- 116,791 · +16.5%
- By 2075
- 129,134 · +28.9%
- By 2100
- 132,326 · +32.0%
Race, ethnicity, and origin ACS 2023
- Neighborhood character
- Predominantly White (70%)
- Race & ethnicity
- White 70% Native American 13% Two or more races 11% Hispanic / Latino 6% Asian 1%
- Hispanic origin (detail)
- Mexican 5%
- Common ancestry
- Lithuanian 2% Romanian 2% Slovak 2%
- Foreign-born
- 3% · Canada, Vietnam
- Languages at home
- 95% English-only · Spanish 3% Other Asian/Pacific 1%
Political lean MEDSL · Rogers
- 2024 margin
- Solid R (+55.0) · D 21.6% · R 76.6% · Other 1.7%
- 2008→2024 swing
- -10.9pp toward R · 2008: -44.1pp · 2024: -55.0pp
- All cycles
- 2024: R+55.0 2020: R+54.9 2016: R+56.3 2012: R+50.1 2008: R+44.1
Not yet ingested
- Civics
- —
Market trends
- HPI YoY
- ▼ -32.22%
- Current HPI
- 210.9691
- Rent YoY
- —
- Metro
- Tulsa, OK
- State GDP YoY
- ▲ 1.55%
- F500 in state
- 6
Industry mix (Fortune 500 HQ in OK)
| Industry | F500 HQs | Revenue |
|---|---|---|
| Energy | 3 | $48B |
|
||
Price history
-84.6% since first listed13 events — show timeline
- 2026-06-08 Listed $10,000 FSBO.com
- 2026-03-30 Sold (Public Records) $224,500 Public Records
- 2026-03-25 Sold (MLS) $224,450 MLS Technology, Inc.
- 2026-02-09 Pending — MLS Technology, Inc.
- 2026-02-06 Listed $224,450 MLS Technology, Inc.
- 2013-07-12 Sold (Public Records) $109,500 Public Records
- 2013-07-11 Sold (MLS) $109,400 MLS Technology, Inc.
- 2013-06-17 Listing Removed — MLS Technology, Inc.
- 2013-04-09 Listed $107,900 MLS Technology, Inc.
- 2005-12-31 Listing Removed — MLS Technology, Inc.
- 2005-06-30 Listed $104,500 MLS Technology, Inc.
- 2003-05-01 Sold (Public Records) $97,500 Public Records
- 1996-12-01 Sold (Public Records) $65,000 Public Records
Property tax history
+2.7%/yrLatest (2025): $1,376 · +12.5% YoY. Source: county tax records.
Cash-flow waterfall
monthlySold comps — $/sqft
last 12 mo · ≤1 miLoading sold comps…