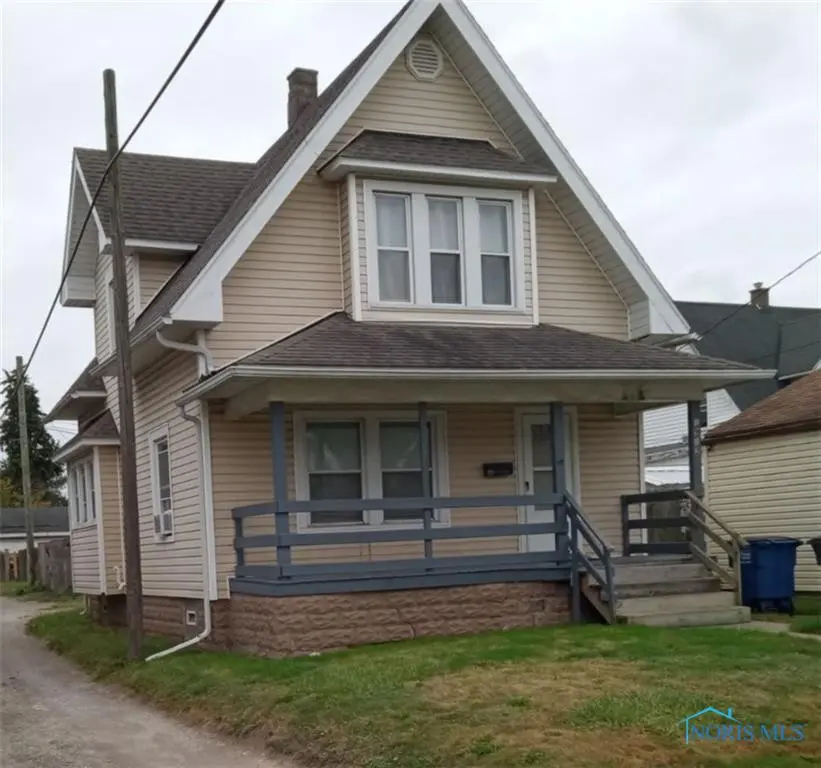
1912 Greenwood Ave · Toledo, OH
Flood risk 1/10 · Minimal
- FEMA flood zone
- X (unshaded)
- Chance of flooding over 30 yrs
- 0.0%
- Est. flood insurance / yr
- $473 – $860
Fire risk 1/10 · Minimal
- Est. fire insurance / yr
- $713 – $1,323
Heat risk 3/10 · Minor
- Hot days now (above 100°F)
- 7 days/yr
- Hot days in 30 yrs
- 16 days/yr
Wind risk 2/10 · Minimal
- Chance of severe wind over 30 yrs
- —
Air-quality risk 2/10 · Minimal
- Unhealthy air days now
- 1 days/yr
- Unhealthy air days in 30 yrs
- 2 days/yr
Risk factors via First Street. Map © Google.
Why this score? — see what drove the C grade
The composite is a weighted blend of 9 inputs, each scored 0–100. Each bar is that input's sub-score; the figure is the points it added to the 100-point composite (weight × sub-score).
- Cash flow +30.0/30.0
- DSCR +10.0/10.0
- 1% rule +7.9/10.0
- Rent growth +3.8/5.0
- Livability +3.3/5.0
- Condition / age +2.5/5.0
- Schools +1.6/10.0
- ARV discount +0.0/15.0
- Appreciation +0.0/10.0
$85,000
🖨 Deal sheet (PDF) 📄 Offer letter ✓ Due diligence
Listing remarks MLS
NOTICE: We are not considering seller financing or creative financing offers that do not consist of us in recorded first lien position with a minimum of 30% down. Thank you for understanding! This property is being sold as part of an 46-unit portfolio or a 5-unit sub-portfolio. In place cap is ~8.5%, pro forma cap is ~11.0%, and occupancy is 100%. Asking price for the 46-unit portfolio is $3.57M and asking price for the 11-unit sub-portfolio is $1,045,000. The sub-portfolio includes 549 Spencer, 560 Williamsville, 26 Magyar, 3256 Jeannette, 1413 Colburn, 1912 Greenwood, 2074 Price, 4321 Burnham, 4345 Burnham, 615 Cuthbert Rd, and 4228 N Lockwood. The entire 46-unit list can be found in the attachments. Property is occupied and photos are from the last time it was vacant.
Key facts
- 2,801 sq ft lot
- Built 1907
- Listed 263 days
Neighborhood map
What this means for you Summary
Snapshot
- This is a 3-bed/1.0-bath single-family listed at $85k.
Deal economics
- At list price, monthly cash flow is $317 ($4k/yr) — positive.
- The deal already cash-flows at list — no discount required.
- Meets the 1% rule at list price ($1k rent vs $85k).
- Recommended offer: $75k (12.0% below list) — sets the bar for market timing.
- Cap rate 10.8% vs local median 7.5% in Toledo — top-decile yield for the area; either an underpriced asset or a hidden risk that comps aren't pricing in. Stress-test before assuming the spread holds.
Location & tenants
- Location reads 66/100 on livability (#645 in OH) — a middle-class / working-renter tenant base. Strengths: cost of living A+, housing A+, health & safety A+; Watch: amenities C-, crime F, commute F.
- Toledo City (urban): math 15% / reading 24% proficiency, ranked #634 of 656 in OH (top 97%) — low school quality limits family demand, transient renter base, plan for 1-2y turnover; 72% free/reduced lunch — lower-income household profile, screen leases tightly.
- Zoned schools: Grove Patterson Academy Elementary School (math 47% / reading 66%, grade C+, #761 of 1,584 statewide, top 48%, 403 students, 38% FRL); Waite High School (math 12% / reading 24%, grade F, #687 of 781 statewide, top 88%, 997 students, 0% FRL) — zoned schools average 19% FRL vs 72% district-wide (53 pts lower); this property's tenant base skews higher-income than the district average.
- Zoned-school proficiency averages 37% at this address vs 20% district-wide (+18 pts) — the actual schools serving this property are materially stronger than the Toledo City average implies; a family-tenant draw the district grade alone would hide.
- Market conditions: Rents rising fast (+5.4%/yr); 118 active listings in the ZIP; 40 comparable units currently listed for rent nearby; rentals at typical pace (median 25d on market — plan ~3-4 weeks tenant-placement turnaround); 45% of comp listings sitting > 30 days — soft ceiling on asking rent; lower-income renter base — watch delinquency; 415 units permitted in Lucas County in 2024 (122 in 5+ unit buildings).
- This rent runs 34% of the median local income ($39k/yr) — at the standard rent-burdened threshold; future hikes will face affordability resistance.
Forward outlook
- Local home prices are declining (-3.0%/yr); year-one equity from $588 of loan paydown is wiped out by about $3k of value loss. Plan a longer hold.
- Lucas County population projected at -16% by 2050 — secular population decline; favor cash flow + early exit over multi-decade hold.
- At projected returns (-3.0% appreciation + 5.4% rent growth), your $24k cash investment doubles in ~7 years — after that, you're playing with house money.
Negotiation context
- It's been on market 263 days — a 12% lower offer ($75k) is reasonable based on typical stale-listing flexibility.
- 4 sale attempts since 18y ago with the ask held roughly flat each time — persistent listings suggest the price (not the market) is what's stuck; bring a comps-based counter.
Risks & watch-outs
- Watch-outs: built in 1907 — expect roof / HVAC / electrical / plumbing capex.
Questions for the listing agent
- It's been on market 263 days. Have you received any prior offers? Is the seller open to a 12% concession, seller financing, or rate buy-down credit?
- Built in 1907 — when were the roof, HVAC, electrical panel, plumbing, and water heater last replaced?
- Why hasn't it sold? Are there any deal-killer items the seller is aware of (foundation, flood, title, zoning, code violations)?
- Is there a deadline driving the sale (1031 exchange, divorce, estate, relocation)? That informs how much negotiation room exists.
- Schools are D-rated, which usually means shorter tenancies and higher turnover. Who's the typical renter profile here, and what's been the actual vacancy rate?
- Crime grade is F in this area — have there been break-ins, vandalism, or insurance claims at this property in the last 3 years? What carrier currently insures it and at what premium?
- What's the average days-on-market for RENTAL listings here right now (not sales)? A rising rental-DOM trend means longer vacancies and softer asking-rent achievability than the comps imply.
- What's the recent tenant-quality profile in this submarket — average credit score on applications, eviction rate, late-payment / NSF rate, and stable-employment percentage? A property-management company in the area should have these aggregated.
- How much new for-sale + rental construction is in the pipeline within 1–3 miles? Heavy new supply typically softens prices + rents 12–24 months out; constrained supply supports both.
Investment metrics
- 1% rule
- 1.29% ✓
- Cap rate
- 10.77%
- Cash-on-cash
- 15.99%
- DSCR
- 1.71
- GRM
- 6.5
CMA / ARV
- ARV (median comp)
- $59,531
- List price
- $85,000
- Delta
- 42.78%
- Verdict
- OVERPRICED
- Comps
- 20 within 1.0 mi
Show comp detail 12 sales within ~0.75 mi
| Address | Dist | Beds/Ba | Sqft | Sold | Price | $/sf | Match |
|---|---|---|---|---|---|---|---|
| 463 Howland Ave | 0.05mi | 3/1.0 | 1,027 (-8%) | 4mo | $65,000 | $63 | 80 |
| 2017 Kelsey Ave | 0.34mi | 3/1.0 | 1,152 (+3%) | 2mo | $119,900 | $104 | 79 |
| 2003 Idaho St | 0.24mi | 3/1.0 | 1,172 (+4%) | 5mo | $120,000 | $102 | 77 |
| 429 Dover Pl | 0.29mi | 3/1.0 | 1,155 (+3%) | 6mo | $66,000 | $57 | 77 |
| 1940 Hurd St | 0.19mi | 3/1.0 | 1,200 (+7%) | 4mo | $99,900 | $83 | 77 |
| 256 Midvale Ave | 0.32mi | 3/1.0 | 1,180 (+5%) | 4mo | $137,300 | $116 | 73 |
| 1012 Idaho St | 0.61mi | 3/1.0 | 1,041 (-7%) | 1mo | $84,900 | $82 | 59 |
| 1133 Nevada St | 0.47mi | 2/1.0 (-1) | 1,044 (-7%) | 4mo | $36,000 | $34 | 58 |
| 328 White St | 0.40mi | 2/1.0 (-1) | 1,000 (-11%) | 1mo | $39,900 | $40 | 57 |
| 590 Sylvandale Ave | 0.70mi | 3/1.0 | 1,193 (+6%) | 5mo | $180,000 | $151 | 53 |
| 444 Raymer Blvd | 0.29mi | 2/1.5 (-1) | 1,283 (+14%) | 5mo | $90,000 | $70 | 52 |
| 1129 Camden St | 0.63mi | 3/1.0 | 1,260 (+12%) | 4mo | $55,000 | $44 | 47 |
Match score weights: distance 35% · size 25% · config 20% · recency 20%. Top-matched comps best support the ARV.
Projected returns pro-forma
-3.0% appreciation · 5.37% rent growth · sell at horizon
- IRR
- 9.4%
- Equity multiple
- 1.38×
- Total profit
- $9,086
- Equity at exit
- $12,674
- IRR
- 20.4%
- Equity multiple
- 2.91×
- Total profit
- $45,384
- Equity at exit
- $7,349
Cash invested: $23,800 (down + closing). Projections, not guarantees.
Landlord ↔ Tenant lean methodology
- Overall (STATE)
- 73 Landlord-Friendly
- State Ohio
- 73 Landlord-Friendly · R+6
- County
- — inherits STATE
- City
- — inherits STATE
ZIP-level market 43605
- Home prices YoY
- -25.6%
- Rents YoY
- 5.4%
- Active inventory
- 118
- Price-to-rent
- 6.5×
Monthly cashflow live
- Estimated rent
- $1,093 high interval (Pro) →
- Mortgage (P&I)
- −$446
- Tax from tax record
- −$66 /mo · $786/yr
- Insurance
- −$35
- HOA
- −$0
- Vacancy / Maint / Mgmt
- −$230
- Net cashflow
- $317
Break-even live
Sensitivity live
| Price | -10% $365 | -5% $341 | +0% $317 | +5% $293 | +10% $269 |
|---|---|---|---|---|---|
| Rent | -10% $231 | -5% $274 | +0% $317 | +5% $360 | +10% $404 |
| Rate | -1.0pp $360 | -0.5pp $339 | base $317 | +0.5pp $295 | +1.0pp $273 |
UW: 25.0% down · 7.5% · 30yr · 1.5% tax · 5.0% vac · 8.0% maint · 8.0% mgmt
Financing live
Cash to close
- Down payment
- $21,250
- Closing costs
- $2,550
- Reserves months
- —
- Total cash needed
- —
Loan-product check · same deal, 3 products live
Conventional
25% down · 7.5% · 30yr
- Down + closing
- —
- Monthly P&I
- —
- Monthly cashflow
- —
- DSCR
- —
- Eligible?
- —
Personal DTI + credit; lowest rate.
DSCR
20% down · 8.5% · 30yr
- Down + closing
- —
- Monthly P&I
- —
- Monthly cashflow
- —
- DSCR
- —
- Eligible?
- —
No personal income docs; deal must DSCR.
Hard money
10% down · 12.0% · 12mo
- Down + closing
- —
- Monthly P&I
- —
- Monthly cashflow
- —
- DSCR
- —
- Eligible?
- —
Short-term bridge; refi at stabilization.
Rent comps 40 comps
| Address | Beds | Baths | Sqft | Rent | $/sqft | DOM | Units | Dist |
|---|---|---|---|---|---|---|---|---|
| 508 Howland Ave Toledo, OH | 3.0 | 1.0 | 840 | $1,000 | $1.19 | 45d | 1 | 0.04mi |
| 571 Howland Ave Toledo, OH | 2.0 | 1.0 | 874 | $875 | $1.00 | 45d | 1 | 0.12mi |
| 557 Valleywood Dr Toledo, OH | 3.0 | 1.0 | 848 | $1,100 | $1.30 | 45d | 1 | 0.20mi |
| 1614 Nevada St Toledo, OH | 2.0 | 1.0 | 1172 | $1,000 | $0.85 | 22d | 1 | 0.21mi |
| 2074 Starr Ave Toledo, OH | 3.0 | 1.0 | 1115 | $1,025 | $0.92 | 25d | 1 | 0.27mi |
| 2129 Nevada St Toledo, OH | 3.0 | 1.0 | 1352 | $1,200 | $0.89 | 15d | 1 | 0.38mi |
| 223 Valleywood Dr Toledo, OH | 2.0 | 1.0 | 1098 | $1,099 | $1.00 | 25d | 1 | 0.42mi |
| 1505 Navarre Ave Toledo, OH | 3.0 | 1.0 | 1331 | $1,145 | $0.86 | 45d | 1 | 0.44mi |
| 1123 Nevada St Toledo, OH | 2.0 | 1.0 | 792 | $900 | $1.14 | 15d | 1 | 0.46mi |
| 722 Coyne Ave Toledo, OH | 2.0 | 1.0 | 900 | $1,000 | $1.11 | 15d | 1 | 0.48mi |
| 732 Coyne Ave Toledo, OH | 3.0 | 1.0 | 968 | $1,145 | $1.18 | 15d | 1 | 0.49mi |
| 724 Plymouth St Toledo, OH | 2.0 | 1.0 | 819 | $750 | $0.92 | 45d | 1 | 0.50mi |
| 948 White St Toledo, OH | 3.0 | 1.0 | 1024 | $1,135 | $1.11 | 15d | 1 | 0.58mi |
| 653 Oswald St Toledo, OH | 2.0 | 1.0 | 920 | $800 | $0.87 | 45d | 1 | 0.61mi |
| 1106 White St Toledo, OH | 3.0 | 1.0 | 1200 | $1,015 | $0.85 | 15d | 1 | 0.66mi |
| 221 Licking St Unit 2 Toledo, OH | 3.0 | 1.0 | 1048 | $1,099 | $1.05 | 25d | 1 | 0.78mi |
| 29 Garfield Pl Toledo, OH | 4.0 | 2.0 | 1300 | $1,250 | $0.96 | 15d | 1 | 0.78mi |
| 1306 Mott Ave Toledo, OH | 3.0 | 1.5 | 1282 | $1,149 | $0.90 | 45d | 1 | 0.80mi |
| 420 Platt St Toledo, OH | 2.0 | 1.0 | 1499 | $685 | $0.46 | 22d | 1 | 0.81mi |
| 414 Platt St Unit ST-3 Toledo, OH | 3.0 | 1.0 | 1500 | $1,150 | $0.77 | 25d | 1 | 0.81mi |
| 1305 Mott Ave Toledo, OH | 3.0 | 1.0 | 1080 | $1,000 | $0.93 | 45d | 1 | 0.82mi |
| 908 Forsythe St Unit Upstairs Toledo, OH | 2.0 | 1.0 | 1164 | $900 | $0.77 | 15d | 1 | 0.84mi |
| 908 Forsythe St Unit Downstairs Toledo, OH | 3.0 | 1.0 | 1164 | $950 | $0.82 | 45d | 1 | 0.84mi |
| 921 Berry St Toledo, OH | 4.0 | 1.0 | 1204 | $1,350 | $1.12 | 15d | 1 | 0.89mi |
| 128 Carbon St Toledo, OH | 3.0 | 1.0 | 1113 | $1,200 | $1.08 | 25d | 1 | 0.92mi |
| 470 2nd St Unit 1 Toledo, OH | 2.0 | 1.0 | 950 | $799 | $0.84 | 45d | 1 | 0.99mi |
| 537 Potter St Toledo, OH | 2.0 | 1.0 | 1200 | $625 | $0.52 | 25d | 1 | 0.99mi |
| 1205 Liberty St Unit NA Toledo, OH | 3.0 | 1.0 | 864 | $1,195 | $1.38 | 45d | 1 | 1.01mi |
| 946 Butler St Toledo, OH | 2.0 | 1.0 | 944 | $650 | $0.69 | 45d | 1 | 1.08mi |
| 1848 Genesee St Toledo, OH | 3.0 | 1.0 | 1069 | $1,200 | $1.12 | 45d | 1 | 1.12mi |
| 1848 Genesee St Toledo, OH | 3.0 | 1.0 | 1069 | $1,300 | $1.22 | 25d | 1 | 1.12mi |
| 834 Oak St Toledo, OH | 3.0 | 1.0 | 1064 | $900 | $0.85 | 45d | 1 | 1.16mi |
| 1964 Burr St Toledo, OH | 3.0 | 1.0 | 1159 | $1,250 | $1.08 | 45d | 1 | 1.17mi |
| 625 Riverside Dr Toledo, OH | 1.0–2.0 | 1.0–2.0 | 860 | $1,767 | $2.05 | 15d | 37 | 1.22mi |
| 950 Oak St Unit 1 Toledo, OH | 2.0 | 1.0 | 725 | $700 | $0.97 | 45d | 1 | 1.25mi |
| 1103 S Wheeling St Oregon, OH | 2.0 | 1.0 | 825 | $1,049 | $1.27 | 45d | 1 | 1.29mi |
| 20 Greenwood Ave Toledo, OH | 3.0 | 1.0 | 1496 | $1,150 | $0.77 | 15d | 1 | 1.32mi |
| 1537 Carlyle St Toledo, OH | 2.0 | 1.0 | 800 | $800 | $1.00 | 25d | 1 | 1.36mi |
| 1119 N Summit St Toledo, OH | 2.0 | 2.0 | 1500 | $1,890 | $1.26 | 45d | 1 | 1.49mi |
| 1119 N Summit St Toledo, OH | 2.0 | 2.0 | 1226 | $1,750 | $1.43 | 25d | 1 | 1.49mi |
Listing history 30 events
-
2026-06-21days on market $85,000 Active 263 DOM
-
2026-06-18days on market $85,000 Active 260 DOM
-
2026-06-17days on market $85,000 Active 259 DOM
-
2026-06-16days on market $85,000 Active 258 DOM
-
2026-06-15days on market $85,000 Active 257 DOM
-
2026-06-14days on market $85,000 Active 255 DOM
-
2026-06-10days on market $85,000 Active 252 DOM
-
2026-06-09days on market $85,000 Active 251 DOM
-
2026-06-08days on market $85,000 Active 250 DOM
-
2026-06-07days on market $85,000 Active 249 DOM
-
2026-06-05days on market $85,000 Active 246 DOM
-
2026-06-03days on market $85,000 Active 245 DOM
-
2026-06-02days on market $85,000 Active 244 DOM
-
2026-06-01days on market $85,000 Active 243 DOM
-
2026-05-31days on market $85,000 Active 242 DOM
-
2026-05-30days on market $85,000 Active 241 DOM
-
2026-01-14price $94,000 783-char remark
Show marketing remark (783 chars)
NOTICE: We are not considering seller financing or creative financing offers that do not consist of us in recorded first lien position with a minimum of 30% down. Thank you for understanding! This property is being sold as part of an 46-unit portfolio or a 5-unit sub-portfolio. In place cap is ~8.5%, pro forma cap is ~11.0%, and occupancy is 100%. Asking price for the 46-unit portfolio is $3.57M and asking price for the 11-unit sub-portfolio is $1,045,000. The sub-portfolio includes 549 Spencer, 560 Williamsville, 26 Magyar, 3256 Jeannette, 1413 Colburn, 1912 Greenwood, 2074 Price, 4321 Burnham, 4345 Burnham, 615 Cuthbert Rd, and 4228 N Lockwood. The entire 46-unit list can be found in the attachments. Property is occupied and photos are from the last time it was vacant.
-
2025-11-10price $102,040 783-char remark
Show marketing remark (783 chars)
NOTICE: We are not considering seller financing or creative financing offers that do not consist of us in recorded first lien position with a minimum of 30% down. Thank you for understanding! This property is being sold as part of an 46-unit portfolio or a 5-unit sub-portfolio. In place cap is ~8.5%, pro forma cap is ~11.0%, and occupancy is 100%. Asking price for the 46-unit portfolio is $3.57M and asking price for the 11-unit sub-portfolio is $1,045,000. The sub-portfolio includes 549 Spencer, 560 Williamsville, 26 Magyar, 3256 Jeannette, 1413 Colburn, 1912 Greenwood, 2074 Price, 4321 Burnham, 4345 Burnham, 615 Cuthbert Rd, and 4228 N Lockwood. The entire 46-unit list can be found in the attachments. Property is occupied and photos are from the last time it was vacant.
-
2025-10-13price $12,000 286-char remark
Show marketing remark (286 chars)
Nice 3 bedroom home with updated kitchen, newer furnace and Central Air. Newer siding, glass block windows in basement, off street parking and room to build your own garage. Formal Living and dining rooms. Open kitchen with newer cabinets overlooks dining room area. Just make an offer!
-
2025-10-03price $109,500 783-char remark
Show marketing remark (783 chars)
NOTICE: We are not considering seller financing or creative financing offers that do not consist of us in recorded first lien position with a minimum of 30% down. Thank you for understanding! This property is being sold as part of an 46-unit portfolio or a 5-unit sub-portfolio. In place cap is ~8.5%, pro forma cap is ~11.0%, and occupancy is 100%. Asking price for the 46-unit portfolio is $3.57M and asking price for the 11-unit sub-portfolio is $1,045,000. The sub-portfolio includes 549 Spencer, 560 Williamsville, 26 Magyar, 3256 Jeannette, 1413 Colburn, 1912 Greenwood, 2074 Price, 4321 Burnham, 4345 Burnham, 615 Cuthbert Rd, and 4228 N Lockwood. The entire 46-unit list can be found in the attachments. Property is occupied and photos are from the last time it was vacant.
-
2025-09-24$86,500 Active 783-char remark
Show marketing remark (783 chars)
NOTICE: We are not considering seller financing or creative financing offers that do not consist of us in recorded first lien position with a minimum of 30% down. Thank you for understanding! This property is being sold as part of an 46-unit portfolio or a 5-unit sub-portfolio. In place cap is ~8.5%, pro forma cap is ~11.0%, and occupancy is 100%. Asking price for the 46-unit portfolio is $3.57M and asking price for the 11-unit sub-portfolio is $1,045,000. The sub-portfolio includes 549 Spencer, 560 Williamsville, 26 Magyar, 3256 Jeannette, 1413 Colburn, 1912 Greenwood, 2074 Price, 4321 Burnham, 4345 Burnham, 615 Cuthbert Rd, and 4228 N Lockwood. The entire 46-unit list can be found in the attachments. Property is occupied and photos are from the last time it was vacant.
-
2023-07-31soldstatus $1,315,000
-
2023-07-21soldstatus $46,964 Closed
-
2023-03-17status Pending
-
2023-03-17price $46,964
-
2023-02-19$25,000 Active
-
2011-12-08soldstatus $12,000 286-char remark
Show marketing remark (286 chars)
Nice 3 bedroom home with updated kitchen, newer furnace and Central Air. Newer siding, glass block windows in basement, off street parking and room to build your own garage. Formal Living and dining rooms. Open kitchen with newer cabinets overlooks dining room area. Just make an offer!
-
2010-11-01$19,900 286-char remark
Show marketing remark (286 chars)
Nice 3 bedroom home with updated kitchen, newer furnace and Central Air. Newer siding, glass block windows in basement, off street parking and room to build your own garage. Formal Living and dining rooms. Open kitchen with newer cabinets overlooks dining room area. Just make an offer!
-
2010-09-30historical
-
2008-09-15$37,900
ⓘ Source: listings_history table (triggers on properties + properties_extension) + one-shot
backfill from property_details.listing_events for pre-trigger history.
Tax reassessment forecast OH · Partial reset (capped growth)
- Current annual tax
- $786 · $66/mo
- Projected year-2 tax
- $1,056 · $88/mo
- Expected delta
- +$270/yr (+$22/mo · 34.3%)
ⓘ Screening estimate from a state-policy table — verify with the county assessor before closing.
Climate risk First Street
- Flood 1/10 Low FEMA zone X (unshaded) · 0% chance over 30 yrs
- Wildfire 1/10 Low
- Heat 3/10 Moderate 7 d/yr ≥100°F today · 16 d/yr by 30 yrs out
- Wind 2/10 Low
- Air quality 2/10 Low 1 unhealthy d/yr today · 2 by 30 yrs out
Nearby sold comps map
Loading sold comps map…
Walkable amenities ~0.75 mi
Loading nearby amenities…
Taxation est. · year 1
- Rental income
- $13,121
- − Mortgage interest
- −$4,761
- − Property taxes
- −$786
- − Insurance
- −$425
- − Repairs & maintenance
- −$1,050
- − Management
- −$1,050
- − Depreciation
- −$2,473
- Taxable income
- $2,577
- Est. tax owed @ 24.0%
- −$618
- After-tax cash flow
- $3,187/yr
For passive investors: Depreciation is non-cash, so a rental often shows a tax loss while cash-flowing — sheltering income. Rental losses are passive: they offset passive income freely, and up to $25,000/yr can offset ordinary (W-2) income if you actively participate and your MAGI is under $100k (phasing out to $0 by $150k); unused losses carry forward. On sale, claimed depreciation is recaptured at up to 25%, and gains may owe capital-gains tax (a 1031 exchange can defer both). Figures are a year-1 estimate at your 24.0% rate — not tax advice; consult a CPA.
Schools (NCES district)
- District
- Toledo City
- NCES district ID
- 3904490
- Math proficiency
- 15% ▼ -16.00%
- Reading proficiency
- 24% ▼ -13.00%
- Median HH income
- $32,137
- Composite
- 15.76/100
- National rank
- #9276
- State rank
- #634 of 656 in OH
Livability — Toledo
- Score
- 66/100
- State rank
- #645
- US rank
- #11442
Category grades
Schools grade is shown separately in the Schools card above.
Census & demographics
- Census place
- Toledo, OH
- County
- Lucas County · 380,724 people
- City population
- 280,811
- Metro
- Toledo, OH
- Population (ZIP)
- 24,441
- Household income
- $39,118
- Rent vs Own
- Severe rent burden
- 1257.0
Population outlook (Lucas County) Hauer SSP2
- Today (2025)
- 420,751 people
- By 2030
- 410,187 · -2.5%
- By 2040
- 384,019 · -8.7%
- By 2050
- 355,125 · -15.6%
- By 2075
- 291,683 · -30.7%
- By 2100
- 233,670 · -44.5%
Race, ethnicity, and origin ACS 2023
- Neighborhood character
- Diverse neighborhood (Simpson 0.61)
- Race & ethnicity
- White 57% Hispanic / Latino 21% Black 14% Two or more races 14%
- Hispanic origin (detail)
- Mexican 17% Puerto Rican 2%
- Common ancestry
- Romanian 3% Lithuanian 2% Portuguese 1%
- Foreign-born
- 3% · Canada
- Languages at home
- 91% English-only · Spanish 7% Arabic 1%
Political lean MEDSL · Lucas
- 2024 margin
- D (+12.6) · D 55.8% · R 43.2%
- 2008→2024 swing
- -18.9pp toward R · 2008: 31.4pp · 2024: 12.6pp
- All cycles
- 2024: D+12.6 2020: D+16.8 2016: D+17.4 2012: D+30.4 2008: D+31.4
Not yet ingested
- Civics
- —
Market trends
- HPI YoY
- ▼ -47.85%
- Current HPI
- 138.6894
- Rent YoY
- ▲ 5.37%
- Metro
- Toledo, OH
- State GDP YoY
- ▲ 1.98%
- F500 in state
- 48
Industry mix (Fortune 500 HQ in OH)
| Industry | F500 HQs | Revenue |
|---|---|---|
| Insurance | 3 | $145B |
|
||
| Industrial Machinery | 3 | $49B |
|
||
| Financial Services | 3 | $24B |
|
||
| Consumer Goods | 2 | $93B |
|
||
| Aerospace / Defense | 2 | $47B |
|
||
| Utilities | 2 | $33B |
|
||
Price history
+148.0% since first listed14 events — show timeline
- 2026-01-14 Price Changed $94,000 NORIS
- 2025-11-10 Price Changed $102,040 NORIS
- 2025-10-13 Price Changed $12,000 NORIS
- 2025-10-03 Price Changed $109,500 NORIS
- 2025-09-24 Listed $86,500 NORIS
- 2023-07-31 Sold (Public Records) $1,315,000 Public Records
- 2023-07-21 Sold (MLS) $46,964 NORIS
- 2023-03-17 Pending — NORIS
- 2023-03-17 Price Changed $46,964 NORIS
- 2023-02-19 Listed $25,000 NORIS
- 2011-12-08 Sold (MLS) $12,000 NORIS
- 2010-11-01 Listed $19,900 NORIS
- 2010-09-30 Listing Removed — NORIS
- 2008-09-15 Listed $37,900 NORIS
Property tax history
+6.4%/yrLatest (2025): $786 · +2.0% YoY. Source: county tax records.
Cash-flow waterfall
monthlySold comps — $/sqft
last 12 mo · ≤1 miLoading sold comps…