5100 SW 41st St #329 · Pembroke Park, FL
Flood risk 1/10 · Minimal
- FEMA flood zone
- X (unshaded)
- Chance of flooding over 30 yrs
- 0.0%
- Est. flood insurance / yr
- $507 – $1,088
Fire risk 1/10 · Minimal
- Est. fire insurance / yr
- $947 – $1,759
Heat risk 10/10 · Severe
- Hot days now (above 105°F)
- 7 days/yr
- Hot days in 30 yrs
- 25 days/yr
Wind risk 10/10 · Severe
- Chance of severe wind over 30 yrs
- 99.0%
Air-quality risk 2/10 · Minimal
- Unhealthy air days now
- 2 days/yr
- Unhealthy air days in 30 yrs
- 2 days/yr
Risk factors via First Street. Map © Google.
Why this score? — see what drove the C grade
The composite is a weighted blend of 9 inputs, each scored 0–100. Each bar is that input's sub-score; the figure is the points it added to the 100-point composite (weight × sub-score).
- Cash flow +21.7/30.0
- 1% rule +10.0/10.0
- ARV discount +7.5/15.0
- DSCR +6.9/10.0
- Schools +4.1/10.0
- Livability +3.5/5.0
- Rent growth +2.6/5.0
- Condition / age +2.5/5.0
- Appreciation +0.0/10.0
$159,000
🖨 Deal sheet 📄 Offer letter ✓ Due diligence
Listing remarks
Great investor opportunity. No rental restrictions. Corner unit with balcony. Recently remodeled and tiled throughout. Steady tenant with lease. Building underwent full 50 year restoration recently with 2 assigned parking spots.
Key facts
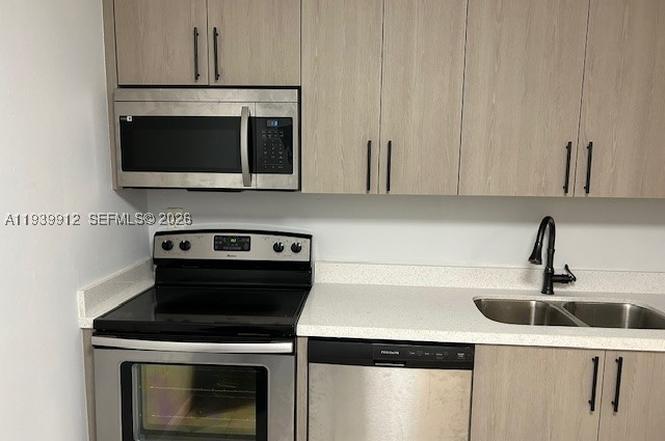
- Recently remodeled
- Balcony
- Corner unit
Tags
Property features AI
Finance
- Financial info: Pets allowed with size limit (maximum 20 lbs)
- HOA & community: Monthly association fee of $669; Association covers common areas, laundry, grounds maintenance, parking, sewer and trash; Community amenities include laundry and elevators
Exterior
- Parking: One parking space
- Security: Complex fenced
- Utilities: Central heating and cooling
- Home design: Attached property; 3-story building; Entry located on level 3
- Construction: Block construction; Resale property
- Exterior features: Balcony; Open balcony/patio; Complex is fenced
Interior
- Kitchen: Dishwasher; Electric range; Microwave; Refrigerator
- Flooring: Tile
- Bathrooms: 2 full bathrooms
- Heating & cooling: Central heating; Central air conditioning
- Interior features: Tile flooring
- Laundry & utility: Common area laundry
Neighborhood map
What this means for you Summary
Snapshot
- This is a 3-bed/2.0-bath condo listed at $159k.
Deal economics
- At list price, monthly cash flow is $244 ($3k/yr) — positive.
- The deal already cash-flows at list — no discount required.
- Meets the 1% rule at list price ($3k rent vs $159k).
- Recommended offer: $140k (12.0% below list) — sets the bar for market timing.
Location & tenants
- Location reads 69/100 on livability (#493 in FL) — a middle-class / working-renter tenant base. Strengths: cost of living A+, health & safety A+; Watch: schools C-, crime C-, housing C-.
- Broward (suburban): math 42% / reading 53% proficiency, ranked #46 of 73 in FL (top 63%) — families likely to look elsewhere, expect single-tenant / working-renter base with shorter leases.
- Market conditions: Rents flat; 286 active listings in the ZIP; 40 comparable units currently listed for rent nearby; rentals at typical pace (median 22d on market — plan ~3-4 weeks tenant-placement turnaround); 2,111 units permitted in Broward County in 2024 (1,265 in 5+ unit buildings).
- This rent runs 42% of the median local income ($75k/yr) — at the standard rent-burdened threshold; future hikes will face affordability resistance.
Forward outlook
- Local home prices are declining (-3.0%/yr); year-one equity from $1k of loan paydown is wiped out by about $5k of value loss. Plan a longer hold.
- Broward County population projected at +34% by 2050 — long-run rental-demand tailwind backs the buy-and-hold thesis.
Negotiation context
- It's been on market 157 days — a 12% lower offer ($140k) is reasonable based on typical stale-listing flexibility.
- 2 sale attempts since 11y ago; this cycle's ask has dropped $35k (18%) from the opening price — seller is motivated, your offer sets the floor, not the list.
Risks & watch-outs
- Watch-outs: HOA is 26% of rent.
- Climate carrying-cost: severe wind risk, 99% chance of damaging wind over 30y; extreme-heat days projected 7→25/yr by 2055 (HVAC capex compounding) — expect insurance premiums to compound above CPI over the hold.
Questions for the listing agent
- It's been on market 157 days. Have you received any prior offers? Is the seller open to a 12% concession, seller financing, or rate buy-down credit?
- Built in 1974 — when were the roof, HVAC, electrical panel, plumbing, and water heater last replaced?
- What does the HOA fee cover, when was the last increase, and are there any pending special assessments or reserve-fund shortfalls?
- Any open or pending special assessments — roof, HVAC, plumbing, elevator, façade? What's the per-unit balance and payoff schedule, and is the seller paying it off at close or rolling it to the buyer?
- Why hasn't it sold? Are there any deal-killer items the seller is aware of (foundation, flood, title, zoning, code violations)?
- Is there a deadline driving the sale (1031 exchange, divorce, estate, relocation)? That informs how much negotiation room exists.
- What's the average days-on-market for RENTAL listings here right now (not sales)? A rising rental-DOM trend means longer vacancies and softer asking-rent achievability than the comps imply.
- What's the recent tenant-quality profile in this submarket — average credit score on applications, eviction rate, late-payment / NSF rate, and stable-employment percentage? A property-management company in the area should have these aggregated.
- How much new apartment / multifamily construction is in the pipeline within 1–3 miles? Heavy new supply (>2% of stock underway) typically softens rents 12–24 months out; light construction supports rent growth.
Investment metrics
- 1% rule
- 1.64% ✓
- Cap rate
- 8.14%
- Cash-on-cash
- 6.58%
- DSCR
- 1.29
- GRM
- 5.1
CMA / ARV
No comps found within radius.
Projected returns pro-forma
-3.0% appreciation · 0.34% rent growth · sell at horizon
- IRR
- -10.6%
- Equity multiple
- 0.63×
- Total profit
- $-16,530
- Equity at exit
- $23,707
- IRR
- -8.3%
- Equity multiple
- 0.58×
- Total profit
- $-18,873
- Equity at exit
- $13,747
Cash invested: $44,520 (down + closing). Projections, not guarantees.
Landlord ↔ Tenant lean methodology
- Overall (STATE)
- 87 Strongly Landlord-Friendly
- State Florida
- 87 Strongly Landlord-Friendly · R+3
- County
- — inherits STATE
- City
- — inherits STATE
ZIP-level market 33023
- Rents YoY
- 0.3%
- Active inventory
- 286
- Price-to-rent
- 5.1×
Monthly cashflow live
- Estimated rent
- $2,608 high interval (Pro) →
- Mortgage (P&I)
- −$834
- Tax from tax record
- −$247 /mo · $2,969/yr
- Insurance
- −$66
- HOA
- −$669
- Vacancy / Maint / Mgmt
- −$548
- Net cashflow
- $244
Break-even live
UW: 25.0% down · 7.5% · 30yr · 1.5% tax · 5.0% vac · 8.0% maint · 8.0% mgmt
Financing live
Cash to close
- Down payment
- $39,750
- Closing costs
- $4,770
- Reserves months
- —
- Total cash needed
- —
Loan-product check · same deal, 3 products live
Conventional
25% down · 7.5% · 30yr
- Down + closing
- —
- Monthly P&I
- —
- Monthly cashflow
- —
- DSCR
- —
- Eligible?
- —
Personal DTI + credit; lowest rate.
DSCR
20% down · 8.5% · 30yr
- Down + closing
- —
- Monthly P&I
- —
- Monthly cashflow
- —
- DSCR
- —
- Eligible?
- —
No personal income docs; deal must DSCR.
Hard money
10% down · 12.0% · 12mo
- Down + closing
- —
- Monthly P&I
- —
- Monthly cashflow
- —
- DSCR
- —
- Eligible?
- —
Short-term bridge; refi at stabilization.
Rent comps 40 comps
| Address | Beds | Baths | Sqft | Rent | $/sqft | DOM | Units | Dist |
|---|---|---|---|---|---|---|---|---|
| 5100 SW 41st St Pembroke Park, FL | 1.0–2.0 | 1.0–2.0 | 815 | $1,799 | $2.21 | 4d | 4 | 0.05mi |
| 5100 SW 41st St Pembroke Park, FL | 1.0–2.0 | 1.0–2.0 | 815 | $1,750 | $2.15 | 19d | 3 | 0.05mi |
| 3926 SW 52nd Ave Unit E5 Hollywood, FL | 3.0 | 2.5 | 1335 | $2,500 | $1.87 | 24d | 1 | 0.16mi |
| 5525 SW 41st St Hollywood, FL | 2.0 | 2.0 | 1031 | $2,145 | $2.08 | 3d | 1 | 0.17mi |
| 3840 SW 52nd Ave Hollywood, FL | 3.0 | 2.5 | 1264 | $2,650 | $2.10 | 24d | 1 | 0.19mi |
| 3842 SW 48th Ave Hollywood, FL | 2.0 | 2.0 | 966 | $2,000 | $2.07 | 24d | 1 | 0.21mi |
| 3856 SW 48th Ave #3856 Pembroke Park, FL | 2.0 | 2.0 | 950 | $2,150 | $2.26 | 17d | 1 | 0.22mi |
| 3838 SW 48th Ave Unit 3838 Pembroke Park, FL | 2.0 | 2.0 | 966 | $2,200 | $2.28 | 24d | 1 | 0.22mi |
| 3828 SW 48th Ave Unit D27 Hollywood, FL | 2.0 | 2.0 | 950 | $2,300 | $2.42 | 24d | 1 | 0.23mi |
| 5085 SW 37th St Unit 5085 West Park, FL | 3.0 | 2.5 | 1276 | $3,200 | $2.51 | 15d | 1 | 0.24mi |
| 5085 SW 37th St West Park, FL | 3.0 | 2.5 | 1276 | $3,200 | $2.51 | 5d | 1 | 0.24mi |
| 3874 SW 48th Ave #3874 Pembroke Park, FL | 2.0 | 2.0 | 950 | $2,150 | $2.26 | 7d | 1 | 0.25mi |
| 5460 SW 38th Ct West Park, FL | 2.0 | 1.0 | 890 | $2,350 | $2.64 | 24d | 1 | 0.25mi |
| 3826 SW 48th Ave Unit 3826 Pembroke Park, FL | 2.0 | 2.0 | 950 | $2,200 | $2.32 | 15d | 1 | 0.26mi |
| 3826 SW 48th Ave Unit 3826 Pembroke Park, FL | 2.0 | 2.0 | 950 | $2,200 | $2.32 | 5d | 1 | 0.26mi |
| 4410 SW 39th St Unit 4410 West Park, FL | 2.0 | 1.0 | 1135 | $2,700 | $2.38 | 2d | 1 | 0.43mi |
| 6130 SW 36th Ct #8 West Park, FL | 3.0 | 2.5 | 1528 | $2,995 | $1.96 | 22d | 1 | 0.52mi |
| 3708 SW 58th Ave West Park, FL | 3.0 | 2.0 | 1800 | $2,800 | $1.56 | 24d | 1 | 0.54mi |
| 4628 SW 32nd Dr West Park, FL | 3.0 | 1.0 | 1082 | $2,800 | $2.59 | 24d | 1 | 0.65mi |
| 112 Newton Rd West Park, FL | 4.0 | 1.0 | 1086 | $3,090 | $2.85 | 24d | 1 | 0.66mi |
| 4331 SW 31st Dr West Park, FL | 3.0 | 1.0 | 1130 | $3,350 | $2.96 | 24d | 1 | 0.68mi |
| 4141 SW 32nd Dr West Park, FL | 3.0 | 1.0 | 1048 | $2,700 | $2.58 | 7d | 1 | 0.70mi |
| 4141 SW 32nd Dr West Park, FL | 3.0 | 1.0 | 1048 | $2,700 | $2.58 | 24d | 1 | 0.70mi |
| 3610 SW 39th Ave Unit 3610 West Park, FL | 3.0 | 2.0 | 1157 | $3,600 | $3.11 | 7d | 1 | 0.76mi |
| 3610 SW 39th Ave West Park, FL | 3.0 | 2.0 | 1157 | $3,600 | $3.11 | 17d | 1 | 0.76mi |
| 4111 SW 33rd St West Park, FL | 3.0 | 2.0 | 1258 | $3,000 | $2.38 | 24d | 1 | 0.80mi |
| 3921 SW 31st Dr Unit 3921 West Park, FL | 3.0 | 1.0 | 1730 | $2,700 | $1.56 | 15d | 1 | 0.81mi |
| 3921 SW 31st Dr Unit 3921 West Park, FL | 3.0 | 1.0 | 1730 | $2,700 | $1.56 | 2d | 1 | 0.81mi |
| 3830 SW 31st Dr West Park, FL | 3.0 | 1.0 | 1419 | $2,900 | $2.04 | 24d | 1 | 0.82mi |
| 3661 SW 60th Ter Unit E Miramar, FL | 2.0 | 1.0 | 1620 | $1,900 | $1.17 | 24d | 1 | 0.86mi |
| 2620 SW 53rd Ave West Park, FL | 3.0 | 2.0 | 1202 | $3,000 | $2.50 | 22d | 1 | 0.92mi |
| 6121 SW 40th Ct Unit A Miramar, FL | 2.0 | 2.0 | 1759 | $2,500 | $1.42 | 22d | 1 | 0.95mi |
| 6036 SW 35th St Unit B Miramar, FL | 2.0 | 2.5 | 1251 | $2,350 | $1.88 | 24d | 1 | 0.97mi |
| 5649 SW 27th St Unit 1 West Park, FL | 2.0 | 1.0 | 1697 | $1,950 | $1.15 | 22d | 1 | 0.98mi |
| 6033 SW 35th St Unit 101 Miramar, FL | 2.0 | 2.0 | 1000 | $1,995 | $2.00 | 24d | 1 | 0.99mi |
| 6146 SW 36th Ct Unit 6146 Miramar, FL | 3.0 | 2.5 | 1504 | $3,100 | $2.06 | 24d | 1 | 1.01mi |
| 3830 SW 31st St West Park, FL | 3.0 | 1.0 | 1419 | $2,850 | $2.01 | 22d | 1 | 1.06mi |
| 4011 SW 28th St West Park, FL | 4.0 | 2.0 | 1296 | $3,850 | $2.97 | 5d | 1 | 1.09mi |
| 4011 SW 28th St #4011 West Park, FL | 4.0 | 2.0 | 1296 | $4,500 | $3.47 | 22d | 1 | 1.09mi |
| 5211 SW 24th St West Park, FL | 4.0 | 2.0 | 1277 | $3,300 | $2.58 | 12d | 1 | 1.11mi |
HOA detail condo
- Monthly dues
- $669 · $8,028/yr
- Likely covers
- parking
- Assessments
- None detected in remarks — confirm with the listing agent.
Listing history 20 events
-
2026-06-18days on market $159,000 Active 157 DOM
-
2026-06-17days on market $159,000 Active 156 DOM
-
2026-06-16days on market $159,000 Active 155 DOM
-
2026-06-15days on market $159,000 Active 154 DOM
-
2026-06-13days on market $159,000 Active 152 DOM
-
2026-06-09pricedays on market $159,000 Active 148 DOM
-
2026-06-07days on market $179,000 Active 146 DOM
-
2026-06-04days on market $179,000 Active 143 DOM
-
2026-06-03days on market $179,000 Active 142 DOM
-
2026-06-02days on market $179,000 Active 141 DOM
-
2026-06-01days on market $179,000 Active 140 DOM
-
2026-05-31days on market $179,000 Active 139 DOM
-
2026-05-11price $179,000
-
2026-01-06$194,000 Active
-
2023-07-26soldstatus $139,000
-
2021-06-23soldstatus $105,000
-
2016-12-08soldstatus $70,000
-
2016-02-01historical
-
2015-11-10$75,000 Active
-
2004-08-25soldstatus $105,000
ⓘ Source: listings_history table (triggers on properties + properties_extension) + one-shot
backfill from property_details.listing_events for pre-trigger history.
Tax reassessment forecast FL · Resets to sale price
- Current annual tax
- $2,969 · $247/mo
- Projected year-2 tax
- $2,969 · $247/mo
- Expected delta
- $0/yr ($0/mo · 0.0%)
ⓘ Screening estimate from a state-policy table — verify with the county assessor before closing.
Climate risk First Street
- Flood 1/10 Low FEMA zone X (unshaded) · 0% chance over 30 yrs
- Wildfire 1/10 Low
- Heat 10/10 Extreme 7 d/yr ≥105°F today · 25 d/yr by 30 yrs out
- Wind 10/10 Extreme 99% chance of damaging wind over 30 yrs
- Air quality 2/10 Low 2 unhealthy d/yr today · 2 by 30 yrs out
Nearby sold comps map
Loading sold comps map…
Walkable amenities ~0.75 mi
Loading nearby amenities…
Taxation est. · year 1
- Rental income
- $31,302
- − Mortgage interest
- −$8,906
- − Property taxes
- −$2,969
- − Insurance
- −$795
- − Repairs & maintenance
- −$2,504
- − Management
- −$2,504
- − HOA
- −$8,028
- − Depreciation
- −$4,625
- Taxable income
- $970
- Est. tax owed @ 24.0%
- −$233
- After-tax cash flow
- $2,698/yr
For passive investors: Depreciation is non-cash, so a rental often shows a tax loss while cash-flowing — sheltering income. Rental losses are passive: they offset passive income freely, and up to $25,000/yr can offset ordinary (W-2) income if you actively participate and your MAGI is under $100k (phasing out to $0 by $150k); unused losses carry forward. On sale, claimed depreciation is recaptured at up to 25%, and gains may owe capital-gains tax (a 1031 exchange can defer both). Figures are a year-1 estimate at your 24.0% rate — not tax advice; consult a CPA.
Schools (NCES district)
- District
- Broward
- NCES district ID
- 1200180
- Math proficiency
- 42% ▼ -18.00%
- Reading proficiency
- 53% ▼ -5.00%
- Median HH income
- $52,139
- Composite
- 40.88/100
- National rank
- #3621
- State rank
- #46 of 73 in FL
Livability — Pembroke Park
- Score
- 69/100
- State rank
- #493
- US rank
- #9041
Category grades
Schools grade is shown separately in the Schools card above.
Census & demographics
- Census place
- Pembroke Park, FL
- County
- Broward County · 1,963,430 people
- Metro
- Miami-Fort Lauderdale-Pompano Beach, FL
- Population (ZIP)
- 72,344
- Household income
- $74,709
- Rent vs Own
- Severe rent burden
- 2567.0
Population outlook (Broward County) Hauer SSP2
- Today (2025)
- 2,207,033 people
- By 2030
- 2,360,704 · +7.0%
- By 2040
- 2,661,208 · +20.6%
- By 2050
- 2,946,698 · +33.5%
- By 2075
- 3,602,273 · +63.2%
- By 2100
- 3,970,984 · +79.9%
Race, ethnicity, and origin ACS 2023
- Neighborhood character
- Diverse neighborhood (Simpson 0.60)
- Race & ethnicity
- Black 51% Hispanic / Latino 37% Two or more races 19% White 8% Asian 2%
- Hispanic origin (detail)
- Mexican 2% Puerto Rican 5% Cuban 9% Dominican 6%
- Common ancestry
- Hispanic 14%
- Foreign-born
- 44% · Canada, Jamaica, Dominican Republic
- Languages at home
- 50% English-only · Spanish 32% French/Haitian/Cajun 13% Other Indo-European 1%
Political lean MEDSL · Broward
- 2024 margin
- D (+17.0) · D 58.0% · R 41.0%
- 2008→2024 swing
- -17.8pp toward R · 2008: 34.7pp · 2024: 17.0pp
- All cycles
- 2024: D+17.0 2020: D+29.8 2016: D+35.0 2012: D+34.9 2008: D+34.7
Not yet ingested
- Civics
- —
Market trends
- HPI YoY
- ▼ -442.33%
- Current HPI
- 534.7664
- Rent YoY
- ▲ 0.34%
- Metro
- Miami-Fort Lauderdale-Pompano Beach, FL
- State GDP YoY
- ▲ 3.28%
- F500 in state
- 36
Industry mix (Fortune 500 HQ in FL)
| Industry | F500 HQs | Revenue |
|---|---|---|
| Industrial Technology | 2 | $29B |
|
||
| Insurance | 2 | $17B |
|
||
| Retail | 1 | $60B |
|
||
| Technology Distribution | 1 | $58B |
|
||
| Homebuilding | 1 | $35B |
|
||
| Technology Manufacturing | 1 | $35B |
|
||
Price history
+70.5% since first listed8 events — show timeline
- 2026-05-11 Price Changed $179,000 MARMLS
- 2026-01-06 Listed $194,000 MARMLS
- 2023-07-26 Sold (Public Records) $139,000 Public Records
- 2021-06-23 Sold (Public Records) $105,000 Public Records
- 2016-12-08 Sold (Public Records) $70,000 Public Records
- 2016-02-01 Listing Removed — MARMLS
- 2015-11-10 Listed $75,000 MARMLS
- 2004-08-25 Sold (Public Records) $105,000 Public Records
Property tax history
+11.9%/yrLatest (2025): $2,969 · +17.4% YoY. Source: county tax records.
Cash-flow waterfall
monthlySold comps — $/sqft
last 12 mo · ≤1 miLoading sold comps…