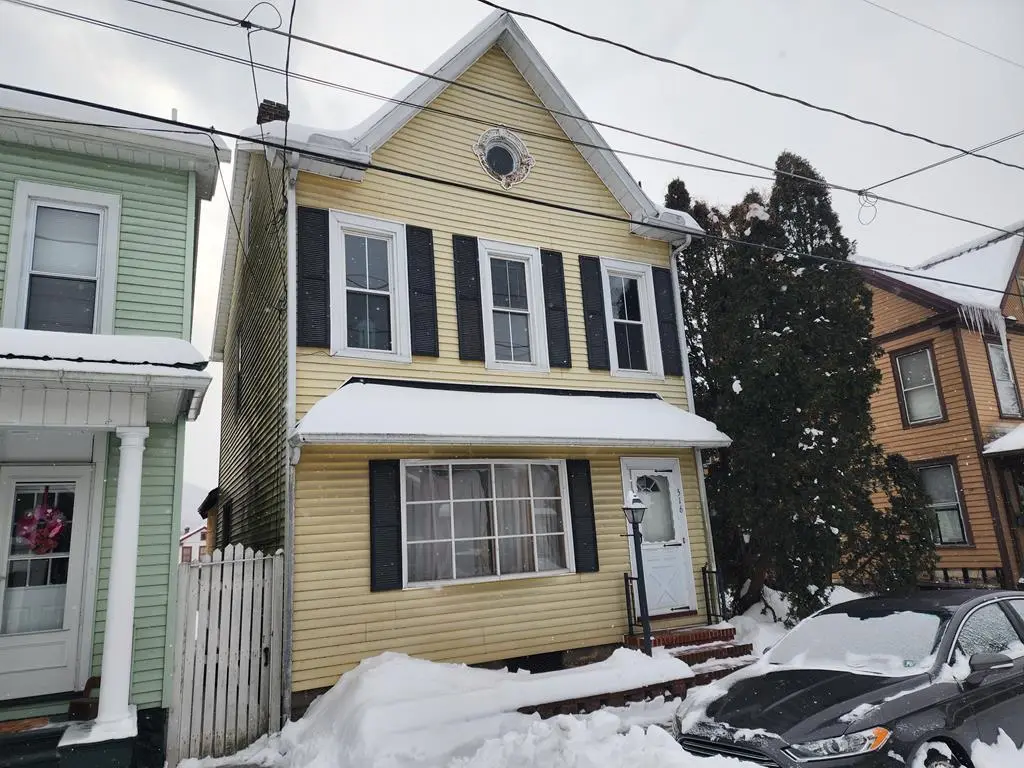
516 Church St · Huntingdon, PA
Flood risk 1/10 · Minimal
- FEMA flood zone
- X (unshaded)
- Chance of flooding over 30 yrs
- 0.0%
- Est. flood insurance / yr
- $473 – $860
Fire risk 1/10 · Minimal
- Est. fire insurance / yr
- $511 – $949
Heat risk 5/10 · Moderate
- Hot days now (above 97°F)
- 8 days/yr
- Hot days in 30 yrs
- 18 days/yr
Wind risk 2/10 · Minimal
- Chance of severe wind over 30 yrs
- —
Air-quality risk 2/10 · Minimal
- Unhealthy air days now
- 1 days/yr
- Unhealthy air days in 30 yrs
- 2 days/yr
Risk factors via First Street. Map © Google.
Why this score? — see what drove the B- grade
The composite is a weighted blend of 9 inputs, each scored 0–100. Each bar is that input's sub-score; the figure is the points it added to the 100-point composite (weight × sub-score).
- Cash flow +30.0/30.0
- 1% rule +10.0/10.0
- DSCR +10.0/10.0
- ARV discount +7.5/15.0
- Schools +3.3/10.0
- Livability +3.3/5.0
- Rent growth +2.5/5.0
- Condition / age +2.5/5.0
- Appreciation +0.0/10.0
$49,900
🖨 Deal sheet (PDF) 📄 Offer letter ✓ Due diligence
Listing remarks MLS
FIXER UPPER - BRING YOUR VISION! 3 bedroom home ready for renovation. Features living room, dining room & kitchen. Second floor has been taken down to the studs, offering a blank slate to redesign to your taste. No heat or plumbing currently in place. Fenced yard.
Key facts
- Fenced yard
- Kitchen
- Living room
Tags
Neighborhood map
What this means for you Summary
Snapshot
- This is a 3-bed/1.0-bath single-family listed at $50k.
Deal economics
- At list price, monthly cash flow is $544 ($7k/yr) — positive.
- The deal already cash-flows at list — no discount required.
- Meets the 1% rule at list price ($1k rent vs $50k).
- Recommended offer: $45k (9.0% below list) — sets the bar for market timing.
- Cap rate 19.4% vs local median 4.1% in Huntingdon — top-decile yield for the area; either an underpriced asset or a hidden risk that comps aren't pricing in. Stress-test before assuming the spread holds.
Location & tenants
- Location reads 66/100 on livability (#1,050 in PA) — a middle-class / working-renter tenant base. Strengths: crime A+, cost of living A+, housing A+; Watch: employment D+, amenities F, commute F.
- Huntingdon Area SD (town): math 32% / reading 47% proficiency, ranked #366 of 539 in PA (top 68%) — families likely to look elsewhere, expect single-tenant / working-renter base with shorter leases.
- Zoned schools: Standing Stone El Sch (math 30% / reading 49%, grade F, #947 of 1,518 statewide, top 65%, 421 students, 62% FRL); Huntingdon Area Ms (math 23% / reading 43%, grade F, #346 of 512 statewide, top 69%, 385 students, 50% FRL); Huntingdon Area Shs (math 62%, 539 students, 32% FRL).
- Market conditions: 74 active listings in the ZIP; 70 units permitted in Huntingdon County in 2024 (0 in 5+ unit buildings).
Forward outlook
- Local home prices are declining (-3.0%/yr); year-one equity from $345 of loan paydown is wiped out by about $1k of value loss. Plan a longer hold.
- Huntingdon County population projected at -14% by 2050 — secular population decline; favor cash flow + early exit over multi-decade hold.
- At projected returns (-3.0% appreciation + 3.0% rent growth), your $14k cash investment doubles in ~3 years — after that, you're playing with house money.
Negotiation context
- It's been on market 101 days — a 9% lower offer ($45k) is reasonable based on typical stale-listing flexibility.
- 2 sale attempts with the ask held roughly flat each time — persistent listings suggest the price (not the market) is what's stuck; bring a comps-based counter.
Risks & watch-outs
- Watch-outs: property tax is 3.3% of price.
- Climate carrying-cost: extreme-heat days projected 8→18/yr by 2055 (HVAC capex compounding) — expect insurance premiums to compound above CPI over the hold.
Questions for the listing agent
- It's been on market 101 days. Have you received any prior offers? Is the seller open to a 9% concession, seller financing, or rate buy-down credit?
- Property tax is high relative to price — has the assessment been appealed recently, and will the sale trigger a re-assessment?
- Why hasn't it sold? Are there any deal-killer items the seller is aware of (foundation, flood, title, zoning, code violations)?
- Is there a deadline driving the sale (1031 exchange, divorce, estate, relocation)? That informs how much negotiation room exists.
- Schools are D-rated, which usually means shorter tenancies and higher turnover. Who's the typical renter profile here, and what's been the actual vacancy rate?
- What's the average days-on-market for RENTAL listings here right now (not sales)? A rising rental-DOM trend means longer vacancies and softer asking-rent achievability than the comps imply.
- What's the recent tenant-quality profile in this submarket — average credit score on applications, eviction rate, late-payment / NSF rate, and stable-employment percentage? A property-management company in the area should have these aggregated.
- How much new for-sale + rental construction is in the pipeline within 1–3 miles? Heavy new supply typically softens prices + rents 12–24 months out; constrained supply supports both.
Investment metrics
- 1% rule
- 2.44% ✓
- Cap rate
- 19.38%
- Cash-on-cash
- 46.73%
- DSCR
- 3.08
- GRM
- 3.4
CMA / ARV
- ARV (median comp)
- $104,087
- List price
- $49,900
- Delta
- -52.06%
- Verdict
- UNDERPRICED
- Comps
- 20 within 1.0 mi
Show comp detail 12 sales within ~0.75 mi
| Address | Dist | Beds/Ba | Sqft | Sold | Price | $/sf | Match |
|---|---|---|---|---|---|---|---|
| 408 Church St | 0.11mi | 3/1.5 | 1,388 (-0%) | 2mo | $73,550 | $53 | 91 |
| 510 5th St | 0.06mi | 3/1.5 | 1,547 (+11%) | 1mo | $101,000 | $65 | 75 |
| 413 Church St | 0.09mi | 4/2.5 (+1) | 1,457 (+5%) | 7mo | $26,000 | $18 | 71 |
| 508 7th St | 0.12mi | 3/1.5 | 1,258 (-10%) | 10mo | $129,900 | $103 | 68 |
| 805 Fifth St | 0.20mi | 3/1.5 | 1,512 (+9%) | 7mo | $155,000 | $103 | 68 |
| 424 Moore St | 0.08mi | 3/1.0 | 1,186 (-15%) | 6mo | $37,000 | $31 | 67 |
| 521 13th St | 0.52mi | 3/1.0 | 1,327 (-5%) | 3mo | $77,000 | $58 | 66 |
| 230 Church St | 0.24mi | 2/2.0 (-1) | 1,280 (-8%) | 2mo | $75,000 | $59 | 65 |
| 710 7th St | 0.20mi | 3/1.5 | 1,600 (+15%) | 5mo | $85,000 | $53 | 59 |
| 1319 Washington St | 0.61mi | 2/1.5 (-1) | 1,348 (-3%) | 1mo | $125,000 | $93 | 58 |
| 1413 Mifflin St | 0.66mi | 3/1.0 | 1,482 (+6%) | 1mo | $165,000 | $111 | 58 |
| 1135 Washington St | 0.48mi | 4/1.5 (+1) | 1,600 (+15%) | 1mo | $175,000 | $109 | 45 |
Match score weights: distance 35% · size 25% · config 20% · recency 20%. Top-matched comps best support the ARV.
Projected returns pro-forma
-3.0% appreciation · 3.0% rent growth · sell at horizon
- IRR
- 44.1%
- Equity multiple
- 2.91×
- Total profit
- $26,631
- Equity at exit
- $7,440
- IRR
- 50.1%
- Equity multiple
- 5.87×
- Total profit
- $68,069
- Equity at exit
- $4,314
Cash invested: $13,972 (down + closing). Projections, not guarantees.
Landlord ↔ Tenant lean methodology
- Overall (STATE)
- 62 Landlord-Friendly
- State Pennsylvania
- 62 Landlord-Friendly · EVEN
- County
- — inherits STATE
- City
- — inherits STATE
ZIP-level market 16652
- Home prices YoY
- -21.5%
- Active inventory
- 74
- Price-to-rent
- 3.4×
Monthly cashflow live
- Estimated rent
- $1,218 medium interval (Pro) →
- Mortgage (P&I)
- −$262
- Tax from tax record
- −$136 /mo · $1,628/yr
- Insurance
- −$21
- HOA
- −$0
- Vacancy / Maint / Mgmt
- −$256
- Net cashflow
- $544
Break-even live
Sensitivity live
| Price | -10% $572 | -5% $558 | +0% $544 | +5% $530 | +10% $516 |
|---|---|---|---|---|---|
| Rent | -10% $448 | -5% $496 | +0% $544 | +5% $592 | +10% $640 |
| Rate | -1.0pp $569 | -0.5pp $557 | base $544 | +0.5pp $531 | +1.0pp $518 |
UW: 25.0% down · 7.5% · 30yr · 1.5% tax · 5.0% vac · 8.0% maint · 8.0% mgmt
Financing live
Cash to close
- Down payment
- $12,475
- Closing costs
- $1,497
- Reserves months
- —
- Total cash needed
- —
Loan-product check · same deal, 3 products live
Conventional
25% down · 7.5% · 30yr
- Down + closing
- —
- Monthly P&I
- —
- Monthly cashflow
- —
- DSCR
- —
- Eligible?
- —
Personal DTI + credit; lowest rate.
DSCR
20% down · 8.5% · 30yr
- Down + closing
- —
- Monthly P&I
- —
- Monthly cashflow
- —
- DSCR
- —
- Eligible?
- —
No personal income docs; deal must DSCR.
Hard money
10% down · 12.0% · 12mo
- Down + closing
- —
- Monthly P&I
- —
- Monthly cashflow
- —
- DSCR
- —
- Eligible?
- —
Short-term bridge; refi at stabilization.
Listing history 8 events
-
2026-06-07statusdays on market $49,900 Pending 101 DOM
-
2026-06-02days on market $49,900 Active 99 DOM
-
2026-06-01days on market $49,900 Active 98 DOM
-
2026-05-31days on market $49,900 Active 97 DOM
-
2026-05-30days on market $49,900 Active 96 DOM
-
2026-02-25status Active 271-char remark
Show marketing remark (271 chars)
FIXER UPPER - BRING YOUR VISION! 3 bedroom home ready for renovation. Features living room, dining room & kitchen. Second floor has been taken down to the studs, offering a blank slate to redesign to your taste. No heat or plumbing currently in place. Fenced yard.
-
2026-02-05status Pending 271-char remark
Show marketing remark (271 chars)
FIXER UPPER - BRING YOUR VISION! 3 bedroom home ready for renovation. Features living room, dining room & kitchen. Second floor has been taken down to the studs, offering a blank slate to redesign to your taste. No heat or plumbing currently in place. Fenced yard.
-
2026-02-04$49,900 Active 271-char remark
Show marketing remark (271 chars)
FIXER UPPER - BRING YOUR VISION! 3 bedroom home ready for renovation. Features living room, dining room & kitchen. Second floor has been taken down to the studs, offering a blank slate to redesign to your taste. No heat or plumbing currently in place. Fenced yard.
ⓘ Source: listings_history table (triggers on properties + properties_extension) + one-shot
backfill from property_details.listing_events for pre-trigger history.
Tax reassessment forecast PA · Partial reset (capped growth)
- Current annual tax
- $1,628 · $136/mo
- Projected year-2 tax
- $1,628 · $136/mo
- Expected delta
- $0/yr ($0/mo · 0.0%)
ⓘ Screening estimate from a state-policy table — verify with the county assessor before closing.
Climate risk First Street
- Flood 1/10 Low FEMA zone X (unshaded) · 0% chance over 30 yrs
- Wildfire 1/10 Low
- Heat 5/10 Major 8 d/yr ≥97°F today · 18 d/yr by 30 yrs out
- Wind 2/10 Low
- Air quality 2/10 Low 1 unhealthy d/yr today · 2 by 30 yrs out
Nearby sold comps map
Loading sold comps map…
Walkable amenities ~0.75 mi
Loading nearby amenities…
Taxation est. · year 1
- Rental income
- $14,616
- − Mortgage interest
- −$2,795
- − Property taxes
- −$1,628
- − Insurance
- −$250
- − Repairs & maintenance
- −$1,169
- − Management
- −$1,169
- − Depreciation
- −$1,452
- Taxable income
- $6,153
- Est. tax owed @ 24.0%
- −$1,477
- After-tax cash flow
- $5,052/yr
For passive investors: Depreciation is non-cash, so a rental often shows a tax loss while cash-flowing — sheltering income. Rental losses are passive: they offset passive income freely, and up to $25,000/yr can offset ordinary (W-2) income if you actively participate and your MAGI is under $100k (phasing out to $0 by $150k); unused losses carry forward. On sale, claimed depreciation is recaptured at up to 25%, and gains may owe capital-gains tax (a 1031 exchange can defer both). Figures are a year-1 estimate at your 24.0% rate — not tax advice; consult a CPA.
Schools (NCES district)
- District
- Huntingdon Area SD
- NCES district ID
- 4212090
- Math proficiency
- 32% ▲ 1.00%
- Reading proficiency
- 47% ▼ -4.00%
- Median HH income
- $43,534
- Composite
- 33.4/100
- National rank
- #5478
- State rank
- #366 of 539 in PA
Livability — Huntingdon
- Score
- 66/100
- State rank
- #1050
- US rank
- #11779
Category grades
Schools grade is shown separately in the Schools card above.
Census & demographics
- Census place
- Huntingdon, PA
- Population (ZIP)
- 15,858
Population outlook (Huntingdon County) Hauer SSP2
- Today (2025)
- 44,212 people
- By 2030
- 43,057 · -2.6%
- By 2040
- 40,537 · -8.3%
- By 2050
- 37,844 · -14.4%
- By 2075
- 31,411 · -29.0%
- By 2100
- 23,907 · -45.9%
Race, ethnicity, and origin ACS 2023
- Neighborhood character
- Predominantly White (86%)
- Race & ethnicity
- White 86% Two or more races 6% Black 5% Hispanic / Latino 2%
- Common ancestry
- Romanian 3% Slovak 3% Serbian 2%
- Foreign-born
- 2% · Canada
- Languages at home
- 96% English-only · Spanish 2%
Political lean MEDSL · Huntingdon
- 2024 margin
- Solid R (+52.9) · D 23.2% · R 76.1%
- 2008→2024 swing
- -25.4pp toward R · 2008: -27.5pp · 2024: -52.9pp
- All cycles
- 2024: R+52.9 2020: R+51.0 2016: R+50.7 2012: R+37.4 2008: R+27.5
Not yet ingested
- Civics
- —
Market trends
- HPI YoY
- ▼ -54.10%
- Current HPI
- 197.6958
- Rent YoY
- —
- Metro
- —
- State GDP YoY
- ▲ 1.68%
- F500 in state
- 34
Industry mix (Fortune 500 HQ in PA)
| Industry | F500 HQs | Revenue |
|---|---|---|
| Healthcare | 2 | $309B |
|
||
| Insurance | 2 | $27B |
|
||
| Telecommunications / Media | 1 | $124B |
|
||
| Industrial Distribution | 1 | $22B |
|
||
| Financial Services | 1 | $20B |
|
||
| Chemicals / Materials | 1 | $18B |
|
||
Price history
3 events — show timeline
- 2026-02-25 Relisted — HCBR
- 2026-02-05 Pending — HCBR
- 2026-02-04 Listed $49,900 HCBR
Property tax history
+3.4%/yrLatest (2026): $1,628 · +4.0% YoY. Source: county tax records.
Cash-flow waterfall
monthlySold comps — $/sqft
last 12 mo · ≤1 miLoading sold comps…