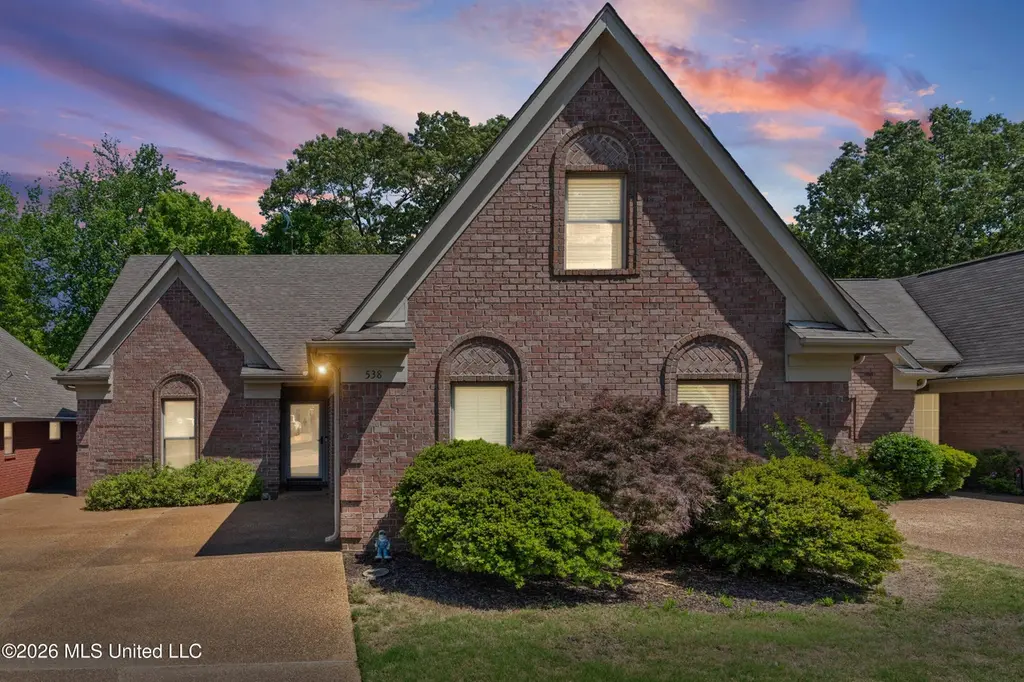
538 Fairway Oaks Dr · Hernando, MS
Flood risk 1/10 · Minimal
- FEMA flood zone
- X (unshaded)
- Chance of flooding over 30 yrs
- 0.0%
- Est. flood insurance / yr
- $507 – $1,088
Fire risk 4/10 · Minor
- Est. fire insurance / yr
- $1,241 – $2,305
Heat risk 6/10 · Moderate
- Hot days now (above 109°F)
- 7 days/yr
- Hot days in 30 yrs
- 21 days/yr
Wind risk 4/10 · Minor
- Chance of severe wind over 30 yrs
- 23.0%
Air-quality risk 2/10 · Minimal
- Unhealthy air days now
- 2 days/yr
- Unhealthy air days in 30 yrs
- 2 days/yr
Risk factors via First Street. Map © Google.
Why this score? — see what drove the D grade
The composite is a weighted blend of 9 inputs, each scored 0–100. Each bar is that input's sub-score; the figure is the points it added to the 100-point composite (weight × sub-score).
- Cash flow +15.3/30.0
- ARV discount +5.0/15.0
- DSCR +4.7/10.0
- Schools +4.0/10.0
- Livability +3.5/5.0
- 1% rule +3.0/10.0
- Condition / age +2.5/5.0
- Rent growth +2.4/5.0
- Appreciation +0.0/10.0
$349,900
🖨 Deal sheet (PDF) 📄 Offer letter ✓ Due diligence
Listing remarks
Beautifully maintained home with great curb appeal, featuring a brick exterior, landscaped front yard, and a spacious driveway leading to a two car garage. The backyard offers a peaceful setting with no rear neighbors, backing up to a tree lined golf course view that provides both privacy and a scenic backdrop. Enjoy the open green space right behind the home, perfect for relaxing evenings or morning coffee. Located in a well kept neighborhood with easy access to nearby amenities, this property offers a comfortable layout, a great outdoor setting, and a location that is hard to beat.
Key facts
- Screened in porch
- Centrally located
- Built in shelves
Tags
Property features AI
Finance
- HOA & community: Community clubhouse; Golf community; Community pool
Exterior
- Parking: Attached 2-car garage; Driveway parking; Concrete driveway
- Security: Smoke detectors
- Utilities: Public water; Public sewer; Electricity connected; Natural gas connected
- Home design: Single-family house; Two stories; Entry level: Primary on main level
- Construction: Brick construction; Slab foundation; Architectural shingle roof; Built in public-records year
- Exterior features: Deck; Porch; Screened porch; Private yard; Rain gutters; Backyard fencing; On golf course; Front yard; City lot; Zero lot line
Interior
- Kitchen: Dishwasher; Disposal; Exhaust fan; Free-standing gas oven; Free-standing gas range; Microwave; Refrigerator; Self-cleaning oven; Stainless steel appliances
- Flooring: Luxury vinyl; Carpet; Combination of flooring types; Hardwood; Tile
- Bathrooms: 3 full bathrooms
- Heating & cooling: Central heating (natural gas); Central air conditioning (gas)
- Interior features: Bookcases; Built-in features; Ceiling fans; Crown molding; Eat-in kitchen; Granite countertops; High ceilings; High-speed internet; Kitchen island; Open floorplan; Pantry; Primary bedroom on main level; Soaking tub; Walk-in closets; Deadbolt locks; Window screens; Fireplace in great room
- Laundry & utility: Laundry room with washer and electric dryer hookups
Neighborhood map
What this means for you Summary
Snapshot
- This is a 3-bed/3.0-bath single-family listed at $350k.
Deal economics
- At list price, monthly cash flow is $129 ($2k/yr) — positive.
- The deal already cash-flows at list — no discount required.
- To meet the 1% rule (rent ≥ 1% of price), the offer needs to be $278k (20.5% below list).
- Recommended offer: $278k (20.5% below list) — sets the bar for 1% rule.
- Cap rate 6.7% vs local median 4.3% in Hernando — top-decile yield for the area; either an underpriced asset or a hidden risk that comps aren't pricing in. Stress-test before assuming the spread holds.
Location & tenants
- Location reads 70/100 on livability (#44 in MS) — a middle-class / working-renter tenant base. Strengths: crime A+, cost of living A+, housing A+; Watch: amenities F, commute F, health & safety F.
- Desoto County School District (suburban): math 48% / reading 42% proficiency, ranked #20 of 130 in MS (top 15%) — families likely to look elsewhere, expect single-tenant / working-renter base with shorter leases.
- Zoned schools: Hernando Elem (779 students, 100% FRL); Hernando Middle School (math 75% / reading 57%, grade A-, #2 of 179 statewide, top 1%, 1,150 students, 100% FRL); Hernando High School (math 69% / reading 62%, grade B, #2 of 197 statewide, top 1%, 1,419 students, 100% FRL) — zoned schools average 100% FRL vs 43% district-wide (56 pts higher); higher-poverty schools than district average — tighter screening recommended.
- Zoned-school proficiency averages 66% at this address vs 45% district-wide (+21 pts) — the actual schools serving this property are materially stronger than the Desoto County School District average implies; a family-tenant draw the district grade alone would hide.
- Market conditions: Rents soft (-0.4%/yr); 407 active listings in the ZIP; 6 comparable units currently listed for rent nearby; rentals lingering (median 46d on market — plan ~5-8 weeks vacancy on turnover, expect pricing pressure); 50% of comp listings sitting > 30 days — soft ceiling on asking rent; solid renter incomes; 1,155 units permitted in DeSoto County in 2024 (0 in 5+ unit buildings).
- This rent runs 36% of the median local income ($94k/yr) — at the standard rent-burdened threshold; future hikes will face affordability resistance.
Forward outlook
- Local home prices are declining (-3.0%/yr); year-one equity from $2k of loan paydown is wiped out by about $10k of value loss. Plan a longer hold.
- DeSoto County population projected at +33% by 2050 — long-run rental-demand tailwind backs the buy-and-hold thesis.
Negotiation context
- It's been on market 61 days — a 6% lower offer ($329k) is reasonable based on typical stale-listing flexibility.
- 3 sale attempts since 4y ago with the ask held roughly flat each time — persistent listings suggest the price (not the market) is what's stuck; bring a comps-based counter.
Risks & watch-outs
- Climate carrying-cost: extreme-heat days projected 7→21/yr by 2055 (HVAC capex compounding) — expect insurance premiums to compound above CPI over the hold.
Questions for the listing agent
- It's been on market 61 days. Have you received any prior offers? Is the seller open to a 20% concession, seller financing, or rate buy-down credit?
- Why hasn't it sold? Are there any deal-killer items the seller is aware of (foundation, flood, title, zoning, code violations)?
- Is there a deadline driving the sale (1031 exchange, divorce, estate, relocation)? That informs how much negotiation room exists.
- Schools are B-rated — typically a magnet for longer-tenancy family renters. What's the average tenant stay here, and is there a school-zone premium baked into asking?
- The area grade is low — what's the realistic commute time and amenity access for the typical tenant pool here? Any planned neighborhood developments (good or bad) we should know about?
- What's the average days-on-market for RENTAL listings here right now (not sales)? A rising rental-DOM trend means longer vacancies and softer asking-rent achievability than the comps imply.
- What's the recent tenant-quality profile in this submarket — average credit score on applications, eviction rate, late-payment / NSF rate, and stable-employment percentage? A property-management company in the area should have these aggregated.
- How much new for-sale + rental construction is in the pipeline within 1–3 miles? Heavy new supply typically softens prices + rents 12–24 months out; constrained supply supports both.
Investment metrics
- 1% rule
- 0.80% ✗
- Cap rate
- 6.74%
- Cash-on-cash
- 1.59%
- DSCR
- 1.07
- GRM
- 10.5
CMA / ARV
- ARV (median comp)
- $331,355
- List price
- $349,900
- Delta
- 5.60%
- Verdict
- FAIR
- Comps
- 20 within 1.0 mi
Show comp detail 10 sales within ~0.75 mi
| Address | Dist | Beds/Ba | Sqft | Sold | Price | $/sf | Match |
|---|---|---|---|---|---|---|---|
| 782 Fairway Trl | 0.24mi | 3/2.0 | 1,800 (+1%) | 5mo | $319,900 | $178 | 79 |
| 462 Fairway Oaks Dr | 0.08mi | 3/2.0 | 1,726 (-3%) | 13mo | $312,000 | $181 | 76 |
| 423 Fairway Oaks | 0.12mi | 3/2.0 | 1,750 (-2%) | 16mo | $275,000 | $157 | 74 |
| 549 N Classic Dr | 0.09mi | 4/2.0 (+1) | 1,860 (+4%) | 11mo | $315,000 | $169 | 71 |
| 905 Fairway Pointe Cv | 0.50mi | 4/2.0 (+1) | 1,815 (+2%) | 3mo | $294,900 | $162 | 63 |
| 459 N Classic Dr | 0.15mi | 4/2.0 (+1) | 2,000 (+12%) | 4mo | $325,900 | $163 | 60 |
| 523 Fairway Oaks Dr | 0.03mi | 3/2.0 | 1,962 (+10%) | 23mo | $309,900 | $158 | 59 |
| 163 Fairway Trace Dr | 0.38mi | 4/2.5 (+1) | 1,925 (+8%) | 7mo | $312,900 | $163 | 56 |
| 214 Fairway Trace Dr | 0.34mi | 4/2.0 (+1) | 1,975 (+11%) | 21mo | $318,000 | $161 | 40 |
| 925 Cardinal Ln | 0.58mi | 3/3.0 | 1,585 (-11%) | 23mo | $265,000 | $167 | 35 |
Match score weights: distance 35% · size 25% · config 20% · recency 20%. Top-matched comps best support the ARV.
Projected returns pro-forma
-3.0% appreciation · 0.0% rent growth · sell at horizon
- IRR
- -16.8%
- Equity multiple
- 0.42×
- Total profit
- $-56,783
- Equity at exit
- $52,171
- IRR
- -14.3%
- Equity multiple
- 0.27×
- Total profit
- $-71,046
- Equity at exit
- $30,253
Cash invested: $97,972 (down + closing). Projections, not guarantees.
Landlord ↔ Tenant lean methodology
- Overall (STATE)
- 90 Strongly Landlord-Friendly
- State Mississippi
- 90 Strongly Landlord-Friendly · R+11
- County
- — inherits STATE
- City
- — inherits STATE
ZIP-level market 38632
- Home prices YoY
- -31.8%
- Rents YoY
- -0.4%
- Active inventory
- 407
- Price-to-rent
- 10.5×
Monthly cashflow live
- Estimated rent
- $2,782 high interval (Pro) →
- Mortgage (P&I)
- −$1,835
- Tax from tax record
- −$88 /mo · $1,054/yr
- Insurance
- −$146
- HOA
- −$0
- Vacancy / Maint / Mgmt
- −$584
- Net cashflow
- $129
Break-even live
Sensitivity live
| Price | -10% $327 | -5% $228 | +0% $129 | +5% $30 | +10% $-69 |
|---|---|---|---|---|---|
| Rent | -10% $-90 | -5% $20 | +0% $129 | +5% $239 | +10% $349 |
| Rate | -1.0pp $306 | -0.5pp $218 | base $129 | +0.5pp $39 | +1.0pp $-54 |
UW: 25.0% down · 7.5% · 30yr · 1.5% tax · 5.0% vac · 8.0% maint · 8.0% mgmt
Financing live
Cash to close
- Down payment
- $87,475
- Closing costs
- $10,497
- Reserves months
- —
- Total cash needed
- —
Loan-product check · same deal, 3 products live
Conventional
25% down · 7.5% · 30yr
- Down + closing
- —
- Monthly P&I
- —
- Monthly cashflow
- —
- DSCR
- —
- Eligible?
- —
Personal DTI + credit; lowest rate.
DSCR
20% down · 8.5% · 30yr
- Down + closing
- —
- Monthly P&I
- —
- Monthly cashflow
- —
- DSCR
- —
- Eligible?
- —
No personal income docs; deal must DSCR.
Hard money
10% down · 12.0% · 12mo
- Down + closing
- —
- Monthly P&I
- —
- Monthly cashflow
- —
- DSCR
- —
- Eligible?
- —
Short-term bridge; refi at stabilization.
Rent comps 6 comps
| Address | Beds | Baths | Sqft | Rent | $/sqft | DOM | Units | Dist |
|---|---|---|---|---|---|---|---|---|
| 947 Clubhouse Dr Hernando, MS | 4.0 | 2.0 | 1713 | $2,495 | $1.46 | 45d | 1 | 0.18mi |
| 272 Fairway Trace Dr Lot $3800 Hernando, MS | 4.0 | 2.0 | 2000 | $3,800 | $1.90 | 45d | 1 | 0.28mi |
| 814 Byhalia Rd Hernando, MS | 4.0 | 3.0 | 2531 | $2,400 | $0.95 | 3d | 1 | 0.50mi |
| 52 Forked Creek Pkwy Hernando, MS | 4.0 | 2.0 | 2300 | $2,340 | $1.02 | 45d | 1 | 0.82mi |
| 89 Shady Lane Cv E Hernando, MS | 4.0 | 2.5 | 2500 | $2,650 | $1.06 | 13d | 1 | 0.96mi |
| 1324 Biloxi St Hernando, MS | 3.0 | 2.0 | 1594 | $1,950 | $1.22 | 25d | 1 | 1.14mi |
Listing history 22 events
-
2026-06-21days on market $349,900 Active 61 DOM
-
2026-06-18days on market $349,900 Active 58 DOM
-
2026-06-17days on market $349,900 Active 57 DOM
-
2026-06-16days on market $349,900 Active 56 DOM
-
2026-06-15days on market $349,900 Active 55 DOM
-
2026-06-13days on market $349,900 Active 53 DOM
-
2026-06-10days on market $349,900 Active 50 DOM
-
2026-06-09days on market $349,900 Active 49 DOM
-
2026-06-08days on market $349,900 Active 48 DOM
-
2026-06-07pricestatusdays on market $349,900 Active 47 DOM
-
2026-06-03days on market $354,900 Active Under Contract 43 DOM
-
2026-06-02days on market $354,900 Active Under Contract 42 DOM
-
2026-06-01days on market $354,900 Active Under Contract 41 DOM
-
2026-05-31days on market $354,900 Active Under Contract 40 DOM
-
2026-05-06historical Active Under Contract 590-char remark
-
2026-05-01price $354,900 590-char remark
-
2026-04-21$359,900 Active 590-char remark
-
2022-05-12soldstatus
-
2022-05-02historical
-
2022-04-26$349,900 Active
-
2012-10-12soldstatus
-
1996-09-11soldstatus
ⓘ Source: listings_history table (triggers on properties + properties_extension) + one-shot
backfill from property_details.listing_events for pre-trigger history.
Tax reassessment forecast MS · Resets to sale price
- Current annual tax
- $1,054 · $88/mo
- Projected year-2 tax
- $2,764 · $230/mo
- Expected delta
- +$1,710/yr (+$143/mo · 162.2%)
ⓘ Screening estimate from a state-policy table — verify with the county assessor before closing.
Climate risk First Street
- Flood 1/10 Low FEMA zone X (unshaded) · 0% chance over 30 yrs
- Wildfire 4/10 Moderate
- Heat 6/10 Major 7 d/yr ≥109°F today · 21 d/yr by 30 yrs out
- Wind 4/10 Moderate 23% chance of damaging wind over 30 yrs
- Air quality 2/10 Low 2 unhealthy d/yr today · 2 by 30 yrs out
Nearby sold comps map
Loading sold comps map…
Walkable amenities ~0.75 mi
Loading nearby amenities…
Taxation est. · year 1
- Rental income
- $33,387
- − Mortgage interest
- −$19,600
- − Property taxes
- −$1,054
- − Insurance
- −$1,750
- − Repairs & maintenance
- −$2,671
- − Management
- −$2,671
- − Depreciation
- −$10,179
- Taxable loss
- −$4,538
- Est. tax savings @ 24.0%
- +$1,089
- After-tax cash flow
- $2,642/yr
For passive investors: Depreciation is non-cash, so a rental often shows a tax loss while cash-flowing — sheltering income. Rental losses are passive: they offset passive income freely, and up to $25,000/yr can offset ordinary (W-2) income if you actively participate and your MAGI is under $100k (phasing out to $0 by $150k); unused losses carry forward. On sale, claimed depreciation is recaptured at up to 25%, and gains may owe capital-gains tax (a 1031 exchange can defer both). Figures are a year-1 estimate at your 24.0% rate — not tax advice; consult a CPA.
Schools (NCES district)
- District
- Desoto County School District
- NCES district ID
- 2801320
- Math proficiency
- 48% ▼ -13.00%
- Reading proficiency
- 42% ▼ -6.00%
- Median HH income
- $59,272
- Composite
- 39.56/100
- National rank
- #3933
- State rank
- #20 of 130 in MS
Livability — Hernando
- Score
- 70/100
- State rank
- #44
- US rank
- #8034
Category grades
Schools grade is shown separately in the Schools card above.
Census & demographics
- Census place
- Hernando, MS
- County
- DeSoto County · 176,513 people
- City population
- 31,374
- Metro
- Memphis, TN-MS-AR
- Population (ZIP)
- 31,374
- Household income
- $93,583
- Rent vs Own
- Severe rent burden
- 24.0
Population outlook (DeSoto County) Hauer SSP2
- Today (2025)
- 203,338 people
- By 2030
- 217,692 · +7.1%
- By 2040
- 245,320 · +20.6%
- By 2050
- 270,133 · +32.8%
- By 2075
- 323,341 · +59.0%
- By 2100
- 348,742 · +71.5%
Race, ethnicity, and origin ACS 2023
- Neighborhood character
- Predominantly White (81%)
- Race & ethnicity
- White 81% Black 13% Two or more races 4% Hispanic / Latino 2%
- Common ancestry
- Italian 2% Serbian 2% Slovak 1%
- Foreign-born
- 2% · Canada
- Languages at home
- 98% English-only · Spanish 1% Arabic 1%
Political lean MEDSL · DeSoto
- 2024 margin
- Strong R (+24.1) · D 36.7% · R 60.8% · Other 2.5%
- 2008→2024 swing
- +14.2pp toward D · 2008: -38.2pp · 2024: -24.1pp
- All cycles
- 2024: R+24.1 2020: R+23.9 2016: R+34.8 2012: R+33.5 2008: R+38.2
Not yet ingested
- Civics
- —
Market trends
- HPI YoY
- ▼ -82.49%
- Current HPI
- 176.8843
- Rent YoY
- ▼ -0.43%
- Metro
- Memphis, TN-MS-AR
- State GDP YoY
- —
- F500 in state
- 0
Price history
+0.0% since first listed10 events — show timeline
- 2026-06-06 Price Changed $349,900 MLSU
- 2026-06-04 Relisted — MLSU
- 2026-05-06 Contingent — MLSU
- 2026-05-01 Price Changed $354,900 MLSU
- 2026-04-21 Listed $359,900 MLSU
- 2022-05-12 Sold (Public Records) — Public Records
- 2022-05-02 Listing Removed — MLSU
- 2022-04-26 Listed $349,900 MLSU
- 2012-10-12 Sold (Public Records) — Public Records
- 1996-09-11 Sold (Public Records) — Public Records
Property tax history
-5.0%/yrLatest (2025): $1,054 · -16.0% YoY. Source: county tax records.
Cash-flow waterfall
monthlySold comps — $/sqft
last 12 mo · ≤1 miLoading sold comps…