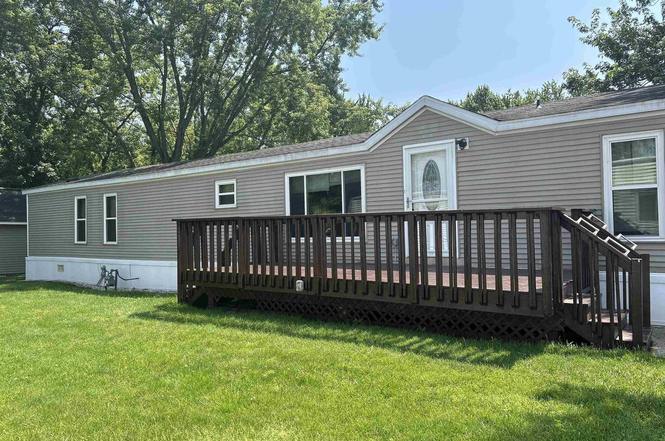
32200 45th St #341 · Salem Lakes, WI
Flood risk No data
- FEMA flood zone
- —
- Chance of flooding over 30 yrs
- —
- Est. flood insurance / yr
- —
Fire risk No data
- Est. fire insurance / yr
- —
Heat risk No data
- Hot days now (above threshold)
- —
- Hot days in 30 yrs
- —
Wind risk No data
- Chance of severe wind over 30 yrs
- —
Air-quality risk No data
- Unhealthy air days now
- —
- Unhealthy air days in 30 yrs
- —
Risk factors via First Street. Map © Google.
Why this score? — see what drove the B- grade
The composite is a weighted blend of 9 inputs, each scored 0–100. Each bar is that input's sub-score; the figure is the points it added to the 100-point composite (weight × sub-score).
- Cash flow +30.0/30.0
- 1% rule +10.0/10.0
- DSCR +10.0/10.0
- ARV discount +7.5/15.0
- Schools +3.5/10.0
- Rent growth +2.5/5.0
- Livability +2.5/5.0
- Condition / age +2.5/5.0
- Appreciation +0.0/10.0
$65,000
🖨 Deal sheet (PDF) 📄 Offer letter ✓ Due diligence
Listing remarks
THIS IS A WICK HOME BUT SITS IN THE WHEATLAND ESTATE PARK - YOU DO NOT OWN THE LAND YOU PAY RENT FOR THE SPACE THIS HAS A UTILITY SHED ALSO.
Key facts
- Utility shed
- 1 acre lot
- Built 1999
Tags
Neighborhood map
What this means for you Summary
Snapshot
- This is a 3-bed/2.0-bath single-family listed at $65k.
Deal economics
- At list price, monthly cash flow is $862 ($10k/yr) — positive.
- The deal already cash-flows at list — no discount required.
- Meets the 1% rule at list price ($2k rent vs $65k).
- Recommended offer: $64k (1.5% below list) — sets the bar for market timing.
- Cap rate 22.2% vs local median 1.8% in Salem Lakes — top-decile yield for the area; either an underpriced asset or a hidden risk that comps aren't pricing in. Stress-test before assuming the spread holds.
Location & tenants
- Location reads: area grade B — affects rentability + tenant quality, not the cash-flow math above.
- Wheatland J1 School District (rural): math 39% / reading 41% proficiency, ranked #142 of 342 in WI (top 42%) — families likely to look elsewhere, expect single-tenant / working-renter base with shorter leases.
- Market conditions: 124 active listings in the ZIP; 259 units permitted in Kenosha County in 2024 (8 in 5+ unit buildings).
Forward outlook
- Local home prices are declining (-3.0%/yr); year-one equity from $449 of loan paydown is wiped out by about $2k of value loss. Plan a longer hold.
- At projected returns (-3.0% appreciation + 3.0% rent growth), your $18k cash investment doubles in ~2 years — after that, you're playing with house money.
Negotiation context
- It's been on market 22 days — a 2% lower offer ($64k) is reasonable based on typical stale-listing flexibility.
Questions for the listing agent
- Is there a deadline driving the sale (1031 exchange, divorce, estate, relocation)? That informs how much negotiation room exists.
- What's the average days-on-market for RENTAL listings here right now (not sales)? A rising rental-DOM trend means longer vacancies and softer asking-rent achievability than the comps imply.
- What's the recent tenant-quality profile in this submarket — average credit score on applications, eviction rate, late-payment / NSF rate, and stable-employment percentage? A property-management company in the area should have these aggregated.
- How much new for-sale + rental construction is in the pipeline within 1–3 miles? Heavy new supply typically softens prices + rents 12–24 months out; constrained supply supports both.
Investment metrics
- 1% rule
- 2.55% ✓
- Cap rate
- 22.21%
- Cash-on-cash
- 56.85%
- DSCR
- 3.53
- GRM
- 3.3
CMA / ARV
No comps found within radius.
Projected returns pro-forma
-3.0% appreciation · 3.0% rent growth · sell at horizon
- IRR
- 55.3%
- Equity multiple
- 3.44×
- Total profit
- $44,406
- Equity at exit
- $9,692
- IRR
- 60.3%
- Equity multiple
- 7.02×
- Total profit
- $109,479
- Equity at exit
- $5,620
Cash invested: $18,200 (down + closing). Projections, not guarantees.
Landlord ↔ Tenant lean methodology
- Overall (STATE)
- 73 Landlord-Friendly
- State Wisconsin
- 73 Landlord-Friendly · R+2
- County
- — inherits STATE
- City
- — inherits STATE
ZIP-level market 53105
- Active inventory
- 124
- Price-to-rent
- 3.3×
Monthly cashflow live
- Estimated rent
- $1,660 medium interval (Pro) →
- Mortgage (P&I)
- −$341
- Tax est. 1.5%
- −$81 /mo · $975/yr
- Insurance
- −$27
- HOA
- −$0
- Vacancy / Maint / Mgmt
- −$349
- Net cashflow
- $862
Break-even live
Sensitivity live
| Price | -10% $907 | -5% $885 | +0% $862 | +5% $840 | +10% $817 |
|---|---|---|---|---|---|
| Rent | -10% $731 | -5% $797 | +0% $862 | +5% $928 | +10% $993 |
| Rate | -1.0pp $895 | -0.5pp $879 | base $862 | +0.5pp $845 | +1.0pp $828 |
UW: 25.0% down · 7.5% · 30yr · 1.5% tax · 5.0% vac · 8.0% maint · 8.0% mgmt
Financing live
Cash to close
- Down payment
- $16,250
- Closing costs
- $1,950
- Reserves months
- —
- Total cash needed
- —
Loan-product check · same deal, 3 products live
Conventional
25% down · 7.5% · 30yr
- Down + closing
- —
- Monthly P&I
- —
- Monthly cashflow
- —
- DSCR
- —
- Eligible?
- —
Personal DTI + credit; lowest rate.
DSCR
20% down · 8.5% · 30yr
- Down + closing
- —
- Monthly P&I
- —
- Monthly cashflow
- —
- DSCR
- —
- Eligible?
- —
No personal income docs; deal must DSCR.
Hard money
10% down · 12.0% · 12mo
- Down + closing
- —
- Monthly P&I
- —
- Monthly cashflow
- —
- DSCR
- —
- Eligible?
- —
Short-term bridge; refi at stabilization.
Listing history 2 events
-
2025-08-13status Pending
-
2025-07-22$65,000 Active
ⓘ Source: listings_history table (triggers on properties + properties_extension) + one-shot
backfill from property_details.listing_events for pre-trigger history.
Nearby sold comps map
Loading sold comps map…
Walkable amenities ~0.75 mi
Loading nearby amenities…
Taxation est. · year 1
- Rental income
- $19,920
- − Mortgage interest
- −$3,641
- − Property taxes
- −$975
- − Insurance
- −$325
- − Repairs & maintenance
- −$1,594
- − Management
- −$1,594
- − Depreciation
- −$1,891
- Taxable income
- $9,901
- Est. tax owed @ 24.0%
- −$2,376
- After-tax cash flow
- $7,970/yr
For passive investors: Depreciation is non-cash, so a rental often shows a tax loss while cash-flowing — sheltering income. Rental losses are passive: they offset passive income freely, and up to $25,000/yr can offset ordinary (W-2) income if you actively participate and your MAGI is under $100k (phasing out to $0 by $150k); unused losses carry forward. On sale, claimed depreciation is recaptured at up to 25%, and gains may owe capital-gains tax (a 1031 exchange can defer both). Figures are a year-1 estimate at your 24.0% rate — not tax advice; consult a CPA.
Schools (NCES district)
- District
- Wheatland J1 School District
- NCES district ID
- 5516560
- Math proficiency
- 39% ▼ -14.00%
- Reading proficiency
- 41% ▼ -12.00%
- Median HH income
- $58,652
- Composite
- 35.32/100
- National rank
- #4962
- State rank
- #142 of 342 in WI
Livability — Salem Lakes
No livability data for this city. (Only ~50 U.S. cities are tracked.)
Census & demographics
- City population
- 18,215
- Population (ZIP)
- 29,051
Population outlook (Kenosha County) Hauer SSP2
- Today (2025)
- 174,032 people
- By 2030
- 174,923 · +0.5%
- By 2040
- 173,895 · -0.1%
- By 2050
- 170,102 · -2.3%
- By 2075
- 162,952 · -6.4%
- By 2100
- 154,781 · -11.1%
Race, ethnicity, and origin ACS 2023
- Neighborhood character
- Predominantly White (90%)
- Race & ethnicity
- White 90% Hispanic / Latino 6% Two or more races 3%
- Hispanic origin (detail)
- Mexican 4%
- Common ancestry
- Romanian 9% Portuguese 4% Lithuanian 2%
- Foreign-born
- 3% · Canada, Jamaica
- Languages at home
- 94% English-only · Spanish 4% Other Asian/Pacific 0%
Political lean MEDSL · Kenosha
- 2024 margin
- Lean R (+6.2) · D 46.2% · R 52.5% · Other 1.3%
- 2008→2024 swing
- -24.3pp toward R · 2008: 18.1pp · 2024: -6.2pp
- All cycles
- 2024: R+6.2 2020: R+3.1 2016: R+0.3 2012: D+12.3 2008: D+18.1
Not yet ingested
- Civics
- —
Market trends
- HPI YoY
- ▼ -142.20%
- Current HPI
- 254.9118
- Rent YoY
- —
- Metro
- —
- State GDP YoY
- ▲ 2.10%
- F500 in state
- 20
Industry mix (Fortune 500 HQ in WI)
| Industry | F500 HQs | Revenue |
|---|---|---|
| Industrial Machinery | 4 | $23B |
|
||
| Industrial Technology | 2 | $36B |
|
||
| Insurance | 1 | $36B |
|
||
| Professional Services | 1 | $19B |
|
||
| Utilities | 1 | $9B |
|
||
| Consumer Goods | 1 | $3B |
|
||
Price history
2 events — show timeline
- 2025-08-13 Pending — SCWMLS
- 2025-07-22 Listed $65,000 SCWMLS
Cash-flow waterfall
monthlySold comps — $/sqft
last 12 mo · ≤1 miLoading sold comps…