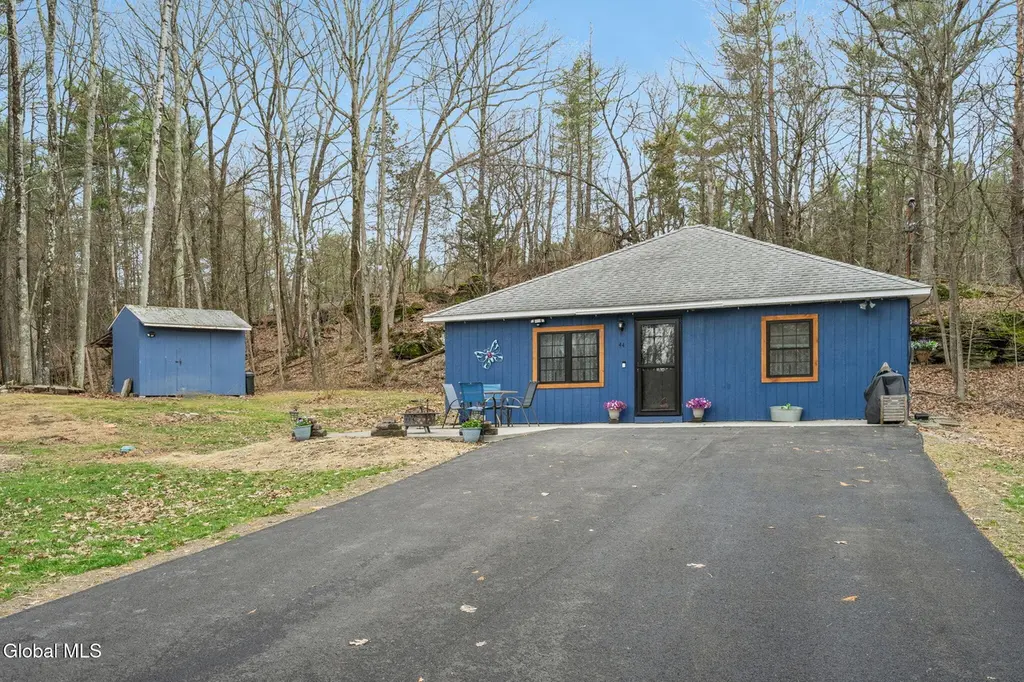
44 Cairo Junction Rd · South Cairo, NY
Flood risk 1/10 · Minimal
- FEMA flood zone
- X (unshaded)
- Chance of flooding over 30 yrs
- 0.0%
- Est. flood insurance / yr
- $507 – $1,088
Fire risk 4/10 · Minor
- Est. fire insurance / yr
- $691 – $1,283
Heat risk 3/10 · Minor
- Hot days now (above 97°F)
- 7 days/yr
- Hot days in 30 yrs
- 16 days/yr
Wind risk 3/10 · Minor
- Chance of severe wind over 30 yrs
- 7.0%
Air-quality risk 2/10 · Minimal
- Unhealthy air days now
- 0 days/yr
- Unhealthy air days in 30 yrs
- 1 days/yr
Risk factors via First Street. Map © Google.
Why this score? — see what drove the F grade
The composite is a weighted blend of 9 inputs, each scored 0–100. Each bar is that input's sub-score; the figure is the points it added to the 100-point composite (weight × sub-score).
- Appreciation +10.0/10.0
- Cash flow +7.7/30.0
- Schools +4.1/10.0
- Rent growth +2.5/5.0
- Livability +2.5/5.0
- Condition / age +2.5/5.0
- 1% rule +1.9/10.0
- DSCR +1.8/10.0
- ARV discount +0.0/15.0
$275,000
🖨 Deal sheet (PDF) 📄 Offer letter ✓ Due diligence
Listing remarks
Looking for a property that is not only efficient, but easy to maintain? Well here it is! Ideally located just minutes from the charm of Catskill and within easy reach of the breathtaking Catskill Mountains, this property offers the perfect balance of nature and convenience. In addition to only being 2 hours from NYC. Within the past 10 years everything from the roof, plumbing, electric, windows, drywall and insulation has been replaced! Oh. .. and there is an upgraded on-demand hot water heater so you never run out of hot water! Outside of adding your own personal touch to make it your own, this is a great opportunity to jump on!
Key facts
- Replaced windows
- Replaced insulation
- Replaced roof
Tags
Neighborhood map
What this means for you Summary
Snapshot
- This is a 2-bed/1.0-bath single-family listed at $275k.
Deal economics
- At list price, monthly cash flow is $-323 ($-4k/yr) — negative.
- To cash-flow at today's rent, offer at most $218k (20.8% below list).
- To meet the 1% rule (rent ≥ 1% of price), the offer needs to be $190k (30.8% below list).
- Recommended offer: $190k (30.8% below list) — sets the bar for 1% rule.
Location & tenants
- Location reads: area grade F — affects rentability + tenant quality, not the cash-flow math above.
- Catskill Central School District (town): math 45% / reading 51% proficiency, ranked #429 of 590 in NY (top 73%) — families likely to look elsewhere, expect single-tenant / working-renter base with shorter leases.
- Market conditions: 104 active listings in the ZIP; 1 comparable units currently listed for rent nearby; 97 units permitted in Greene County in 2024 (0 in 5+ unit buildings).
- This rent runs 31% of the median local income ($73k/yr) — at the standard rent-burdened threshold; future hikes will face affordability resistance.
Forward outlook
- In year one you build about $29k of equity ($2k loan paydown + $28k appreciation (10.0% local appreciation)).
- Greene County population projected at -22% by 2050 — secular population decline; favor cash flow + early exit over multi-decade hold.
- By year 2, paydown + projected appreciation supports a ~$47k cash-out refi (75% LTV) — recoverable capital for the next deal without selling this one.
Negotiation context
- Only 2 days on market — expect competitive offers; lowballing is unlikely to land.
- Current owner paid $106k; list at $275k implies a 159% gain — meaningful room to come down on a strong offer.
Questions for the listing agent
- What do current leases actually rent for vs. the listed asking? Can we see a recent rent roll and the last 12 months of T-12 income?
- Built in 1960 — when were the roof, HVAC, electrical panel, plumbing, and water heater last replaced?
- Is there a deadline driving the sale (1031 exchange, divorce, estate, relocation)? That informs how much negotiation room exists.
- The area grade is low — what's the realistic commute time and amenity access for the typical tenant pool here? Any planned neighborhood developments (good or bad) we should know about?
- What's the average days-on-market for RENTAL listings here right now (not sales)? A rising rental-DOM trend means longer vacancies and softer asking-rent achievability than the comps imply.
- What's the recent tenant-quality profile in this submarket — average credit score on applications, eviction rate, late-payment / NSF rate, and stable-employment percentage? A property-management company in the area should have these aggregated.
- How much new for-sale + rental construction is in the pipeline within 1–3 miles? Heavy new supply typically softens prices + rents 12–24 months out; constrained supply supports both.
Investment metrics
- 1% rule
- 0.69% ✗
- Cap rate
- 4.88%
- Cash-on-cash
- -5.04%
- DSCR
- 0.78
- GRM
- 12.0
CMA / ARV
- ARV (on-the-fly)
- $221,184
- Comps found
- 3
Show comp detail 3 sales within ~0.75 mi
| Address | Dist | Beds/Ba | Sqft | Sold | Price | $/sf | Match |
|---|---|---|---|---|---|---|---|
| 44 Cairo Junction Rd | 0.00mi | 2/1.0 | 1,024 (0%) | 1mo | $277,000 | $271 | 99 |
| 30 Lake Side Dr | 0.51mi | 3/2.0 (+1) | 1,008 (-2%) | 12mo | $218,000 | $216 | 54 |
| 1588 Route 23b | 0.73mi | 2/1.0 | 1,130 (+10%) | 5mo | $235,000 | $208 | 45 |
Match score weights: distance 35% · size 25% · config 20% · recency 20%. Top-matched comps best support the ARV.
Projected returns pro-forma
10.0% appreciation · 3.0% rent growth · sell at horizon
- IRR
- 20.7%
- Equity multiple
- 2.68×
- Total profit
- $129,171
- Equity at exit
- $247,742
- IRR
- 18.8%
- Equity multiple
- 6.15×
- Total profit
- $396,542
- Equity at exit
- $534,265
Cash invested: $77,000 (down + closing). Projections, not guarantees.
Landlord ↔ Tenant lean methodology
- Overall (STATE)
- 15 Strongly Tenant-Friendly
- State New York
- 15 Strongly Tenant-Friendly · D+10
- County
- — inherits STATE
- City
- — inherits STATE
ZIP-level market 12414
- Home prices YoY
- 11.9%
- Active inventory
- 104
- Price-to-rent
- 12.0×
Monthly cashflow live
- Estimated rent
- $1,904 medium interval (Pro) →
- Mortgage (P&I)
- −$1,442
- Tax from tax record
- −$271 /mo · $3,246/yr
- Insurance
- −$115
- HOA
- −$0
- Vacancy / Maint / Mgmt
- −$400
- Net cashflow
- $-323
Break-even live
Sensitivity live
| Price | -10% $-168 | -5% $-245 | +0% $-323 | +5% $-401 | +10% $-479 |
|---|---|---|---|---|---|
| Rent | -10% $-474 | -5% $-398 | +0% $-323 | +5% $-248 | +10% $-173 |
| Rate | -1.0pp $-185 | -0.5pp $-253 | base $-323 | +0.5pp $-394 | +1.0pp $-467 |
UW: 25.0% down · 7.5% · 30yr · 1.5% tax · 5.0% vac · 8.0% maint · 8.0% mgmt
Financing live
Cash to close
- Down payment
- $68,750
- Closing costs
- $8,250
- Reserves months
- —
- Total cash needed
- —
Loan-product check · same deal, 3 products live
Conventional
25% down · 7.5% · 30yr
- Down + closing
- —
- Monthly P&I
- —
- Monthly cashflow
- —
- DSCR
- —
- Eligible?
- —
Personal DTI + credit; lowest rate.
DSCR
20% down · 8.5% · 30yr
- Down + closing
- —
- Monthly P&I
- —
- Monthly cashflow
- —
- DSCR
- —
- Eligible?
- —
No personal income docs; deal must DSCR.
Hard money
10% down · 12.0% · 12mo
- Down + closing
- —
- Monthly P&I
- —
- Monthly cashflow
- —
- DSCR
- —
- Eligible?
- —
Short-term bridge; refi at stabilization.
Rent comps 1 comps
| Address | Beds | Baths | Sqft | Rent | $/sqft | DOM | Units | Dist |
|---|---|---|---|---|---|---|---|---|
| 101 Garcia Ln Leeds, NY | 2.0 | 1.0 | 948 | $2,300 | $2.43 | 15d | 1 | 1.44mi |
Listing history 3 events
-
2026-04-04status Pending
-
2026-04-02$275,000 Active
-
2011-08-26soldstatus $106,000
ⓘ Source: listings_history table (triggers on properties + properties_extension) + one-shot
backfill from property_details.listing_events for pre-trigger history.
Tax reassessment forecast NY · Partial reset (capped growth)
- Current annual tax
- $3,246 · $271/mo
- Projected year-2 tax
- $3,947 · $329/mo
- Expected delta
- +$701/yr (+$58/mo · 21.6%)
ⓘ Screening estimate from a state-policy table — verify with the county assessor before closing.
Climate risk First Street
- Flood 1/10 Low FEMA zone X (unshaded) · 0% chance over 30 yrs
- Wildfire 4/10 Moderate
- Heat 3/10 Moderate 7 d/yr ≥97°F today · 16 d/yr by 30 yrs out
- Wind 3/10 Moderate 7% chance of damaging wind over 30 yrs
- Air quality 2/10 Low 0 unhealthy d/yr today · 1 by 30 yrs out
Nearby sold comps map
Loading sold comps map…
Walkable amenities ~0.75 mi
Loading nearby amenities…
Taxation est. · year 1
- Rental income
- $22,846
- − Mortgage interest
- −$15,404
- − Property taxes
- −$3,246
- − Insurance
- −$1,375
- − Repairs & maintenance
- −$1,828
- − Management
- −$1,828
- − Depreciation
- −$8,000
- Taxable loss
- −$8,835
- Est. tax savings @ 24.0%
- +$2,120
- After-tax cash flow
- $-1,758/yr
For passive investors: Depreciation is non-cash, so a rental often shows a tax loss while cash-flowing — sheltering income. Rental losses are passive: they offset passive income freely, and up to $25,000/yr can offset ordinary (W-2) income if you actively participate and your MAGI is under $100k (phasing out to $0 by $150k); unused losses carry forward. On sale, claimed depreciation is recaptured at up to 25%, and gains may owe capital-gains tax (a 1031 exchange can defer both). Figures are a year-1 estimate at your 24.0% rate — not tax advice; consult a CPA.
Schools (NCES district)
- District
- Catskill Central School District
- NCES district ID
- 3606720
- Math proficiency
- 45% ▼ -9.00%
- Reading proficiency
- 51% ▲ 8.00%
- Median HH income
- $44,960
- Composite
- 40.63/100
- National rank
- #3685
- State rank
- #429 of 590 in NY
Livability — South Cairo
No livability data for this city. (Only ~50 U.S. cities are tracked.)
Census & demographics
- County
- Greene County · 10,169 people
- City population
- 601
- Metro
- nan
- Population (ZIP)
- 10,169
- Household income
- $73,036
- Rent vs Own
- Severe rent burden
- 318.0
Population outlook (Greene County) Hauer SSP2
- Today (2025)
- 44,963 people
- By 2030
- 43,126 · -4.1%
- By 2040
- 38,756 · -13.8%
- By 2050
- 34,913 · -22.4%
- By 2075
- 28,156 · -37.4%
- By 2100
- 22,296 · -50.4%
Race, ethnicity, and origin ACS 2023
- Neighborhood character
- Predominantly White (77%)
- Race & ethnicity
- White 77% Hispanic / Latino 10% Two or more races 8% Black 6%
- Hispanic origin (detail)
- Puerto Rican 7%
- Common ancestry
- Scotch-Irish 3% Iranian 3% Lithuanian 3%
- Foreign-born
- 4% · Canada, Mexico
- Languages at home
- 91% English-only · Spanish 5% Other Indo-European 2% Russian/Polish/Slavic 1%
Political lean MEDSL · Greene
- 2024 margin
- R (+17.0) · D 41.5% · R 58.5%
- 2008→2024 swing
- -7.1pp toward R · 2008: -9.9pp · 2024: -17.0pp
- All cycles
- 2024: R+17.0 2020: R+15.6 2016: R+27.4 2012: R+11.1 2008: R+9.9
Not yet ingested
- Civics
- —
Market trends
- HPI YoY
- ▲ 52.47%
- Current HPI
- 494.3394
- Rent YoY
- —
- Metro
- nan
- State GDP YoY
- ▲ 2.60%
- F500 in state
- 92
Industry mix (Fortune 500 HQ in NY)
| Industry | F500 HQs | Revenue |
|---|---|---|
| Financial Services | 10 | $950B |
|
||
| Consumer Goods | 9 | $162B |
|
||
| Insurance | 4 | $225B |
|
||
| Telecommunications | 2 | $144B |
|
||
| Pharmaceuticals | 2 | $112B |
|
||
| Media / Entertainment | 2 | $69B |
|
||
Price history
+159.4% since first listed3 events — show timeline
- 2026-04-04 Pending — Global MLS
- 2026-04-02 Listed $275,000 Global MLS
- 2011-08-26 Sold (Public Records) $106,000 Public Records
Property tax history
+3.9%/yrLatest (2025): $3,246 · +3.7% YoY. Source: county tax records.
Cash-flow waterfall
monthlySold comps — $/sqft
last 12 mo · ≤1 miLoading sold comps…