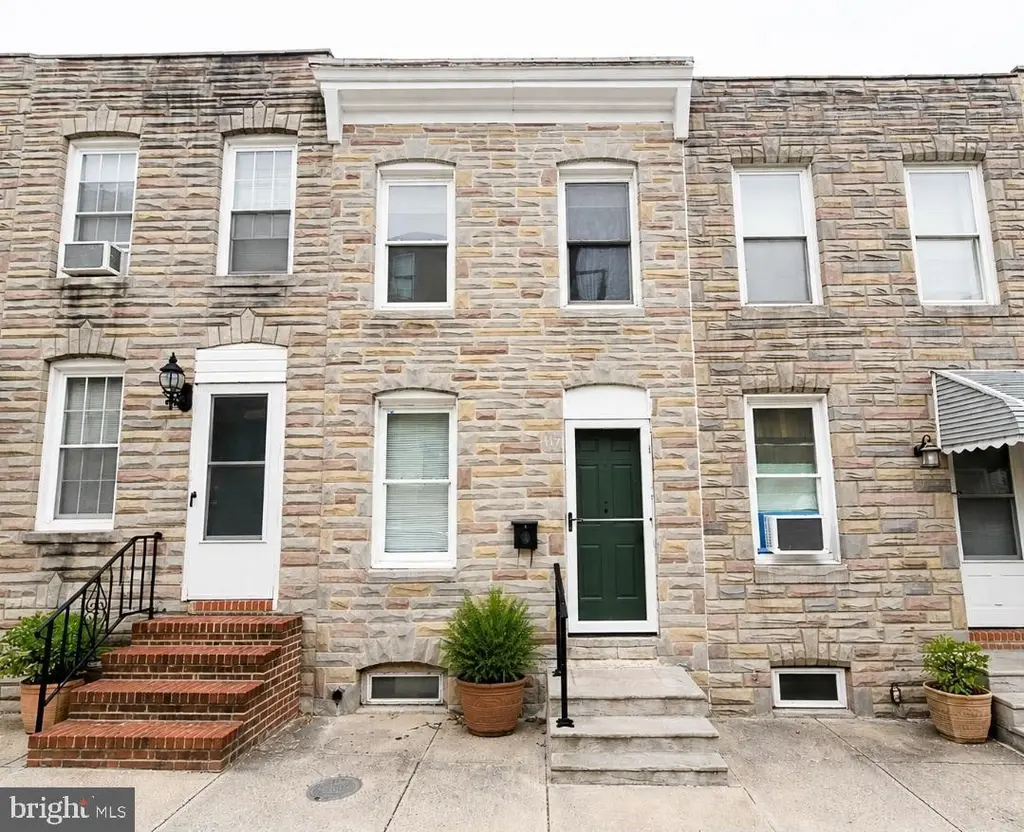
117 Bloomsberry St · Baltimore, MD
Flood risk 1/10 · Minimal
- FEMA flood zone
- X (unshaded)
- Chance of flooding over 30 yrs
- 0.0%
- Est. flood insurance / yr
- $473 – $860
Fire risk 1/10 · Minimal
- Est. fire insurance / yr
- $755 – $1,403
Heat risk 8/10 · Major
- Hot days now (above 102°F)
- 7 days/yr
- Hot days in 30 yrs
- 15 days/yr
Wind risk 6/10 · Moderate
- Chance of severe wind over 30 yrs
- 27.0%
Air-quality risk 4/10 · Minor
- Unhealthy air days now
- 6 days/yr
- Unhealthy air days in 30 yrs
- 7 days/yr
Risk factors via First Street. Map © Google.
Why this score? — see what drove the B- grade
The composite is a weighted blend of 9 inputs, each scored 0–100. Each bar is that input's sub-score; the figure is the points it added to the 100-point composite (weight × sub-score).
- Cash flow +26.0/30.0
- ARV discount +15.0/15.0
- DSCR +8.7/10.0
- 1% rule +7.6/10.0
- Livability +3.8/5.0
- Condition / age +2.5/5.0
- Rent growth +2.2/5.0
- Schools +1.0/10.0
- Appreciation +0.0/10.0
$179,900
🖨 Deal sheet (PDF) 📄 Offer letter ✓ Due diligence
Listing remarks
This classic Federal-style brick rowhome has been thoughtfully refreshed and is ready for you to move right in. Key Highlights: Fresh & Modern: The entire home boasts fresh interior paint and brand-new Luxury Vinyl Plank (LVP) flooring throughout, offering a seamless, durable, and stylish aesthetic. Sun-Drenched Living: Large windows flood the home with natural light, particularly the spacious primary bedroom and the cozy main living area. Versatile Layout: Features 2 bedrooms plus a flexible second-floor den—perfect for a home office, nursery, or creative studio. Recent Upgrades: Peace of mind comes standard with a new roof (2024) and a brand-new front-loading dryer (2024). Bon
Key facts
- Built 1920
- Listed 24 days
Property features AI
Finance
- Other: Finished above-grade area reported; Annual taxes and assessed values available (financial details excluded per instructions)
- Financial info: Ground rent exists ($12, semi-annually); Total actual rent reported: $22,200; Ownership interest: Ground rent; Property condition: Good
Exterior
- Parking: On-street parking
- Utilities: Public water; Public sewer; Electric hot water
- Home design: Interior townhouse / rowhouse; Three total levels; Flat roof
- Construction: Brick construction; Concrete perimeter foundation; Estimated year built
- Exterior features: In city limits (Baltimore City); Not in a federal flood zone; Above grade and below grade structures
Interior
- Kitchen: Oven/Range - Gas; Refrigerator
- Bedrooms: Two bedrooms on the first upper level; Bedroom 1; Bedroom 2
- Flooring: Laminate plank flooring
- Bathrooms: One full bathroom (all upper levels)
- Heating & cooling: Forced air heating (natural gas); Central A/C with ceiling fan(s)
- Interior features: Brick and drywall walls/ceilings; Unfinished basement with windows; Living room; Dining room; Den; Mud room
- Laundry & utility: Washer in unit; Dryer (gas) in unit; Laundry located in basement and lower floor / has laundry
Neighborhood map
What this means for you Summary
Snapshot
- This is a 2-bed/1.0-bath townhouse listed at $180k.
Deal economics
- At list price, monthly cash flow is $445 ($5k/yr) — positive.
- The deal already cash-flows at list — no discount required.
- Meets the 1% rule at list price ($2k rent vs $180k).
- Recommended offer: $177k (1.5% below list) — sets the bar for market timing.
- Cap rate 9.3% vs local median 6.0% in Baltimore — top-decile yield for the area; either an underpriced asset or a hidden risk that comps aren't pricing in. Stress-test before assuming the spread holds.
Location & tenants
- Location reads 76/100 on livability (#90 in MD, #3,396 nationally) — a middle-class / working-renter tenant base. Strengths: amenities A+, commute A+, housing A+; Watch: schools D, crime F.
- Baltimore City Public Schools (urban): math 7% / reading 16% proficiency, ranked #24 of 24 in MD (top 100%) — low school quality limits family demand, transient renter base, plan for 1-2y turnover; 79% free/reduced lunch — lower-income household profile, screen leases tightly.
- Market conditions: Rents soft (-1.0%/yr); 364 active listings in the ZIP; 40 comparable units currently listed for rent nearby; rentals at typical pace (median 19d on market — plan ~3-4 weeks tenant-placement turnaround); solid renter incomes; 1,273 units permitted in Baltimore city in 2024 (1,104 in 5+ unit buildings).
Forward outlook
- Local home prices are declining (-3.0%/yr); year-one equity from $1k of loan paydown is wiped out by about $5k of value loss. Plan a longer hold.
- Baltimore County population projected to shrink 4% by 2050 — rents likely to lag national; underwrite the cash flow, not the appreciation.
Negotiation context
- It's been on market 25 days — a 2% lower offer ($177k) is reasonable based on typical stale-listing flexibility.
- 9 sale attempts since 29y ago with the ask held roughly flat each time — persistent listings suggest the price (not the market) is what's stuck; bring a comps-based counter.
- Current owner paid $141k; 28% above their basis — modest negotiation headroom, anchor on the comps not their cost.
Risks & watch-outs
- Watch-outs: built in 1920 — expect roof / HVAC / electrical / plumbing capex.
- Climate carrying-cost: major wind risk, 27% chance of damaging wind over 30y; extreme-heat days projected 7→15/yr by 2055 (HVAC capex compounding) — expect insurance premiums to compound above CPI over the hold.
Questions for the listing agent
- Built in 1920 — when were the roof, HVAC, electrical panel, plumbing, and water heater last replaced?
- Is there a deadline driving the sale (1031 exchange, divorce, estate, relocation)? That informs how much negotiation room exists.
- Schools are D-rated, which usually means shorter tenancies and higher turnover. Who's the typical renter profile here, and what's been the actual vacancy rate?
- Crime grade is F in this area — have there been break-ins, vandalism, or insurance claims at this property in the last 3 years? What carrier currently insures it and at what premium?
- What's the average days-on-market for RENTAL listings here right now (not sales)? A rising rental-DOM trend means longer vacancies and softer asking-rent achievability than the comps imply.
- What's the recent tenant-quality profile in this submarket — average credit score on applications, eviction rate, late-payment / NSF rate, and stable-employment percentage? A property-management company in the area should have these aggregated.
- How much new for-sale + rental construction is in the pipeline within 1–3 miles? Heavy new supply typically softens prices + rents 12–24 months out; constrained supply supports both.
Investment metrics
- 1% rule
- 1.26% ✓
- Cap rate
- 9.26%
- Cash-on-cash
- 10.60%
- DSCR
- 1.47
- GRM
- 6.6
CMA / ARV
- ARV (median comp)
- $275,598
- List price
- $179,900
- Delta
- -34.72%
- Verdict
- UNDERPRICED
- Comps
- 20 within 1.0 mi
Show comp detail 12 sales within ~0.75 mi
| Address | Dist | Beds/Ba | Sqft | Sold | Price | $/sf | Match |
|---|---|---|---|---|---|---|---|
| 1622 Patapsco St | 0.14mi | 2/1.0 | 912 (+3%) | 3mo | $164,300 | $180 | 87 |
| 1720 Byrd St | 0.02mi | 2/1.5 | 960 (+8%) | 2mo | $275,000 | $286 | 82 |
| 1601 Marshall St | 0.12mi | 2/2.0 | 936 (+5%) | 2mo | $256,000 | $274 | 79 |
| 1617 Race St | 0.31mi | 2/1.5 | 860 (-3%) | 2mo | $265,000 | $308 | 76 |
| 139 E Randall St | 0.12mi | 2/1.0 | 1,005 (+13%) | 2mo | $265,000 | $264 | 71 |
| 1526 S Hanover St | 0.29mi | 2/1.5 | 960 (+8%) | 2mo | $185,000 | $193 | 70 |
| 30 E Hamburg St | 0.59mi | 2/1.0 | 924 (+4%) | 1mo | $210,000 | $227 | 65 |
| 911 S Charles St #403 | 0.64mi | 2/2.0 | 905 (+2%) | 1mo | $200,000 | $221 | 62 |
| 100 Harborview Dr #1208 | 0.63mi | 1/1.0 (-1) | 856 (-4%) | 0mo | $165,000 | $193 | 59 |
| 608 E Fort Ave | 0.39mi | 2/2.0 | 786 (-12%) | 2mo | $255,000 | $324 | 57 |
| 122 Burnett St | 0.43mi | 2/2.5 | 984 (+11%) | 1mo | $310,000 | $315 | 55 |
| 731 S Hanover St Unit R2 | 0.75mi | 2/1.0 | 800 (-10%) | 0mo | $180,000 | $225 | 48 |
Match score weights: distance 35% · size 25% · config 20% · recency 20%. Top-matched comps best support the ARV.
Projected returns pro-forma
-3.0% appreciation · 0.0% rent growth · sell at horizon
- IRR
- -4.0%
- Equity multiple
- 0.85×
- Total profit
- $-7,362
- Equity at exit
- $26,824
- IRR
- 1.6%
- Equity multiple
- 1.09×
- Total profit
- $4,780
- Equity at exit
- $15,554
Cash invested: $50,372 (down + closing). Projections, not guarantees.
Landlord ↔ Tenant lean methodology
- Overall (CITY)
- 12 Strongly Tenant-Friendly
- State Maryland
- 27 Tenant-Leaning · D+14
- County
- — inherits STATE
- City Baltimore
- 12 Strongly Tenant-Friendly · D+58
ZIP-level market 21230
- Rents YoY
- -1.0%
- Active inventory
- 364
- Price-to-rent
- 6.6×
Monthly cashflow live
- Estimated rent
- $2,270 high interval (Pro) →
- Mortgage (P&I)
- −$943
- Tax from tax record
- −$330 /mo · $3,956/yr
- Insurance
- −$75
- HOA
- −$0
- Vacancy / Maint / Mgmt
- −$477
- Net cashflow
- $445
Break-even live
Sensitivity live
| Price | -10% $547 | -5% $496 | +0% $445 | +5% $394 | +10% $343 |
|---|---|---|---|---|---|
| Rent | -10% $266 | -5% $355 | +0% $445 | +5% $535 | +10% $624 |
| Rate | -1.0pp $536 | -0.5pp $491 | base $445 | +0.5pp $398 | +1.0pp $351 |
UW: 25.0% down · 7.5% · 30yr · 1.5% tax · 5.0% vac · 8.0% maint · 8.0% mgmt
Financing live
Cash to close
- Down payment
- $44,975
- Closing costs
- $5,397
- Reserves months
- —
- Total cash needed
- —
Loan-product check · same deal, 3 products live
Conventional
25% down · 7.5% · 30yr
- Down + closing
- —
- Monthly P&I
- —
- Monthly cashflow
- —
- DSCR
- —
- Eligible?
- —
Personal DTI + credit; lowest rate.
DSCR
20% down · 8.5% · 30yr
- Down + closing
- —
- Monthly P&I
- —
- Monthly cashflow
- —
- DSCR
- —
- Eligible?
- —
No personal income docs; deal must DSCR.
Hard money
10% down · 12.0% · 12mo
- Down + closing
- —
- Monthly P&I
- —
- Monthly cashflow
- —
- DSCR
- —
- Eligible?
- —
Short-term bridge; refi at stabilization.
Rent comps 40 comps
| Address | Beds | Baths | Sqft | Rent | $/sqft | DOM | Units | Dist |
|---|---|---|---|---|---|---|---|---|
| 1702 Light St Unit 302 Baltimore, MD | 2.0 | 2.0 | 735 | $2,300 | $3.13 | 19d | 1 | 0.05mi |
| 1710 Marshall St Baltimore, MD | 2.0 | 1.0 | 1110 | $2,500 | $2.25 | 45d | 1 | 0.07mi |
| 49 E Heath St Baltimore, MD | 2.0 | 1.5 | 858 | $1,800 | $2.10 | 12d | 1 | 0.08mi |
| 103 E Wells St Baltimore, MD | 1.0–2.0 | 1.0 | 1008 | $2,415 | $2.39 | 3d | 11 | 0.15mi |
| 1700 S Charles St Baltimore, MD | 1.0 | 1.0 | 600 | $1,300 | $2.17 | 45d | 1 | 0.17mi |
| 1705 Olive St Baltimore, MD | 2.0 | 2.0 | 648 | $2,500 | $3.86 | 21d | 1 | 0.18mi |
| 1625 Olive St Baltimore, MD | 2.0 | 2.0 | 672 | $2,500 | $3.72 | 45d | 1 | 0.19mi |
| 1503 S Charles St Unit 2 Baltimore, MD | 2.0 | 2.0 | 1100 | $2,375 | $2.16 | 45d | 1 | 0.23mi |
| 1601 S Hanover St Apt 1R Baltimore, MD | 2.0 | 1.0 | 900 | $1,600 | $1.78 | 3d | 1 | 0.23mi |
| 1900 S Hanover St Baltimore, MD | 3.0 | 1.0–2.0 | 875 | $3,119 | $3.56 | 3d | 66 | 0.26mi |
| 1412 Light St Unit 2 Baltimore, MD | 1.0 | 1.0 | 800 | $1,700 | $2.12 | 4d | 1 | 0.27mi |
| 111 W Heath St Baltimore, MD | 2.0 | 1.0–2.5 | 1263 | $2,850 | $2.26 | 4d | 7 | 0.29mi |
| 1290 Battery Ave Baltimore, MD | 2.0 | 2.5 | 968 | $2,900 | $3.00 | 25d | 1 | 0.31mi |
| 1516 Clarkson St Baltimore, MD | 2.0 | 1.5 | 1050 | $1,795 | $1.71 | 25d | 1 | 0.32mi |
| 1265 Riverside Ave Unit 1st Floor Baltimore, MD | 1.0 | 1.0 | 700 | $1,350 | $1.93 | 25d | 1 | 0.34mi |
| 1403 Race St Baltimore, MD | 3.0 | 3.0 | 1008 | $2,200 | $2.18 | 45d | 1 | 0.38mi |
| 1211 Light St Baltimore, MD | 2.0 | 2.0 | 921 | $2,172 | $2.36 | 25d | 1 | 0.39mi |
| 1312 S Hanover St Apt 3 Baltimore, MD | 2.0 | 1.0 | 750 | $2,200 | $2.93 | 45d | 1 | 0.39mi |
| 250 Mission Blvd Baltimore, MD | 2.0 | 1.0–2.0 | 790 | $3,406 | $4.31 | 3d | 21 | 0.40mi |
| 1201 S Charles St Baltimore, MD | 2.0–3.0 | 2.0 | 1341 | $2,200 | $1.64 | 5d | 4 | 0.42mi |
| 126 Burnett St Baltimore, MD | 2.0 | 2.5 | 984 | $2,200 | $2.24 | 25d | 1 | 0.43mi |
| 1125 Light St Baltimore, MD | 1.0 | 1.0 | 800 | $1,300 | $1.62 | 25d | 1 | 0.44mi |
| 2450 Rye St Baltimore, MD | 2.0 | 1.0–2.0 | 926 | $3,789 | $4.09 | 3d | 31 | 0.45mi |
| 803 E Fort Ave Unit 1 Baltimore, MD | 2.0 | 1.0 | 1100 | $2,300 | $2.09 | 5d | 1 | 0.47mi |
| 1111 Light St Baltimore, MD | 2.0 | 1.0–2.0 | 982 | $2,449 | $2.49 | 5d | 13 | 0.49mi |
| 1110 Key Hwy Baltimore, MD | 1.0–2.0 | 1.0–2.5 | 1197 | $3,696 | $3.09 | 3d | 33 | 0.51mi |
| 400 E Cross St Baltimore, MD | 1.0 | 1.0 | 900 | $1,400 | $1.56 | 25d | 1 | 0.53mi |
| 101 W Cross St Baltimore, MD | 2.0 | 1.0–2.0 | 937 | $3,332 | $3.55 | 3d | 23 | 0.53mi |
| 1026 Patapsco St Baltimore, MD | 2.0 | 2.0 | 1008 | $2,100 | $2.08 | 25d | 1 | 0.54mi |
| 23 Pierside Dr Baltimore, MD | 1.0–2.0 | 1.0–2.0 | 985 | $3,050 | $3.10 | 17d | 3 | 0.56mi |
| 23 Pierside Dr Baltimore, MD | 1.0–2.0 | 1.0–2.0 | 975 | $3,050 | $3.13 | 45d | 1 | 0.56mi |
| 2500 Insulator Dr Baltimore, MD | 3.0 | 1.0–2.0 | 988 | $3,816 | $3.86 | 3d | 152 | 0.57mi |
| 1001 Light St Fl -2 Baltimore, MD | 1.0 | 1.0 | 861 | $1,350 | $1.57 | 25d | 1 | 0.57mi |
| 1001 Light St Fl -3 Baltimore, MD | 2.0 | 1.0 | 861 | $1,350 | $1.57 | 25d | 1 | 0.57mi |
| 900 E Fort Ave Baltimore, MD | 2.0 | 1.0–2.0 | 836 | $3,684 | $4.40 | 3d | 18 | 0.59mi |
| 301 Warren Ave Baltimore, MD | 1.0–3.0 | 1.0–2.5 | 1533 | $2,896 | $1.89 | 3d | 9 | 0.61mi |
| 910 S Charles St Unit B Baltimore, MD | 2.0 | 1.0 | 700 | $1,700 | $2.43 | 19d | 1 | 0.63mi |
| 1 E Montgomery St Unit 7 Baltimore, MD | 1.0 | 1.0 | 535 | $1,950 | $3.64 | 45d | 1 | 0.70mi |
| 611 S Charles St Baltimore, MD | 2.0 | 1.0–2.0 | 823 | $2,905 | $3.53 | 3d | 8 | 0.80mi |
| 3 Andrew Pl Unit R98 Baltimore, MD | 2.0 | 2.0 | 975 | $2,100 | $2.15 | 13d | 1 | 0.93mi |
Listing history 37 events
-
2026-06-21days on market $179,900 Active 25 DOM
-
2026-06-18days on market $179,900 Active 22 DOM
-
2026-06-17days on market $179,900 Active 21 DOM
-
2026-06-16days on market $179,900 Active 20 DOM
-
2026-06-15days on market $179,900 Active 19 DOM
-
2026-06-13days on market $179,900 Active 17 DOM
-
2026-06-09days on market $179,900 Active 13 DOM
-
2026-06-08days on market $179,900 Active 12 DOM
-
2026-06-07days on market $179,900 Active 11 DOM
-
2026-06-04pricestatusdays on market $179,900 Active 8 DOM
-
2026-05-15$174,900 Active 1235-char remark
-
2026-05-09historical $174,900 1235-char remark
-
2026-04-04historical
-
2026-03-25price $159,900
-
2026-03-11price $164,900
-
2026-02-06price $169,900
-
2026-01-23$175,000 Active
-
2025-11-08historical
-
2025-11-04price $185,000
-
2025-07-15$90,000 Active
-
2024-11-11historical
-
2024-09-26price $185,000
-
2024-08-21$190,000 Active
-
2022-09-26soldstatus $141,000
-
2022-08-18soldstatus $141,000 Closed
-
2022-07-21status Pending
-
2022-07-11price $157,000
-
2022-07-02status Active
-
2022-06-21status Pending
-
2022-06-07price $165,000
-
2022-04-27$175,000 Active
-
1998-01-21soldstatus $37,900
-
1997-12-30soldstatus $37,900
-
1997-11-01historical
-
1997-08-14$37,900
-
1997-07-30historical
-
1997-01-24
ⓘ Source: listings_history table (triggers on properties + properties_extension) + one-shot
backfill from property_details.listing_events for pre-trigger history.
Tax reassessment forecast MD · Partial reset (capped growth)
- Current annual tax
- $3,956 · $330/mo
- Projected year-2 tax
- $3,956 · $330/mo
- Expected delta
- $0/yr ($0/mo · 0.0%)
ⓘ Screening estimate from a state-policy table — verify with the county assessor before closing.
Climate risk First Street
- Flood 1/10 Low FEMA zone X (unshaded) · 0% chance over 30 yrs
- Wildfire 1/10 Low
- Heat 8/10 Severe 7 d/yr ≥102°F today · 15 d/yr by 30 yrs out
- Wind 6/10 Major 27% chance of damaging wind over 30 yrs
- Air quality 4/10 Moderate 6 unhealthy d/yr today · 7 by 30 yrs out
Nearby sold comps map
Loading sold comps map…
Walkable amenities ~0.75 mi
Loading nearby amenities…
Taxation est. · year 1
- Rental income
- $27,236
- − Mortgage interest
- −$10,077
- − Property taxes
- −$3,956
- − Insurance
- −$900
- − Repairs & maintenance
- −$2,179
- − Management
- −$2,179
- − Depreciation
- −$5,233
- Taxable income
- $2,712
- Est. tax owed @ 24.0%
- −$651
- After-tax cash flow
- $4,689/yr
For passive investors: Depreciation is non-cash, so a rental often shows a tax loss while cash-flowing — sheltering income. Rental losses are passive: they offset passive income freely, and up to $25,000/yr can offset ordinary (W-2) income if you actively participate and your MAGI is under $100k (phasing out to $0 by $150k); unused losses carry forward. On sale, claimed depreciation is recaptured at up to 25%, and gains may owe capital-gains tax (a 1031 exchange can defer both). Figures are a year-1 estimate at your 24.0% rate — not tax advice; consult a CPA.
Schools (NCES district)
- District
- Baltimore City Public Schools
- NCES district ID
- 2400090
- Math proficiency
- 7% ▼ -9.00%
- Reading proficiency
- 16% ▼ -5.00%
- Median HH income
- $42,108
- Composite
- 10.08/100
- National rank
- #9805
- State rank
- #24 of 24 in MD
Livability — Baltimore
- Score
- 76/100
- State rank
- #90
- US rank
- #3396
Category grades
Schools grade is shown separately in the Schools card above.
Census & demographics
- Census place
- Baltimore, MD
- County
- Baltimore City · 558,601 people
- City population
- 588,727
- Metro
- Baltimore-Columbia-Towson, MD
- Population (ZIP)
- 32,977
- Household income
- $91,842
- Rent vs Own
- Severe rent burden
- 1463.0
Population outlook (Baltimore County) Hauer SSP2
- Today (2025)
- 624,249 people
- By 2030
- 621,541 · -0.4%
- By 2040
- 609,756 · -2.3%
- By 2050
- 597,249 · -4.3%
- By 2075
- 552,236 · -11.5%
- By 2100
- 513,934 · -17.7%
Race, ethnicity, and origin ACS 2023
- Neighborhood character
- Diverse neighborhood (Simpson 0.63)
- Race & ethnicity
- White 55% Black 23% Hispanic / Latino 13% Two or more races 6% Asian 4%
- Hispanic origin (detail)
- Mexican 1% Puerto Rican 1%
- Common ancestry
- Romanian 5% Lithuanian 2% Italian 2%
- Foreign-born
- 10% · Canada, China
- Languages at home
- 85% English-only · Spanish 9% Other Indo-European 1% Other Asian/Pacific 1%
Political lean MEDSL · Baltimore
- 2024 margin
- Solid D (+73.0) · D 85.2% · R 12.2% · Other 2.6%
- 2008→2024 swing
- -2.5pp toward R · 2008: 75.5pp · 2024: 73.0pp
- All cycles
- 2024: D+73.0 2020: D+76.6 2016: D+74.6 2012: D+76.4 2008: D+75.5
Not yet ingested
- Civics
- —
Market trends
- HPI YoY
- ▼ -311.43%
- Current HPI
- 284.338
- Rent YoY
- ▼ -1.00%
- Metro
- Baltimore-Columbia-Towson, MD
- State GDP YoY
- ▲ 2.97%
- F500 in state
- 12
Industry mix (Fortune 500 HQ in MD)
| Industry | F500 HQs | Revenue |
|---|---|---|
| Aerospace / Defense | 1 | $71B |
|
||
| Utilities | 1 | $25B |
|
||
| Hotels | 1 | $24B |
|
||
| Consumer Goods | 1 | $7B |
|
||
| Real Estate | 1 | $6B |
|
||
| Chemicals | 1 | $2B |
|
||
Price history
+374.7% since first listed30 events — show timeline
- 2026-06-03 Price Changed $179,900 BRIGHT MLS
- 2026-06-03 Relisted — BRIGHT MLS
- 2026-05-21 Contingent — BRIGHT MLS
- 2026-05-15 Listed $174,900 BRIGHT MLS
- 2026-05-09 Coming Soon $174,900 BRIGHT MLS
- 2026-04-04 Listing Removed — BRIGHT MLS
- 2026-03-25 Price Changed $159,900 BRIGHT MLS
- 2026-03-11 Price Changed $164,900 BRIGHT MLS
- 2026-02-06 Price Changed $169,900 BRIGHT MLS
- 2026-01-23 Listed $175,000 BRIGHT MLS
- 2025-11-08 Listing Removed — BRIGHT MLS
- 2025-11-04 Price Changed $185,000 BRIGHT MLS
- 2025-07-15 Listed $90,000 BRIGHT MLS
- 2024-11-11 Listing Removed — BRIGHT MLS
- 2024-09-26 Price Changed $185,000 BRIGHT MLS
- 2024-08-21 Listed $190,000 BRIGHT MLS
- 2022-09-26 Sold (Public Records) $141,000 Public Records
- 2022-08-18 Sold (MLS) $141,000 BRIGHT MLS
- 2022-07-21 Pending — BRIGHT MLS
- 2022-07-11 Price Changed $157,000 BRIGHT MLS
- 2022-07-02 Relisted — BRIGHT MLS
- 2022-06-21 Pending — BRIGHT MLS
- 2022-06-07 Price Changed $165,000 BRIGHT MLS
- 2022-04-27 Listed $175,000 BRIGHT MLS
- 1998-01-21 Sold (Public Records) $37,900 Public Records
- 1997-12-30 Sold (MLS) $37,900 MRIS
- 1997-11-01 Delisted — MRIS
- 1997-08-14 Listed $37,900 MRIS
- 1997-07-30 Delisted — MRIS
- 1997-01-24 Listed — MRIS
Property tax history
+0.6%/yrLatest (2025): $3,956 · +0.3% YoY. Source: county tax records.
Cash-flow waterfall
monthlySold comps — $/sqft
last 12 mo · ≤1 miLoading sold comps…