153 Lillian Drive Dr · Dalton, GA
Flood risk 1/10 · Minimal
- FEMA flood zone
- X (unshaded)
- Chance of flooding over 30 yrs
- 0.0%
- Est. flood insurance / yr
- $507 – $1,088
Fire risk 3/10 · Minor
- Est. fire insurance / yr
- $963 – $1,789
Heat risk 6/10 · Moderate
- Hot days now (above 107°F)
- 7 days/yr
- Hot days in 30 yrs
- 19 days/yr
Wind risk 3/10 · Minor
- Chance of severe wind over 30 yrs
- 7.0%
Air-quality risk 3/10 · Minor
- Unhealthy air days now
- 2 days/yr
- Unhealthy air days in 30 yrs
- 2 days/yr
Risk factors via First Street. Map © Google.
Why this score? — see what drove the D- grade
The composite is a weighted blend of 9 inputs, each scored 0–100. Each bar is that input's sub-score; the figure is the points it added to the 100-point composite (weight × sub-score).
- Cash flow +12.8/30.0
- ARV discount +5.6/15.0
- DSCR +3.8/10.0
- Livability +3.4/5.0
- 1% rule +3.0/10.0
- Schools +3.0/10.0
- Rent growth +2.7/5.0
- Condition / age +2.5/5.0
- Appreciation +0.0/10.0
$230,000
🖨 Deal sheet (PDF) 📄 Offer letter ✓ Due diligence
Listing remarks
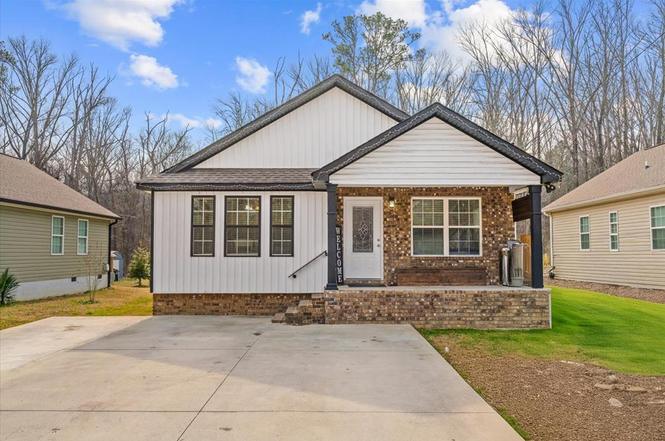
Beautiful 2020 3 bed/2 bath ranch house in an excellent location in Dalton GA. This charming one-level home features a striking mix of brick and board-and-batten exterior, complemented by a welcoming covered porch. Inside, enjoy a bright, open layout filled with good natural lighting and modern finishes. The lovely living areas flow seamlessly, perfect for everyday living and entertaining. Step outside to a low maintenance yard, pool, and large storage. Located in a quiet setting near local amenities. Don't miss this opportunity-schedule your showing today!
Key facts
- Covered porch
- Low maintenance yard
- Quiet setting
Tags
Property features AI
Exterior
- Parking: Concrete parking
- Security: Smoke detector(s)
- Utilities: Public water; Public sewer
- Home design: Single-family residence (site built); One level / 1 story; Subdivision: New Smith
- Construction: Vinyl siding; Composition roof
- Exterior features: Above-ground private pool; Cleared lot
Interior
- Kitchen: Microwave; Electric oven; Electric range
- Flooring: Vinyl flooring
- Bathrooms: 2 full bathrooms
- Heating & cooling: Central heating; Central air; Ceiling fan(s)
- Interior features: Kitchen island; 7 total rooms
Neighborhood map
What this means for you Summary
Snapshot
- This is a 3-bed/2.0-bath single-family listed at $230k.
Deal economics
- At list price, monthly cash flow is $-20 ($-237/yr) — negative.
- To cash-flow at today's rent, offer at most $227k (1.5% below list).
- To meet the 1% rule (rent ≥ 1% of price), the offer needs to be $184k (20.1% below list).
- Recommended offer: $184k (20.1% below list) — sets the bar for 1% rule.
- Cap rate 6.2% vs local median 3.4% in Dalton — top-decile yield for the area; either an underpriced asset or a hidden risk that comps aren't pricing in. Stress-test before assuming the spread holds.
Location & tenants
- Location reads 67/100 on livability (#172 in GA) — a middle-class / working-renter tenant base. Strengths: cost of living A+, housing A+; Watch: employment D, amenities F, commute F.
- Whitfield County (rural): math 37% / reading 34% proficiency, ranked #62 of 174 in GA (top 36%) — families likely to look elsewhere, expect single-tenant / working-renter base with shorter leases; 61% free/reduced lunch — lower-income household profile, screen leases tightly.
- Zoned schools: Antioch Elementary School (math 42% / reading 32%, grade F, #485 of 1,228 statewide, top 41%, 464 students, 90% FRL); Eastbrook Middle School (math 23% / reading 27%, grade F, #291 of 470 statewide, top 64%, 680 students, 87% FRL); Southeast Whitfield County High School (math 30% / reading 19%, grade F, #184 of 424 statewide, top 48%, 1,492 students, 76% FRL) — zoned schools average 84% FRL vs 61% district-wide (23 pts higher); higher-poverty schools than district average — tighter screening recommended.
- Market conditions: Rents flat; 199 active listings in the ZIP; solid renter incomes; 374 units permitted in Whitfield County in 2024 (35 in 5+ unit buildings).
Forward outlook
- Local home prices are declining (-3.0%/yr); year-one equity from $2k of loan paydown is wiped out by about $7k of value loss. Plan a longer hold.
- Whitfield County population projected at +3% by 2050 — modest demand growth; plan on rents tracking national, not racing it.
Negotiation context
- It's been on market 74 days — a 6% lower offer ($216k) is reasonable based on typical stale-listing flexibility.
Risks & watch-outs
- Climate carrying-cost: extreme-heat days projected 7→19/yr by 2055 (HVAC capex compounding) — expect insurance premiums to compound above CPI over the hold.
Questions for the listing agent
- What do current leases actually rent for vs. the listed asking? Can we see a recent rent roll and the last 12 months of T-12 income?
- It's been on market 74 days. Have you received any prior offers? Is the seller open to a 20% concession, seller financing, or rate buy-down credit?
- Why hasn't it sold? Are there any deal-killer items the seller is aware of (foundation, flood, title, zoning, code violations)?
- Is there a deadline driving the sale (1031 exchange, divorce, estate, relocation)? That informs how much negotiation room exists.
- Schools are F-rated, which usually means shorter tenancies and higher turnover. Who's the typical renter profile here, and what's been the actual vacancy rate?
- The area grade is low — what's the realistic commute time and amenity access for the typical tenant pool here? Any planned neighborhood developments (good or bad) we should know about?
- What's the average days-on-market for RENTAL listings here right now (not sales)? A rising rental-DOM trend means longer vacancies and softer asking-rent achievability than the comps imply.
- What's the recent tenant-quality profile in this submarket — average credit score on applications, eviction rate, late-payment / NSF rate, and stable-employment percentage? A property-management company in the area should have these aggregated.
- How much new for-sale + rental construction is in the pipeline within 1–3 miles? Heavy new supply typically softens prices + rents 12–24 months out; constrained supply supports both.
Investment metrics
- 1% rule
- 0.80% ✗
- Cap rate
- 6.19%
- Cash-on-cash
- -0.37%
- DSCR
- 0.98
- GRM
- 10.4
CMA / ARV
- ARV (on-the-fly)
- $220,542
- Comps found
- 3
Show comp detail 3 sales within ~0.75 mi
| Address | Dist | Beds/Ba | Sqft | Sold | Price | $/sf | Match |
|---|---|---|---|---|---|---|---|
| 153 Lillian Drive Dr | 0.00mi | 3/2.0 | 1,246 (0%) | 1mo | $225,000 | $181 | 99 |
| 1109 Smith Springs Drive Dr | 0.26mi | 3/1.0 | 1,386 (+11%) | 22mo | $140,000 | $101 | 47 |
| 2834 Suncrest Dr | 0.68mi | 2/1.0 (-1) | 1,215 (-2%) | 23mo | $215,000 | $177 | 36 |
Match score weights: distance 35% · size 25% · config 20% · recency 20%. Top-matched comps best support the ARV.
Projected returns pro-forma
-3.0% appreciation · 0.88% rent growth · sell at horizon
- IRR
- -19.2%
- Equity multiple
- 0.34×
- Total profit
- $-42,411
- Equity at exit
- $34,294
- IRR
- -16.5%
- Equity multiple
- 0.16×
- Total profit
- $-53,833
- Equity at exit
- $19,886
Cash invested: $64,400 (down + closing). Projections, not guarantees.
Landlord ↔ Tenant lean methodology
- Overall (STATE)
- 90 Strongly Landlord-Friendly
- State Georgia
- 90 Strongly Landlord-Friendly · R+3
- County
- — inherits STATE
- City
- — inherits STATE
ZIP-level market 30121
- Home prices YoY
- -13.2%
- Rents YoY
- 0.9%
- Active inventory
- 199
- Price-to-rent
- 10.4×
Monthly cashflow live
- Estimated rent
- $1,838 medium interval (Pro) →
- Mortgage (P&I)
- −$1,206
- Tax from tax record
- −$170 /mo · $2,042/yr
- Insurance
- −$96
- HOA
- −$0
- Vacancy / Maint / Mgmt
- −$386
- Net cashflow
- $-20
Break-even live
Sensitivity live
| Price | -10% $110 | -5% $45 | +0% $-20 | +5% $-85 | +10% $-150 |
|---|---|---|---|---|---|
| Rent | -10% $-165 | -5% $-92 | +0% $-20 | +5% $53 | +10% $126 |
| Rate | -1.0pp $96 | -0.5pp $39 | base $-20 | +0.5pp $-79 | +1.0pp $-140 |
UW: 25.0% down · 7.5% · 30yr · 1.5% tax · 5.0% vac · 8.0% maint · 8.0% mgmt
Financing live
Cash to close
- Down payment
- $57,500
- Closing costs
- $6,900
- Reserves months
- —
- Total cash needed
- —
Loan-product check · same deal, 3 products live
Conventional
25% down · 7.5% · 30yr
- Down + closing
- —
- Monthly P&I
- —
- Monthly cashflow
- —
- DSCR
- —
- Eligible?
- —
Personal DTI + credit; lowest rate.
DSCR
20% down · 8.5% · 30yr
- Down + closing
- —
- Monthly P&I
- —
- Monthly cashflow
- —
- DSCR
- —
- Eligible?
- —
No personal income docs; deal must DSCR.
Hard money
10% down · 12.0% · 12mo
- Down + closing
- —
- Monthly P&I
- —
- Monthly cashflow
- —
- DSCR
- —
- Eligible?
- —
Short-term bridge; refi at stabilization.
Listing history 3 events
-
2026-04-20status Pending
-
2026-03-24price $230,000
-
2026-02-05$235,000 Active
ⓘ Source: listings_history table (triggers on properties + properties_extension) + one-shot
backfill from property_details.listing_events for pre-trigger history.
Tax reassessment forecast GA · Resets to sale price
- Current annual tax
- $2,042 · $170/mo
- Projected year-2 tax
- $2,116 · $176/mo
- Expected delta
- +$74/yr (+$6/mo · 3.6%)
ⓘ Screening estimate from a state-policy table — verify with the county assessor before closing.
Climate risk First Street
- Flood 1/10 Low FEMA zone X (unshaded) · 0% chance over 30 yrs
- Wildfire 3/10 Moderate
- Heat 6/10 Major 7 d/yr ≥107°F today · 19 d/yr by 30 yrs out
- Wind 3/10 Moderate 7% chance of damaging wind over 30 yrs
- Air quality 3/10 Moderate 2 unhealthy d/yr today · 2 by 30 yrs out
Nearby sold comps map
Loading sold comps map…
Walkable amenities ~0.75 mi
Loading nearby amenities…
Taxation est. · year 1
- Rental income
- $22,062
- − Mortgage interest
- −$12,884
- − Property taxes
- −$2,042
- − Insurance
- −$1,150
- − Repairs & maintenance
- −$1,765
- − Management
- −$1,765
- − Depreciation
- −$6,691
- Taxable loss
- −$4,234
- Est. tax savings @ 24.0%
- +$1,016
- After-tax cash flow
- $780/yr
For passive investors: Depreciation is non-cash, so a rental often shows a tax loss while cash-flowing — sheltering income. Rental losses are passive: they offset passive income freely, and up to $25,000/yr can offset ordinary (W-2) income if you actively participate and your MAGI is under $100k (phasing out to $0 by $150k); unused losses carry forward. On sale, claimed depreciation is recaptured at up to 25%, and gains may owe capital-gains tax (a 1031 exchange can defer both). Figures are a year-1 estimate at your 24.0% rate — not tax advice; consult a CPA.
Schools (NCES district)
- District
- Whitfield County
- NCES district ID
- 1305700
- Math proficiency
- 37% ▼ -6.00%
- Reading proficiency
- 34% ▼ -9.00%
- Median HH income
- $44,296
- Composite
- 30.24/100
- National rank
- #6290
- State rank
- #62 of 174 in GA
Livability — Dalton
- Score
- 67/100
- State rank
- #172
- US rank
- #10778
Category grades
Schools grade is shown separately in the Schools card above.
Census & demographics
- County
- Bartow County · 85,497 people
- City population
- 80,309
- Metro
- Atlanta-Sandy Springs-Alpharetta, GA
- Population (ZIP)
- 25,989
- Household income
- $78,366
- Rent vs Own
- Severe rent burden
- 731.0
Population outlook (Whitfield County) Hauer SSP2
- Today (2025)
- 107,770 people
- By 2030
- 108,737 · +0.9%
- By 2040
- 110,260 · +2.3%
- By 2050
- 111,205 · +3.2%
- By 2075
- 113,014 · +4.9%
- By 2100
- 112,775 · +4.6%
Race, ethnicity, and origin ACS 2023
- Neighborhood character
- Predominantly White (71%)
- Race & ethnicity
- White 71% Hispanic / Latino 12% Black 12% Two or more races 8%
- Hispanic origin (detail)
- Mexican 9% Puerto Rican 2%
- Common ancestry
- Slovak 2% Lithuanian 1% Romanian 1%
- Foreign-born
- 6% · Canada
- Languages at home
- 88% English-only · Spanish 9% Other Indo-European 1% Russian/Polish/Slavic 0%
Political lean MEDSL · Whitfield
- 2024 margin
- Solid R (+44.5) · D 27.5% · R 72.0%
- 2008→2024 swing
- -4.5pp toward R · 2008: -40.0pp · 2024: -44.5pp
- All cycles
- 2024: R+44.5 2020: R+40.7 2016: R+44.8 2012: R+45.1 2008: R+40.0
Not yet ingested
- Civics
- —
Market trends
- HPI YoY
- ▼ -47.71%
- Current HPI
- 314.4117
- Rent YoY
- ▲ 0.88%
- Metro
- Atlanta-Sandy Springs-Alpharetta, GA
- State GDP YoY
- ▲ 2.66%
- F500 in state
- 28
Industry mix (Fortune 500 HQ in GA)
| Industry | F500 HQs | Revenue |
|---|---|---|
| Paper / Packaging | 2 | $29B |
|
||
| Retail | 1 | $160B |
|
||
| Transportation / Logistics | 1 | $91B |
|
||
| Airlines | 1 | $62B |
|
||
| Consumer Goods | 1 | $47B |
|
||
| Utilities | 1 | $25B |
|
||
Price history
-2.1% since first listed3 events — show timeline
- 2026-04-20 Pending — CCARMLS
- 2026-03-24 Price Changed $230,000 CCARMLS
- 2026-02-05 Listed $235,000 CCARMLS
Property tax history
+76.0%/yrLatest (2025): $2,042 · +18.1% YoY. Source: county tax records.
Cash-flow waterfall
monthlySold comps — $/sqft
last 12 mo · ≤1 miLoading sold comps…