 22-Plex
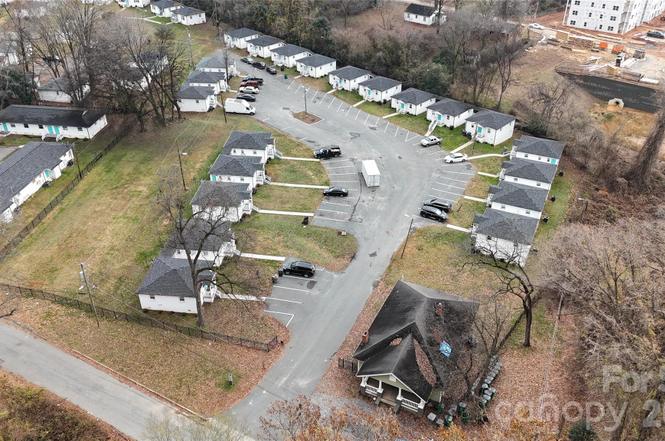
2479 Julia Ave · Charlotte, NC
Flood risk 1/10 · Minimal
- FEMA flood zone
- X (unshaded)
- Chance of flooding over 30 yrs
- 0.0%
- Est. flood insurance / yr
- $507 – $1,088
Fire risk 1/10 · Minimal
- Est. fire insurance / yr
- $906 – $1,684
Heat risk 6/10 · Moderate
- Hot days now (above 104°F)
- 7 days/yr
- Hot days in 30 yrs
- 17 days/yr
Wind risk 5/10 · Moderate
- Chance of severe wind over 30 yrs
- 26.0%
Air-quality risk 4/10 · Minor
- Unhealthy air days now
- 4 days/yr
- Unhealthy air days in 30 yrs
- 5 days/yr
Risk factors via First Street. Map © Google.
Why this score? — see what drove the C- grade
The composite is a weighted blend of 9 inputs, each scored 0–100. Each bar is that input's sub-score; the figure is the points it added to the 100-point composite (weight × sub-score).
- Cash flow +21.0/30.0
- ARV discount +7.5/15.0
- DSCR +6.7/10.0
- 1% rule +4.7/10.0
- Livability +3.9/5.0
- Schools +3.8/10.0
- Condition / age +2.5/5.0
- Rent growth +2.1/5.0
- Appreciation +0.0/10.0
$3,000,000
🖨 Deal sheet 📄 Offer letter ✓ Due diligence
Multi-family units
County records classify this as Multi-Family (2-4 Unit). Listing-text estimate: 22 units. estimate disagrees with records
Listing remarks
This 22-unit multifamily community offers a strong lease-up and stabilization opportunity in North Charlotte with limited remaining execution risk as the improvements have been made! The property is currently ~64% occupied, with the majority of units renovated and remaining vacant units largely rent-ready, allowing for immediate NOI growth through leasing. Only the clubhouse/SFR unit and one additional unit remain unrenovated, while significant capital improvements, including new roofs, updated HVAC systems, and extensive unit renovations, have already been completed. Clubhouse built 1940, apartments are 1960. Located minutes from Camp North End and less than 10 minutes from Uptown Charlott
Key facts
- New roofs
- Updated hvac systems
- 2.28 acre lot
Tags
Property features AI
Finance
- Financial info: Multi-unit property with 22 total units
- HOA & community: No HOA; Pets allowed with conditions
Exterior
- Parking: On-site parking lot
- Utilities: City water; Public sewer; Tenants pay all utilities
- Home design: Residential income property (apartment)
- Construction: Site-built construction; Brick exterior with additional materials as noted; Crawl space foundation
- Exterior features: Publicly maintained, paved asphalt roads
Interior
- Kitchen: Dishwasher; Electric range; Microwave; Refrigerator
- Bedrooms: 47 total bedrooms; Units include twenty-one 2‑bedroom units and one 5‑bedroom unit
- Bathrooms: 23 full bathrooms
- Heating & cooling: Central heating; Central air conditioning
- Interior features: Dishwasher; Electric range; Microwave; Refrigerator
- Laundry & utility: In-unit laundry
Neighborhood map
What this means for you Summary
Snapshot
- This is a 22 × 2-bed/1.0-bath units multifamily listed at $3.00M.
Deal economics
- At list price, monthly cash flow is $4k ($51k/yr) — positive. Per door: $193/mo.
- The deal already cash-flows at list — no discount required.
- To meet the 1% rule (rent ≥ 1% of price), the offer needs to be $2.90M (3.4% below list).
- Recommended offer: $2.64M (12.0% below list) — sets the bar for market timing.
- Cap rate 8.0% vs local median 3.1% in Charlotte — top-decile yield for the area; either an underpriced asset or a hidden risk that comps aren't pricing in. Stress-test before assuming the spread holds.
Location & tenants
- Location reads 78/100 on livability (#26 in NC, #2,502 nationally) — a middle-class / working-renter tenant base. Strengths: amenities A+, commute A+, housing A+; Watch: schools D+, crime F.
- Charlotte-Mecklenburg Schools (urban): math 42% / reading 46% proficiency, ranked #85 of 178 in NC (top 48%) — families likely to look elsewhere, expect single-tenant / working-renter base with shorter leases.
- Market conditions: Rents soft (-1.8%/yr); 137 active listings in the ZIP; 8 comparable units currently listed for rent nearby; rentals at typical pace (median 16d on market — plan ~3-4 weeks tenant-placement turnaround); 11,969 units permitted in Mecklenburg County in 2024 (5,377 in 5+ unit buildings).
- At $28,979/mo this rent would consume 563% of the median local household income ($62k/yr) (locally 1143% of renters already pay >50% of income on rent) — very limited rent-growth headroom before tenants either downsize or default.
Forward outlook
- Local home prices are declining (-3.0%/yr); year-one equity from $21k of loan paydown is wiped out by about $90k of value loss. Plan a longer hold.
- Mecklenburg County population projected at +53% by 2050 — long-run rental-demand tailwind backs the buy-and-hold thesis.
Negotiation context
- It's been on market 147 days — a 12% lower offer ($2.64M) is reasonable based on typical stale-listing flexibility.
- 4 sale attempts since 3y ago with the ask held roughly flat each time — persistent listings suggest the price (not the market) is what's stuck; bring a comps-based counter.
Risks & watch-outs
- Climate carrying-cost: moderate wind risk, 26% chance of damaging wind over 30y; extreme-heat days projected 7→17/yr by 2055 (HVAC capex compounding) — expect insurance premiums to compound above CPI over the hold.
Questions for the listing agent
- It's been on market 147 days. Have you received any prior offers? Is the seller open to a 12% concession, seller financing, or rate buy-down credit?
- Can we see the unit-by-unit rent roll, current vacancy, and any below-market leases? What's the average tenancy length?
- What capital expenditures (roof, boiler, parking lot, exteriors) have been made in the last 5 years, and what's planned in the next 2?
- Built in 1960 — when were the roof, HVAC, electrical panel, plumbing, and water heater last replaced?
- Why hasn't it sold? Are there any deal-killer items the seller is aware of (foundation, flood, title, zoning, code violations)?
- Is there a deadline driving the sale (1031 exchange, divorce, estate, relocation)? That informs how much negotiation room exists.
- Schools are D-rated, which usually means shorter tenancies and higher turnover. Who's the typical renter profile here, and what's been the actual vacancy rate?
- Crime grade is F in this area — have there been break-ins, vandalism, or insurance claims at this property in the last 3 years? What carrier currently insures it and at what premium?
- What's the average days-on-market for RENTAL listings here right now (not sales)? A rising rental-DOM trend means longer vacancies and softer asking-rent achievability than the comps imply.
- What's the recent tenant-quality profile in this submarket — average credit score on applications, eviction rate, late-payment / NSF rate, and stable-employment percentage? A property-management company in the area should have these aggregated.
- How much new apartment / multifamily construction is in the pipeline within 1–3 miles? Heavy new supply (>2% of stock underway) typically softens rents 12–24 months out; light construction supports rent growth.
Investment metrics
- 1% rule
- 0.97% ✗
- Cap rate
- 7.99%
- Cash-on-cash
- 6.05%
- DSCR
- 1.27
- GRM
- 8.6
CMA / ARV
- ARV (on-the-fly)
- $336,600
- Comps found
- 2
Show comp detail 2 sales within ~0.75 mi
| Address | Dist | Beds/Ba | Sqft | Sold | Price | $/sf | Match |
|---|---|---|---|---|---|---|---|
| 929 Mcarthur Ave | 0.53mi | 6/2.0 (+1) | 1,550 (-9%) | 5mo | $307,500 | $198 | 47 |
| 2308 Augusta St | 0.59mi | 6/2.0 (+1) | 1,631 (-4%) | 14mo | $305,000 | $187 | 45 |
Match score weights: distance 35% · size 25% · config 20% · recency 20%. Top-matched comps best support the ARV.
Projected returns pro-forma
-3.0% appreciation · 0.0% rent growth · sell at horizon
- IRR
- -10.1%
- Equity multiple
- 0.64×
- Total profit
- $-302,051
- Equity at exit
- $447,310
- IRR
- -5.2%
- Equity multiple
- 0.71×
- Total profit
- $-247,168
- Equity at exit
- $259,385
Cash invested: $840,000 (down + closing). Projections, not guarantees.
Landlord ↔ Tenant lean methodology
- Overall (STATE)
- 85 Strongly Landlord-Friendly
- State North Carolina
- 85 Strongly Landlord-Friendly · R+3
- County
- — inherits STATE
- City
- — inherits STATE
ZIP-level market 28206
- Home prices YoY
- -20.7%
- Rents YoY
- -1.8%
- Active inventory
- 137
- Price-to-rent
- 189.8×
Monthly cashflow live
- Estimated rent
- $28,979 high interval (Pro) →
- Mortgage (P&I)
- −$15,732
- Tax from tax record
- −$1,674 /mo · $20,092/yr
- Insurance
- −$1,250
- HOA
- −$0
- Vacancy / Maint / Mgmt
- −$6,086
- Net cashflow
- $4,237
Break-even live
22-unit breakdown (identical units grouped — click to expand)
| Units | Beds | Baths | Est. rent |
|---|---|---|---|
| 22× units | 2 | 1 | $28,974 |
| #1 | 2 | 1 | $1,317 |
| #2 | 2 | 1 | $1,317 |
| #3 | 2 | 1 | $1,317 |
| #4 | 2 | 1 | $1,317 |
| #5 | 2 | 1 | $1,317 |
| #6 | 2 | 1 | $1,317 |
| #7 | 2 | 1 | $1,317 |
| #8 | 2 | 1 | $1,317 |
| #9 | 2 | 1 | $1,317 |
| #10 | 2 | 1 | $1,317 |
| #11 | 2 | 1 | $1,317 |
| #12 | 2 | 1 | $1,317 |
| #13 | 2 | 1 | $1,317 |
| #14 | 2 | 1 | $1,317 |
| #15 | 2 | 1 | $1,317 |
| #16 | 2 | 1 | $1,317 |
| #17 | 2 | 1 | $1,317 |
| #18 | 2 | 1 | $1,317 |
| #19 | 2 | 1 | $1,317 |
| #20 | 2 | 1 | $1,317 |
| #21 | 2 | 1 | $1,317 |
| #22 | 2 | 1 | $1,317 |
| Total (22 units) | $28,979 | ||
UW: 25.0% down · 7.5% · 30yr · 1.5% tax · 5.0% vac · 8.0% maint · 8.0% mgmt
Financing live
Cash to close
- Down payment
- $750,000
- Closing costs
- $90,000
- Reserves months
- —
- Total cash needed
- —
Loan-product check · same deal, 3 products live
Conventional
25% down · 7.5% · 30yr
- Down + closing
- —
- Monthly P&I
- —
- Monthly cashflow
- —
- DSCR
- —
- Eligible?
- —
Personal DTI + credit; lowest rate.
DSCR
20% down · 8.5% · 30yr
- Down + closing
- —
- Monthly P&I
- —
- Monthly cashflow
- —
- DSCR
- —
- Eligible?
- —
No personal income docs; deal must DSCR.
Hard money
10% down · 12.0% · 12mo
- Down + closing
- —
- Monthly P&I
- —
- Monthly cashflow
- —
- DSCR
- —
- Eligible?
- —
Short-term bridge; refi at stabilization.
Rent comps 8 comps
| Address | Beds | Baths | Sqft | Rent | $/sqft | DOM | Units | Dist |
|---|---|---|---|---|---|---|---|---|
| 1512 Norris Ave Charlotte, NC | 4.0 | 2.5 | 1383 | $2,970 | $2.15 | 16d | 1 | 0.66mi |
| 1408 Dean St Charlotte, NC | 5.0 | 1.5 | 1245 | $1,850 | $1.49 | 14d | 1 | 0.80mi |
| 2320 Olando St Unit 1 Charlotte, NC | 4.0 | 2.0 | 1206 | $1,650 | $1.37 | 7d | 1 | 1.13mi |
| 2737 Celia Ave Charlotte, NC | 4.0 | 2.0 | 1796 | $2,800 | $1.56 | 17d | 1 | 1.39mi |
| 2507 Booker Ave Charlotte, NC | 4.0 | 2.5 | 1664 | $2,250 | $1.35 | 23d | 1 | 1.40mi |
| 5044 Downhaul Dr Charlotte, NC | 4.0 | 2.5 | 2128 | $2,500 | $1.17 | 16d | 1 | 1.42mi |
| 110 Razades Way Charlotte, NC | 4.0 | 1.0–4.0 | 917 | $3,502 | $3.82 | 2d | 48 | 1.46mi |
| 415 Cemetery St Charlotte, NC | 4.0 | 2.0 | 1714 | $2,800 | $1.63 | 23d | 1 | 1.47mi |
Listing history 23 events
-
2026-06-18days on market $3,000,000 Active 147 DOM
-
2026-06-17days on market $3,000,000 Active 146 DOM
-
2026-06-16days on market $3,000,000 Active 145 DOM
-
2026-06-15days on market $3,000,000 Active 144 DOM
-
2026-06-13days on market $3,000,000 Active 142 DOM
-
2026-06-10days on market $3,000,000 Active 138 DOM
-
2026-06-08days on market $3,000,000 Active 137 DOM
-
2026-06-07days on market $3,000,000 Active 136 DOM
-
2026-06-04days on market $3,000,000 Active 133 DOM
-
2026-06-03days on market $3,000,000 Active 132 DOM
-
2026-06-02days on market $3,000,000 Active 131 DOM
-
2026-06-02days on market $3,000,000 Active 130 DOM
-
2026-05-31days on market $3,000,000 Active 129 DOM
-
2026-02-20status Active
-
2026-02-09historical Active Under Contract
-
2026-01-22$3,000,000 Active
-
2024-05-09historical $1,335
-
2024-04-10$1,335
-
2023-12-13historical $1,335
-
2023-11-23$1,335
-
2022-06-10soldstatus $8,500,000
-
2000-10-13soldstatus $2,175,000
-
1980-08-01soldstatus $83,000
ⓘ Source: listings_history table (triggers on properties + properties_extension) + one-shot
backfill from property_details.listing_events for pre-trigger history.
Tax reassessment forecast NC · Resets to sale price
- Current annual tax
- $20,092 · $1,674/mo
- Projected year-2 tax
- $24,600 · $2,050/mo
- Expected delta
- +$4,508/yr (+$376/mo · 22.4%)
ⓘ Screening estimate from a state-policy table — verify with the county assessor before closing.
Climate risk First Street
- Flood 1/10 Low FEMA zone X (unshaded) · 0% chance over 30 yrs
- Wildfire 1/10 Low
- Heat 6/10 Major 7 d/yr ≥104°F today · 17 d/yr by 30 yrs out
- Wind 5/10 Major 26% chance of damaging wind over 30 yrs
- Air quality 4/10 Moderate 4 unhealthy d/yr today · 5 by 30 yrs out
Nearby sold comps map
Loading sold comps map…
Walkable amenities ~0.75 mi
Loading nearby amenities…
Taxation est. · year 1
- Rental income
- $347,748
- − Mortgage interest
- −$168,047
- − Property taxes
- −$20,092
- − Insurance
- −$15,000
- − Repairs & maintenance
- −$27,820
- − Management
- −$27,820
- − Depreciation
- −$87,273
- Taxable income
- $1,697
- Est. tax owed @ 24.0%
- −$407
- After-tax cash flow
- $50,434/yr
For passive investors: Depreciation is non-cash, so a rental often shows a tax loss while cash-flowing — sheltering income. Rental losses are passive: they offset passive income freely, and up to $25,000/yr can offset ordinary (W-2) income if you actively participate and your MAGI is under $100k (phasing out to $0 by $150k); unused losses carry forward. On sale, claimed depreciation is recaptured at up to 25%, and gains may owe capital-gains tax (a 1031 exchange can defer both). Figures are a year-1 estimate at your 24.0% rate — not tax advice; consult a CPA.
Schools (NCES district)
- District
- Charlotte-Mecklenburg Schools
- NCES district ID
- 3702970
- Math proficiency
- 42% ▼ -6.00%
- Reading proficiency
- 46% ▲ 1.00%
- Median HH income
- $57,175
- Composite
- 38.49/100
- National rank
- #4183
- State rank
- #85 of 178 in NC
Livability — Charlotte
- Score
- 78/100
- State rank
- #26
- US rank
- #2502
Category grades
Schools grade is shown separately in the Schools card above.
Census & demographics
- Census place
- Charlotte, NC
- County
- Mecklenburg County · 1,167,319 people
- City population
- 920,422
- Metro
- Charlotte-Concord-Gastonia, NC-SC
- Population (ZIP)
- 15,375
- Household income
- $61,818
- Rent vs Own
- Severe rent burden
- 1143.0
Population outlook (Mecklenburg County) Hauer SSP2
- Today (2025)
- 1,305,740 people
- By 2030
- 1,442,752 · +10.5%
- By 2040
- 1,722,441 · +31.9%
- By 2050
- 1,999,450 · +53.1%
- By 2075
- 2,642,495 · +102.4%
- By 2100
- 3,106,755 · +137.9%
Race, ethnicity, and origin ACS 2023
- Neighborhood character
- Diverse neighborhood (Simpson 0.56)
- Race & ethnicity
- Black 62% White 18% Hispanic / Latino 16% Two or more races 6% Asian 3%
- Hispanic origin (detail)
- Mexican 7% Puerto Rican 1%
- Common ancestry
- Romanian 1%
- Foreign-born
- 14% · Canada, Vietnam, United Kingdom
- Languages at home
- 79% English-only · Spanish 14% French/Haitian/Cajun 2% Other Indo-European 1%
Political lean MEDSL · Mecklenburg
- 2024 margin
- Solid D (+32.9) · D 65.6% · R 32.7% · Other 1.6%
- 2008→2024 swing
- +8.5pp toward D · 2008: 24.4pp · 2024: 32.9pp
- All cycles
- 2024: D+32.9 2020: D+35.1 2016: D+29.9 2012: D+22.5 2008: D+24.4
Not yet ingested
- Civics
- —
Market trends
- HPI YoY
- ▼ -82.97%
- Current HPI
- 317.6081
- Rent YoY
- ▼ -1.79%
- Metro
- Charlotte-Concord-Gastonia, NC-SC
- State GDP YoY
- ▲ 3.28%
- F500 in state
- 26
Industry mix (Fortune 500 HQ in NC)
| Industry | F500 HQs | Revenue |
|---|---|---|
| Financial Services | 2 | $213B |
|
||
| Retail | 2 | $95B |
|
||
| Industrial Conglomerate | 1 | $38B |
|
||
| Metals / Steel | 1 | $35B |
|
||
| Utilities | 1 | $30B |
|
||
| Industrial Machinery | 1 | $19B |
|
||
Price history
+3514.5% since first listed10 events — show timeline
- 2026-02-20 Relisted — CANOPYMLS as Distributed by MLS Grid
- 2026-02-09 Contingent — CANOPYMLS as Distributed by MLS Grid
- 2026-01-22 Listed $3,000,000 CANOPYMLS as Distributed by MLS Grid
- 2024-05-09 Rental Removed $1,335 APPFOLIO
- 2024-04-10 Listed for Rent $1,335 APPFOLIO
- 2023-12-13 Rental Removed $1,335 APPFOLIO
- 2023-11-23 Listed for Rent $1,335 APPFOLIO
- 2022-06-10 Sold (Public Records) $8,500,000 Public Records
- 2000-10-13 Sold (Public Records) $2,175,000 Public Records
- 1980-08-01 Sold (Public Records) $83,000 Public Records
Property tax history
+6.3%/yrLatest (2025): $20,092 · +29.7% YoY. Source: county tax records.
Cash-flow waterfall
monthlySold comps — $/sqft
last 12 mo · ≤1 miLoading sold comps…