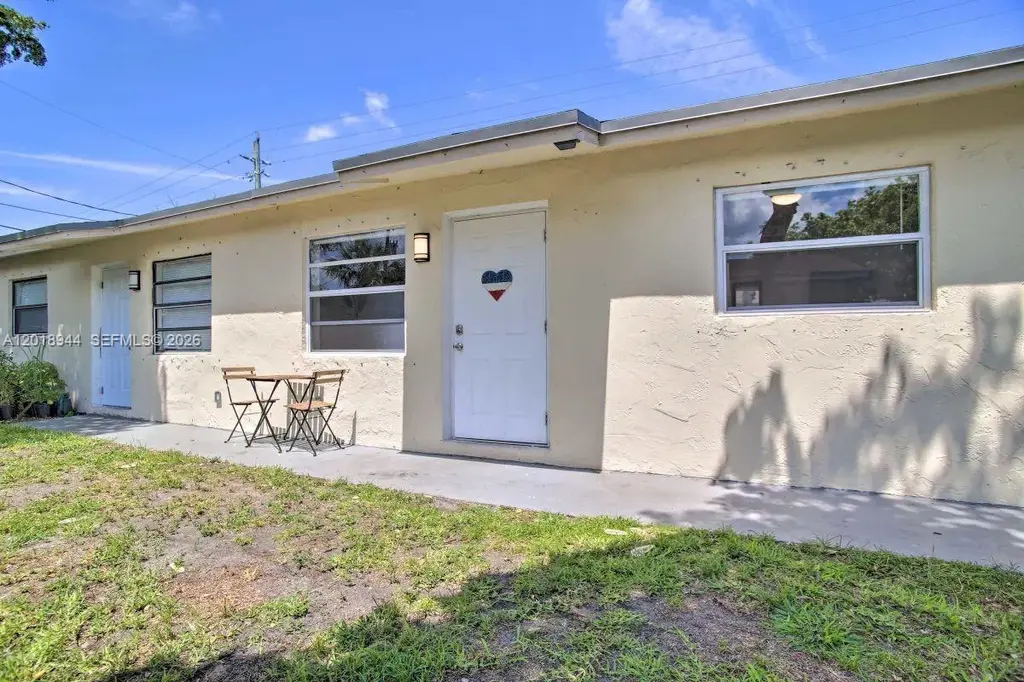
 Duplex
2703 NW 13th St · Roosevelt Gardens, FL
Flood risk 1/10 · Minimal
- FEMA flood zone
- X (shaded)
- Chance of flooding over 30 yrs
- 0.0%
- Est. flood insurance / yr
- $507 – $1,088
Fire risk 1/10 · Minimal
- Est. fire insurance / yr
- $947 – $1,759
Heat risk 9/10 · Severe
- Hot days now (above 105°F)
- 3 days/yr
- Hot days in 30 yrs
- 10 days/yr
Wind risk 10/10 · Severe
- Chance of severe wind over 30 yrs
- 99.0%
Air-quality risk 2/10 · Minimal
- Unhealthy air days now
- 2 days/yr
- Unhealthy air days in 30 yrs
- 2 days/yr
Risk factors via First Street. Map © Google.
Why this score? — see what drove the D grade
The composite is a weighted blend of 9 inputs, each scored 0–100. Each bar is that input's sub-score; the figure is the points it added to the 100-point composite (weight × sub-score).
- Cash flow +13.2/30.0
- ARV discount +7.5/15.0
- Schools +4.1/10.0
- DSCR +4.0/10.0
- Livability +3.8/5.0
- Condition / age +3.8/5.0
- 1% rule +3.7/10.0
- Rent growth +3.2/5.0
- Appreciation +0.0/10.0
$454,900
🖨 Deal sheet (PDF) 📄 Offer letter ✓ Due diligence
Multi-family units
County records classify this as Multi-Family (2-4 Unit). Listing-text estimate: 2 units. confirmed
Listing remarks
ATTENTION INVESTORS, 9% CAPRATE. legal duplex. separate water and electric meters, AC replaced in 2025, roof in good condition. Excellent tenants in place. Great investment DO NOR DISTURBE TENANTS
Key facts
- Ac replaced
- Legal duplex
- Excellent tenants
Tags
Property features AI
Finance
- Financial info: Unit rents reported: two units at $2,100 and $1,900 (some units month-to-month or leased); Rent includes gardener
Exterior
- Parking: Open parking for multiple vehicles (total 4 parking spaces)
- Utilities: Public sewer; Cable not available
- Home design: Single-story property; Resale home
- Construction: Block construction; Shingle roof
- Exterior features: Less than quarter acre lot; RD-10 zoning
Interior
- Bedrooms: Three 2-bedroom units (two in one unit type, one in the other)
- Flooring: Vinyl
- Bathrooms: Each unit has 1 full bathroom
- Heating & cooling: Central heating; Central air conditioning
- Interior features: Vinyl flooring
Neighborhood map
What this means for you Summary
Snapshot
- This is a 2 × 3-bed/1.5-bath units multifamily listed at $455k. Condition is rated good.
Deal economics
- At list price, monthly cash flow is $-11 ($-127/yr) — negative. Per door: $-5/mo.
- To cash-flow at today's rent, offer at most $453k (0.3% below list).
- To meet the 1% rule (rent ≥ 1% of price), the offer needs to be $397k (12.8% below list).
- Recommended offer: $397k (12.8% below list) — sets the bar for 1% rule.
Location & tenants
- Location reads 76/100 on livability (#240 in FL, #3,794 nationally) — a middle-class / working-renter tenant base. Strengths: crime A+, cost of living A+, housing A+; Watch: amenities F, commute F, employment D-.
- Broward (suburban): math 42% / reading 53% proficiency, ranked #46 of 73 in FL (top 63%) — families likely to look elsewhere, expect single-tenant / working-renter base with shorter leases.
- Zoned schools: Nova Blanche Forman Elementary (math 35% / reading 55%, grade D-, #1,271 of 2,144 statewide, top 60%, 769 students, 72% FRL); Nova Middle School (math 44% / reading 53%, grade C-, #274 of 571 statewide, top 50%, 1,284 students, 68% FRL); Nova High School (math 22% / reading 56%, grade F, #312 of 667 statewide, top 48%, 2,227 students, 59% FRL) — zoned schools average 66% FRL vs 51% district-wide (15 pts higher); higher-poverty schools than district average — tighter screening recommended.
- Market conditions: Rents rising (+2.8%/yr); 590 active listings in the ZIP; 1 comparable units currently listed for rent nearby; 2,111 units permitted in Broward County in 2024 (1,265 in 5+ unit buildings).
- At $3,966/mo this rent would consume 88% of the median local household income ($54k/yr) (locally 5068% of renters already pay >50% of income on rent) — very limited rent-growth headroom before tenants either downsize or default.
Forward outlook
- Local home prices are declining (-3.0%/yr); year-one equity from $3k of loan paydown is wiped out by about $14k of value loss. Plan a longer hold.
- Broward County population projected at +34% by 2050 — long-run rental-demand tailwind backs the buy-and-hold thesis.
Negotiation context
- It's been on market 22 days — a 2% lower offer ($448k) is reasonable based on typical stale-listing flexibility.
Risks & watch-outs
- Climate carrying-cost: severe wind risk, 99% chance of damaging wind over 30y; extreme-heat days projected 3→10/yr by 2055 (HVAC capex compounding) — expect insurance premiums to compound above CPI over the hold.
Questions for the listing agent
- What do current leases actually rent for vs. the listed asking? Can we see a recent rent roll and the last 12 months of T-12 income?
- Can we see the unit-by-unit rent roll, current vacancy, and any below-market leases? What's the average tenancy length?
- What capital expenditures (roof, boiler, parking lot, exteriors) have been made in the last 5 years, and what's planned in the next 2?
- Is there a deadline driving the sale (1031 exchange, divorce, estate, relocation)? That informs how much negotiation room exists.
- Schools are A-rated — typically a magnet for longer-tenancy family renters. What's the average tenant stay here, and is there a school-zone premium baked into asking?
- The area grade is low — what's the realistic commute time and amenity access for the typical tenant pool here? Any planned neighborhood developments (good or bad) we should know about?
- What's the average days-on-market for RENTAL listings here right now (not sales)? A rising rental-DOM trend means longer vacancies and softer asking-rent achievability than the comps imply.
- What's the recent tenant-quality profile in this submarket — average credit score on applications, eviction rate, late-payment / NSF rate, and stable-employment percentage? A property-management company in the area should have these aggregated.
- How much new apartment / multifamily construction is in the pipeline within 1–3 miles? Heavy new supply (>2% of stock underway) typically softens rents 12–24 months out; light construction supports rent growth.
Investment metrics
- 1% rule
- 0.87% ✗
- Cap rate
- 6.27%
- Cash-on-cash
- -0.10%
- DSCR
- 1.00
- GRM
- 9.6
CMA / ARV
No comps found within radius.
Projected returns pro-forma
-3.0% appreciation · 2.78% rent growth · sell at horizon
- IRR
- -16.7%
- Equity multiple
- 0.41×
- Total profit
- $-75,203
- Equity at exit
- $67,827
- IRR
- -8.9%
- Equity multiple
- 0.45×
- Total profit
- $-69,688
- Equity at exit
- $39,331
Cash invested: $127,372 (down + closing). Projections, not guarantees.
Landlord ↔ Tenant lean methodology
- Overall (STATE)
- 87 Strongly Landlord-Friendly
- State Florida
- 87 Strongly Landlord-Friendly · R+3
- County
- — inherits STATE
- City
- — inherits STATE
ZIP-level market 33311
- Rents YoY
- 2.8%
- Active inventory
- 590
- Price-to-rent
- 19.1×
Monthly cashflow live
- Estimated rent
- $3,966 high interval (Pro) →
- Mortgage (P&I)
- −$2,386
- Tax est. 1.5%
- −$569 /mo · $6,824/yr
- Insurance
- −$190
- HOA
- −$0
- Vacancy / Maint / Mgmt
- −$833
- Net cashflow
- $-11
Break-even live
Sensitivity live
| Price | -10% $304 | -5% $147 | +0% $-11 | +5% $-168 | +10% $-325 |
|---|---|---|---|---|---|
| Rent | -10% $-324 | -5% $-167 | +0% $-11 | +5% $146 | +10% $303 |
| Rate | -1.0pp $219 | -0.5pp $105 | base $-11 | +0.5pp $-128 | +1.0pp $-248 |
2-unit breakdown (identical units grouped — click to expand)
| Units | Beds | Baths | Est. rent |
|---|---|---|---|
| 2× units | 3 | 1.5 | $3,966 |
| #1 | 3 | 1.5 | $1,983 |
| #2 | 3 | 1.5 | $1,983 |
| Total (2 units) | $3,966 | ||
UW: 25.0% down · 7.5% · 30yr · 1.5% tax · 5.0% vac · 8.0% maint · 8.0% mgmt
Financing live
Cash to close
- Down payment
- $113,725
- Closing costs
- $13,647
- Reserves months
- —
- Total cash needed
- —
Loan-product check · same deal, 3 products live
Conventional
25% down · 7.5% · 30yr
- Down + closing
- —
- Monthly P&I
- —
- Monthly cashflow
- —
- DSCR
- —
- Eligible?
- —
Personal DTI + credit; lowest rate.
DSCR
20% down · 8.5% · 30yr
- Down + closing
- —
- Monthly P&I
- —
- Monthly cashflow
- —
- DSCR
- —
- Eligible?
- —
No personal income docs; deal must DSCR.
Hard money
10% down · 12.0% · 12mo
- Down + closing
- —
- Monthly P&I
- —
- Monthly cashflow
- —
- DSCR
- —
- Eligible?
- —
Short-term bridge; refi at stabilization.
Rent comps 1 comps
| Address | Beds | Baths | Sqft | Rent | $/sqft | DOM | Units | Dist |
|---|---|---|---|---|---|---|---|---|
| 3370 NW 8th Pl Lauderhill, FL | 5.0 | 2.0 | 1304 | $3,600 | $2.76 | 26d | 1 | 1.02mi |
Listing history 8 events
-
2026-06-07statusdays on market $454,900 Pending 22 DOM
-
2026-06-04days on market $454,900 Active Under Contract 21 DOM
-
2026-06-03days on market $454,900 Active Under Contract 20 DOM
-
2026-06-02days on market $454,900 Active Under Contract 19 DOM
-
2026-06-01days on market $454,900 Active Under Contract 18 DOM
-
2026-05-31days on market $454,900 Active Under Contract 17 DOM
-
2026-05-18historical Active Under Contract
-
2026-05-14$454,900 Active
ⓘ Source: listings_history table (triggers on properties + properties_extension) + one-shot
backfill from property_details.listing_events for pre-trigger history.
Climate risk First Street
- Flood 1/10 Low FEMA zone X (shaded) · 0% chance over 30 yrs
- Wildfire 1/10 Low
- Heat 9/10 Extreme 3 d/yr ≥105°F today · 10 d/yr by 30 yrs out
- Wind 10/10 Extreme 99% chance of damaging wind over 30 yrs
- Air quality 2/10 Low 2 unhealthy d/yr today · 2 by 30 yrs out
Nearby sold comps map
Loading sold comps map…
Walkable amenities ~0.75 mi
Loading nearby amenities…
Taxation est. · year 1
- Rental income
- $47,592
- − Mortgage interest
- −$25,481
- − Property taxes
- −$6,824
- − Insurance
- −$2,274
- − Repairs & maintenance
- −$3,807
- − Management
- −$3,807
- − Depreciation
- −$13,233
- Taxable loss
- −$7,836
- Est. tax savings @ 24.0%
- +$1,881
- After-tax cash flow
- $1,754/yr
For passive investors: Depreciation is non-cash, so a rental often shows a tax loss while cash-flowing — sheltering income. Rental losses are passive: they offset passive income freely, and up to $25,000/yr can offset ordinary (W-2) income if you actively participate and your MAGI is under $100k (phasing out to $0 by $150k); unused losses carry forward. On sale, claimed depreciation is recaptured at up to 25%, and gains may owe capital-gains tax (a 1031 exchange can defer both). Figures are a year-1 estimate at your 24.0% rate — not tax advice; consult a CPA.
Condition & rehab AI · 4 photos
This property is in good condition with recent updates, making it a solid investment opportunity.
Value-add opportunities
- Both Landscaping — Enhances curb appeal and property value
- Both Painting exterior — Improves curb appeal and property value
- Both Landscaping and exterior maintenance — Enhances curb appeal and property value
Renovation cost estimate screening
Value-add ROI direction
- Both Landscaping — Enhances curb appeal and property value ↑
- Both Painting exterior — Improves curb appeal and property value ↑
- Both Landscaping and exterior maintenance — Enhances curb appeal and property value ↑
ⓘ Cost ranges are severity-bucket heuristics (US national rule-of-thumb). Get contractor quotes + a written scope before underwriting a rehab budget.
Schools (NCES district)
- District
- Broward
- NCES district ID
- 1200180
- Math proficiency
- 42% ▼ -18.00%
- Reading proficiency
- 53% ▼ -5.00%
- Median HH income
- $52,139
- Composite
- 40.88/100
- National rank
- #3621
- State rank
- #46 of 73 in FL
Livability — Roosevelt Gardens
- Score
- 76/100
- State rank
- #240
- US rank
- #3794
Category grades
Schools grade is shown separately in the Schools card above.
Census & demographics
- Census place
- Roosevelt Gardens, FL
- County
- Broward County · 1,963,430 people
- Metro
- Miami-Fort Lauderdale-Pompano Beach, FL
- Population (ZIP)
- 74,898
- Household income
- $53,973
- Rent vs Own
- Severe rent burden
- 5068.0
Population outlook (Broward County) Hauer SSP2
- Today (2025)
- 2,207,033 people
- By 2030
- 2,360,704 · +7.0%
- By 2040
- 2,661,208 · +20.6%
- By 2050
- 2,946,698 · +33.5%
- By 2075
- 3,602,273 · +63.2%
- By 2100
- 3,970,984 · +79.9%
Race, ethnicity, and origin ACS 2023
- Neighborhood character
- Predominantly Black (77%)
- Race & ethnicity
- Black 77% Two or more races 9% White 9% Hispanic / Latino 9%
- Hispanic origin (detail)
- Mexican 1% Puerto Rican 2% Cuban 1%
- Common ancestry
- Hispanic 15% Lithuanian 1% Romanian 0%
- Foreign-born
- 24% · Canada, Jamaica
- Languages at home
- 78% English-only · French/Haitian/Cajun 14% Spanish 6% Other Indo-European 1%
Political lean MEDSL · Broward
- 2024 margin
- D (+17.0) · D 58.0% · R 41.0%
- 2008→2024 swing
- -17.8pp toward R · 2008: 34.7pp · 2024: 17.0pp
- All cycles
- 2024: D+17.0 2020: D+29.8 2016: D+35.0 2012: D+34.9 2008: D+34.7
Not yet ingested
- Civics
- —
Market trends
- HPI YoY
- ▼ -300.68%
- Current HPI
- 535.2504
- Rent YoY
- ▲ 2.78%
- Metro
- Miami-Fort Lauderdale-Pompano Beach, FL
- State GDP YoY
- ▲ 3.28%
- F500 in state
- 36
Industry mix (Fortune 500 HQ in FL)
| Industry | F500 HQs | Revenue |
|---|---|---|
| Industrial Technology | 2 | $29B |
|
||
| Insurance | 2 | $17B |
|
||
| Retail | 1 | $60B |
|
||
| Technology Distribution | 1 | $58B |
|
||
| Homebuilding | 1 | $35B |
|
||
| Technology Manufacturing | 1 | $35B |
|
||
Price history
2 events — show timeline
- 2026-05-18 Contingent — MARMLS
- 2026-05-14 Listed $454,900 MARMLS
Cash-flow waterfall
monthlySold comps — $/sqft
last 12 mo · ≤1 miLoading sold comps…