 16-Plex
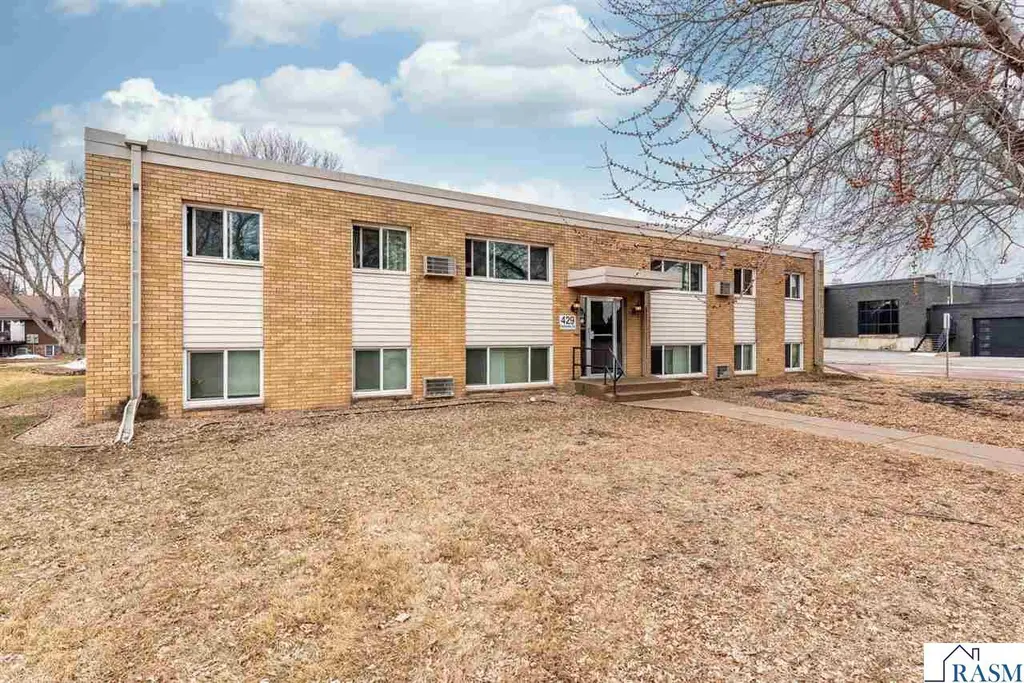
428 Commodore Dr · Mankato, MN
Flood risk 1/10 · Minimal
- FEMA flood zone
- —
- Chance of flooding over 30 yrs
- 0.0%
- Est. flood insurance / yr
- —
Fire risk 1/10 · Minimal
- Est. fire insurance / yr
- $888 – $1,650
Heat risk 2/10 · Minimal
- Hot days now (above 99°F)
- 7 days/yr
- Hot days in 30 yrs
- 15 days/yr
Wind risk 2/10 · Minimal
- Chance of severe wind over 30 yrs
- —
Air-quality risk 2/10 · Minimal
- Unhealthy air days now
- 1 days/yr
- Unhealthy air days in 30 yrs
- 1 days/yr
Risk factors via First Street. Map © Google.
Why this score? — see what drove the B grade
The composite is a weighted blend of 9 inputs, each scored 0–100. Each bar is that input's sub-score; the figure is the points it added to the 100-point composite (weight × sub-score).
- Cash flow +30.0/30.0
- DSCR +10.0/10.0
- 1% rule +9.2/10.0
- ARV discount +8.5/15.0
- Rent growth +4.6/5.0
- Schools +4.4/10.0
- Livability +3.9/5.0
- Condition / age +2.5/5.0
- Appreciation +0.0/10.0
$1,495,000
🖨 Deal sheet (PDF) 📄 Offer letter ✓ Due diligence
Multi-family units
County records classify this as Multi-Family (5+ Unit). Listing-text estimate: 16 units. confirmed
5+ unit building — per-unit beds/baths from public records are typically unavailable; the breakdown below (if shown) is an estimate from the listing text.
Listing remarks
Here is your opportunity to purchase a well located 16 unit apartment complex in Mankato MN! Consisting of 2 separate parcels and 2 separate buildings, this property offers 14 two bedroom units and 2 one bedroom units. Currently renting for $945-$989/month for the two bedroom units and $845/month for the one bedroom units, the total monthly rent income is $15,138. The total annual income is $183,841 when the coin laundry is included. The tenants pay their own electricity, cable/internet. The landlord pays the common area, electric($1,904 annually), the gas($7,762 annually), the water/sewer($7,085), the garbage($3,035), as well as lawn care, snow removal, maintenance, taxes and insurance. W
Key facts
- 0.64 acre lot
- Built 1964
- Listed 18 days
Neighborhood map
What this means for you Summary
Snapshot
- This is a 14×2bd/1.5ba + 2×1bd/1.5ba units multifamily listed at $1.50M.
Deal economics
- At list price, monthly cash flow is $7k ($89k/yr) — positive. Per door: $465/mo.
- The deal already cash-flows at list — no discount required.
- Meets the 1% rule at list price ($21k rent vs $1.50M).
- Recommended offer: $1.47M (1.5% below list) — sets the bar for market timing.
- Cap rate 12.3% vs local median 3.5% in Mankato — top-decile yield for the area; either an underpriced asset or a hidden risk that comps aren't pricing in. Stress-test before assuming the spread holds.
Location & tenants
- Location reads 77/100 on livability (#133 in MN, #2,970 nationally) — a middle-class / working-renter tenant base. Strengths: housing A+, health & safety A+, cost of living A; Watch: crime C-, amenities C-, commute F.
- Mankato Public School District (urban): math 48% / reading 56% proficiency, ranked #98 of 301 in MN (top 33%) — acceptable for families but not a draw, mixed tenant base, ~2y average lease.
- Zoned schools: Kennedy Elementary (math 57% / reading 47%, grade C-, #368 of 857 statewide, top 47%, 370 students, 52% FRL); Prairie Winds Middle School (math 40% / reading 51%, grade D+, #106 of 258 statewide, top 43%, 954 students, 47% FRL); Mankato East Senior High (math 32% / reading 62%, grade D-, #166 of 471 statewide, top 39%, 1,293 students, 42% FRL) — zoned schools average 47% FRL vs 29% district-wide (18 pts higher); higher-poverty schools than district average — tighter screening recommended.
- Market conditions: Rents rising fast (+8.6%/yr); 359 active listings in the ZIP; 269 units permitted in Blue Earth County in 2024 (154 in 5+ unit buildings).
- At $21,183/mo this rent would consume 366% of the median local household income ($70k/yr) (locally 2394% of renters already pay >50% of income on rent) — very limited rent-growth headroom before tenants either downsize or default.
Forward outlook
- Local home prices are declining (-3.0%/yr); year-one equity from $10k of loan paydown is wiped out by about $45k of value loss. Plan a longer hold.
- Blue Earth County population projected at +18% by 2050 — long-run rental-demand tailwind backs the buy-and-hold thesis.
- At projected returns (-3.0% appreciation + 8.0% rent growth), your $419k cash investment doubles in ~5 years — after that, you're playing with house money.
Negotiation context
- It's been on market 18 days — a 2% lower offer ($1.47M) is reasonable based on typical stale-listing flexibility.
- 3 sale attempts since 3y ago with the ask held roughly flat each time — persistent listings suggest the price (not the market) is what's stuck; bring a comps-based counter.
- Current owner paid $400k; list at $1.50M implies a 274% gain — meaningful room to come down on a strong offer.
Questions for the listing agent
- Can we see the unit-by-unit rent roll, current vacancy, and any below-market leases? What's the average tenancy length?
- What capital expenditures (roof, boiler, parking lot, exteriors) have been made in the last 5 years, and what's planned in the next 2?
- Built in 1964 — when were the roof, HVAC, electrical panel, plumbing, and water heater last replaced?
- Is there a deadline driving the sale (1031 exchange, divorce, estate, relocation)? That informs how much negotiation room exists.
- Schools are B-rated — typically a magnet for longer-tenancy family renters. What's the average tenant stay here, and is there a school-zone premium baked into asking?
- What's the average days-on-market for RENTAL listings here right now (not sales)? A rising rental-DOM trend means longer vacancies and softer asking-rent achievability than the comps imply.
- What's the recent tenant-quality profile in this submarket — average credit score on applications, eviction rate, late-payment / NSF rate, and stable-employment percentage? A property-management company in the area should have these aggregated.
- How much new apartment / multifamily construction is in the pipeline within 1–3 miles? Heavy new supply (>2% of stock underway) typically softens rents 12–24 months out; light construction supports rent growth.
Investment metrics
- 1% rule
- 1.42% ✓
- Cap rate
- 12.27%
- Cash-on-cash
- 21.34%
- DSCR
- 1.95
- GRM
- 5.9
CMA / ARV
- ARV (on-the-fly)
- $1,527,960
- Comps found
- 1
Show comp detail 1 sale within ~0.75 mi
| Address | Dist | Beds/Ba | Sqft | Sold | Price | $/sf | Match |
|---|---|---|---|---|---|---|---|
| 428 Commodore Dr | 0.00mi | —/— | 14,280 (0%) | 1mo | $1,525,000 | $107 | 99 |
Match score weights: distance 35% · size 25% · config 20% · recency 20%. Top-matched comps best support the ARV.
Projected returns pro-forma
-3.0% appreciation · 8.0% rent growth · sell at horizon
- IRR
- 19.1%
- Equity multiple
- 1.82×
- Total profit
- $343,520
- Equity at exit
- $222,909
- IRR
- 30.5%
- Equity multiple
- 4.39×
- Total profit
- $1,417,887
- Equity at exit
- $129,260
Cash invested: $418,600 (down + closing). Projections, not guarantees.
Landlord ↔ Tenant lean methodology
- Overall (STATE)
- 46 Balanced
- State Minnesota
- 46 Balanced · D+2
- County
- — inherits STATE
- City
- — inherits STATE
ZIP-level market 56001
- Rents YoY
- 8.6%
- Active inventory
- 359
- Price-to-rent
- 93.1×
Monthly cashflow live
- Estimated rent
- $21,183 high interval (Pro) →
- Mortgage (P&I)
- −$7,840
- Tax from tax record
- −$827 /mo · $9,926/yr
- Insurance
- −$623
- HOA
- −$0
- Vacancy / Maint / Mgmt
- −$4,448
- Net cashflow
- $7,445
Break-even live
Sensitivity live
| Price | -10% $8,291 | -5% $7,868 | +0% $7,445 | +5% $7,021 | +10% $6,598 |
|---|---|---|---|---|---|
| Rent | -10% $5,771 | -5% $6,608 | +0% $7,445 | +5% $8,281 | +10% $9,118 |
| Rate | -1.0pp $8,197 | -0.5pp $7,825 | base $7,445 | +0.5pp $7,057 | +1.0pp $6,663 |
16-unit breakdown (identical units grouped — click to expand)
| Units | Beds | Baths | Est. rent |
|---|---|---|---|
| 14× units | 2 | 1.5 | $18,732 |
| #1 | 2 | 1.5 | $1,338 |
| #2 | 2 | 1.5 | $1,338 |
| #3 | 2 | 1.5 | $1,338 |
| #4 | 2 | 1.5 | $1,338 |
| #5 | 2 | 1.5 | $1,338 |
| #6 | 2 | 1.5 | $1,338 |
| #7 | 2 | 1.5 | $1,338 |
| #8 | 2 | 1.5 | $1,338 |
| #9 | 2 | 1.5 | $1,338 |
| #10 | 2 | 1.5 | $1,338 |
| #11 | 2 | 1.5 | $1,338 |
| #12 | 2 | 1.5 | $1,338 |
| #13 | 2 | 1.5 | $1,338 |
| #14 | 2 | 1.5 | $1,338 |
| 2× units | 1 | 1.5 | $2,446 |
| #15 | 1 | 1.5 | $1,223 |
| #16 | 1 | 1.5 | $1,223 |
| Total (16 units) | $21,183 | ||
UW: 25.0% down · 7.5% · 30yr · 1.5% tax · 5.0% vac · 8.0% maint · 8.0% mgmt
Financing live
Cash to close
- Down payment
- $373,750
- Closing costs
- $44,850
- Reserves months
- —
- Total cash needed
- —
Loan-product check · same deal, 3 products live
Conventional
25% down · 7.5% · 30yr
- Down + closing
- —
- Monthly P&I
- —
- Monthly cashflow
- —
- DSCR
- —
- Eligible?
- —
Personal DTI + credit; lowest rate.
DSCR
20% down · 8.5% · 30yr
- Down + closing
- —
- Monthly P&I
- —
- Monthly cashflow
- —
- DSCR
- —
- Eligible?
- —
No personal income docs; deal must DSCR.
Hard money
10% down · 12.0% · 12mo
- Down + closing
- —
- Monthly P&I
- —
- Monthly cashflow
- —
- DSCR
- —
- Eligible?
- —
Short-term bridge; refi at stabilization.
Listing history 10 events
-
2026-03-30status Pending
-
2026-03-11$1,495,000 Active
-
2023-12-14historical $945
-
2023-10-20$945
-
2023-09-08historical $945
-
2023-08-29$945
-
2013-09-20soldstatus $400,000
-
2013-09-20soldstatus $466,000
-
1991-04-10soldstatus $175,000
-
1981-02-01soldstatus $466,000
ⓘ Source: listings_history table (triggers on properties + properties_extension) + one-shot
backfill from property_details.listing_events for pre-trigger history.
Tax reassessment forecast MN · Partial reset (capped growth)
- Current annual tax
- $9,926 · $827/mo
- Projected year-2 tax
- $13,335 · $1,111/mo
- Expected delta
- +$3,409/yr (+$284/mo · 34.3%)
ⓘ Screening estimate from a state-policy table — verify with the county assessor before closing.
Climate risk First Street
- Flood 1/10 Low 0% chance over 30 yrs
- Wildfire 1/10 Low
- Heat 2/10 Low 7 d/yr ≥99°F today · 15 d/yr by 30 yrs out
- Wind 2/10 Low
- Air quality 2/10 Low 1 unhealthy d/yr today · 1 by 30 yrs out
Nearby sold comps map
Loading sold comps map…
Walkable amenities ~0.75 mi
Loading nearby amenities…
Taxation est. · year 1
- Rental income
- $254,196
- − Mortgage interest
- −$83,743
- − Property taxes
- −$9,926
- − Insurance
- −$7,475
- − Repairs & maintenance
- −$20,336
- − Management
- −$20,336
- − Depreciation
- −$43,491
- Taxable income
- $68,889
- Est. tax owed @ 24.0%
- −$16,533
- After-tax cash flow
- $72,801/yr
For passive investors: Depreciation is non-cash, so a rental often shows a tax loss while cash-flowing — sheltering income. Rental losses are passive: they offset passive income freely, and up to $25,000/yr can offset ordinary (W-2) income if you actively participate and your MAGI is under $100k (phasing out to $0 by $150k); unused losses carry forward. On sale, claimed depreciation is recaptured at up to 25%, and gains may owe capital-gains tax (a 1031 exchange can defer both). Figures are a year-1 estimate at your 24.0% rate — not tax advice; consult a CPA.
Schools (NCES district)
- District
- Mankato Public School District
- NCES district ID
- 2718780
- Math proficiency
- 48% ▼ -11.00%
- Reading proficiency
- 56% ▼ -8.00%
- Median HH income
- $49,469
- Composite
- 44.36/100
- National rank
- #2819
- State rank
- #98 of 301 in MN
Livability — Mankato
- Score
- 77/100
- State rank
- #133
- US rank
- #2970
Category grades
Schools grade is shown separately in the Schools card above.
Census & demographics
- Census place
- Mankato, MN
- County
- Blue Earth County · 51,585 people
- City population
- 51,585
- Metro
- Mankato, MN
- Population (ZIP)
- 51,585
- Household income
- $69,531
- Rent vs Own
- Severe rent burden
- 2394.0
Population outlook (Blue Earth County) Hauer SSP2
- Today (2025)
- 70,208 people
- By 2030
- 72,708 · +3.6%
- By 2040
- 77,481 · +10.4%
- By 2050
- 82,842 · +18.0%
- By 2075
- 99,990 · +42.4%
- By 2100
- 116,795 · +66.4%
Race, ethnicity, and origin ACS 2023
- Neighborhood character
- Predominantly White (83%)
- Race & ethnicity
- White 83% Black 6% Hispanic / Latino 5% Two or more races 4% Asian 3%
- Common ancestry
- Portuguese 11% Lithuanian 3% Romanian 3%
- Foreign-born
- 8% · Canada, Vietnam, South Korea
- Languages at home
- 90% English-only · Spanish 3% Other Indo-European 1% Vietnamese 1%
Political lean MEDSL · Blue Earth
- 2024 margin
- Toss-up / Even · D 48.3% · R 49.5% · Other 2.1%
- 2008→2024 swing
- -14.2pp toward R · 2008: 12.9pp · 2024: -1.2pp
- All cycles
- 2024: R+1.2 2020: D+4.4 2016: R+3.7 2012: D+9.5 2008: D+12.9
Not yet ingested
- Civics
- —
Market trends
- HPI YoY
- ▼ -192.46%
- Current HPI
- 189.8485
- Rent YoY
- ▲ 8.55%
- Metro
- Mankato, MN
- State GDP YoY
- ▲ 2.41%
- F500 in state
- 34
Industry mix (Fortune 500 HQ in MN)
| Industry | F500 HQs | Revenue |
|---|---|---|
| Healthcare | 2 | $407B |
|
||
| Retail | 2 | $150B |
|
||
| Consumer Goods | 2 | $32B |
|
||
| Industrial Machinery | 2 | $6B |
|
||
| Agriculture | 1 | $40B |
|
||
| Healthcare / Medical Devices | 1 | $32B |
|
||
Price history
+220.8% since first listed10 events — show timeline
- 2026-03-30 Pending — RASM
- 2026-03-11 Listed $1,495,000 RASM
- 2023-12-14 Rental Removed $945 APPFOLIO
- 2023-10-20 Listed for Rent $945 APPFOLIO
- 2023-09-08 Rental Removed $945 APPFOLIO
- 2023-08-29 Listed for Rent $945 APPFOLIO
- 2013-09-20 Sold (Public Records) $466,000 Public Records
- 2013-09-20 Sold (Public Records) $400,000 Public Records
- 1991-04-10 Sold (Public Records) $175,000 Public Records
- 1981-02-01 Sold (Public Records) $466,000 Public Records
Property tax history
+4.7%/yrLatest (2025): $9,926 · -2.8% YoY. Source: county tax records.
Cash-flow waterfall
monthlySold comps — $/sqft
last 12 mo · ≤1 miLoading sold comps…