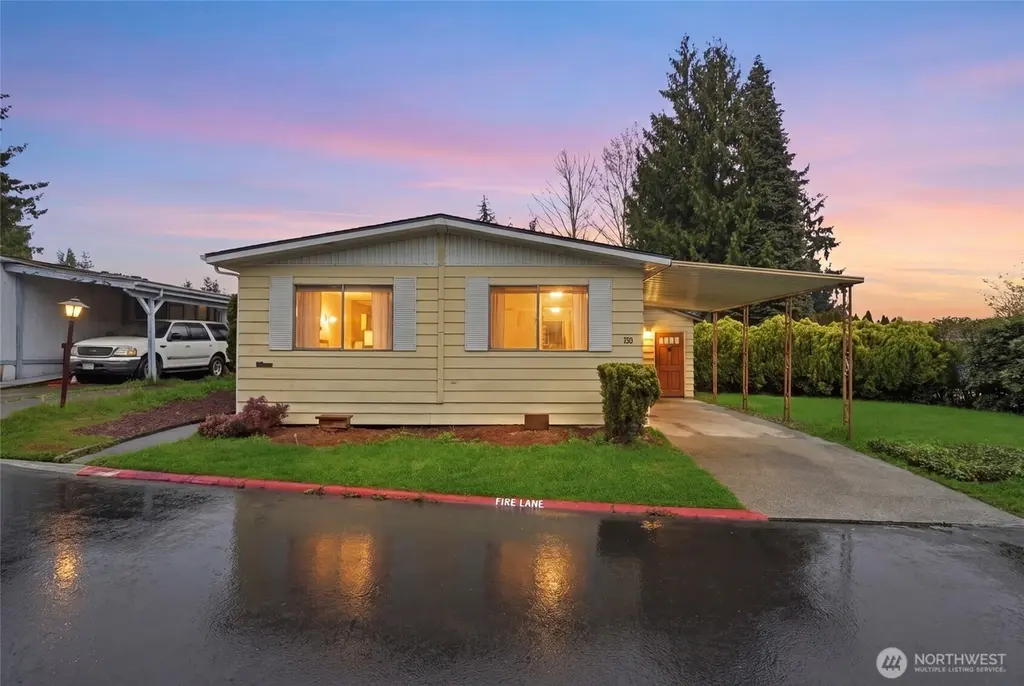
12605 E Gibson Rd #65 · Lake Stickney, WA
Flood risk No data
- FEMA flood zone
- —
- Chance of flooding over 30 yrs
- —
- Est. flood insurance / yr
- —
Fire risk No data
- Est. fire insurance / yr
- —
Heat risk No data
- Hot days now (above threshold)
- —
- Hot days in 30 yrs
- —
Wind risk No data
- Chance of severe wind over 30 yrs
- —
Air-quality risk No data
- Unhealthy air days now
- —
- Unhealthy air days in 30 yrs
- —
Risk factors via First Street. Map © Google.
Why this score? — see what drove the B- grade
The composite is a weighted blend of 9 inputs, each scored 0–100. Each bar is that input's sub-score; the figure is the points it added to the 100-point composite (weight × sub-score).
- Cash flow +30.0/30.0
- DSCR +10.0/10.0
- 1% rule +7.7/10.0
- ARV discount +7.4/15.0
- Schools +4.8/10.0
- Livability +3.7/5.0
- Condition / age +2.5/5.0
- Rent growth +2.1/5.0
- Appreciation +0.0/10.0
$149,500
🖨 Deal sheet (PDF) 📄 Offer letter ✓ Due diligence
Listing remarks
Enjoy affordable living in this well-positioned manufactured home located in a desirable gated, all-ages community. Situated on a corner lot, this home offers added privacy and a standout location. At the edge of the property is entry to a private grass field large enough for group gatherings. A great place to let your dog play or host events without the fear of car noise or traffic. Monthly Park rent is below $850 and includes access to the community clubhouse. The property also features 2 designated street parking spaces, a spacious carport, and a storage shed for added convenience and storage. Conveniently located near local Everett transportation options and Paine Field, this home offer
Key facts
- Gated community
- Community clubhouse
- Private grass field
Tags
Neighborhood map
What this means for you Summary
Snapshot
- This is a 2-bed/2.0-bath manufactured listed at $150k.
Deal economics
- At list price, monthly cash flow is $594 ($7k/yr) — positive.
- The deal already cash-flows at list — no discount required.
- Meets the 1% rule at list price ($2k rent vs $150k).
- Cap rate 11.1% vs local median 2.4% in Lake Stickney — top-decile yield for the area; either an underpriced asset or a hidden risk that comps aren't pricing in. Stress-test before assuming the spread holds.
Location & tenants
- Location reads 73/100 on livability (#192 in WA) — a middle-class / working-renter tenant base. Strengths: commute A+, employment A, health & safety A; Watch: schools D, amenities D-, cost of living F.
- Mukilteo School District (suburban): math 47% / reading 59% proficiency, ranked #111 of 291 in WA (top 38%) — acceptable for families but not a draw, mixed tenant base, ~2y average lease.
- Market conditions: Rents soft (-1.7%/yr); 167 active listings in the ZIP; 37 comparable units currently listed for rent nearby; rentals leasing fast (median 4d on market — plan ~1-2 weeks tenant-placement turnaround); 3,982 units permitted in Snohomish County in 2024 (1,492 in 5+ unit buildings).
- This rent runs 33% of the median local income ($69k/yr) — at the standard rent-burdened threshold; future hikes will face affordability resistance.
Forward outlook
- Local home prices are declining (-3.0%/yr); year-one equity from $1k of loan paydown is wiped out by about $4k of value loss. Plan a longer hold.
- Snohomish County population projected at +30% by 2050 — long-run rental-demand tailwind backs the buy-and-hold thesis.
- At projected returns (-3.0% appreciation + 0.0% rent growth), your $42k cash investment doubles in ~10 years — after that, you're playing with house money.
Negotiation context
- Only 3 days on market — expect competitive offers; lowballing is unlikely to land.
- 6 sale attempts since 22y ago with the ask held roughly flat each time — persistent listings suggest the price (not the market) is what's stuck; bring a comps-based counter.
- Current owner paid $44k; list at $150k implies a 236% gain — meaningful room to come down on a strong offer.
Questions for the listing agent
- Built in 1979 — when were the roof, HVAC, electrical panel, plumbing, and water heater last replaced?
- Is there a deadline driving the sale (1031 exchange, divorce, estate, relocation)? That informs how much negotiation room exists.
- Schools are D-rated, which usually means shorter tenancies and higher turnover. Who's the typical renter profile here, and what's been the actual vacancy rate?
- What's the average days-on-market for RENTAL listings here right now (not sales)? A rising rental-DOM trend means longer vacancies and softer asking-rent achievability than the comps imply.
- What's the recent tenant-quality profile in this submarket — average credit score on applications, eviction rate, late-payment / NSF rate, and stable-employment percentage? A property-management company in the area should have these aggregated.
- How much new for-sale + rental construction is in the pipeline within 1–3 miles? Heavy new supply typically softens prices + rents 12–24 months out; constrained supply supports both.
Investment metrics
- 1% rule
- 1.27% ✓
- Cap rate
- 11.06%
- Cash-on-cash
- 17.01%
- DSCR
- 1.76
- GRM
- 6.5
CMA / ARV
- ARV (on-the-fly)
- $149,136
- Comps found
- 2
Show comp detail 2 sales within ~0.75 mi
| Address | Dist | Beds/Ba | Sqft | Sold | Price | $/sf | Match |
|---|---|---|---|---|---|---|---|
| 12605 E Gibson Rd #65 | 0.00mi | 2/1.0 | 956 (0%) | 0mo | $149,500 | $156 | 96 |
| 13119 17th Ave W #1 | 0.52mi | 2/1.0 | 896 (-6%) | 10mo | $38,600 | $43 | 53 |
Match score weights: distance 35% · size 25% · config 20% · recency 20%. Top-matched comps best support the ARV.
Projected returns pro-forma
-3.0% appreciation · 0.0% rent growth · sell at horizon
- IRR
- 5.1%
- Equity multiple
- 1.19×
- Total profit
- $7,951
- Equity at exit
- $22,291
- IRR
- 11.8%
- Equity multiple
- 1.81×
- Total profit
- $33,850
- Equity at exit
- $12,926
Cash invested: $41,860 (down + closing). Projections, not guarantees.
Landlord ↔ Tenant lean methodology
- Overall (STATE)
- 28 Tenant-Leaning
- State Washington
- 28 Tenant-Leaning · D+8
- County
- — inherits STATE
- City
- — inherits STATE
ZIP-level market 98204
- Rents YoY
- -1.7%
- Active inventory
- 167
- Price-to-rent
- 6.5×
Monthly cashflow live
- Estimated rent
- $1,904 high interval (Pro) →
- Mortgage (P&I)
- −$784
- Tax from tax record
- −$64 /mo · $768/yr
- Insurance
- −$62
- HOA
- −$0
- Vacancy / Maint / Mgmt
- −$400
- Net cashflow
- $594
Break-even live
Sensitivity live
| Price | -10% $678 | -5% $636 | +0% $594 | +5% $551 | +10% $509 |
|---|---|---|---|---|---|
| Rent | -10% $443 | -5% $518 | +0% $594 | +5% $669 | +10% $744 |
| Rate | -1.0pp $669 | -0.5pp $632 | base $594 | +0.5pp $555 | +1.0pp $515 |
UW: 25.0% down · 7.5% · 30yr · 1.5% tax · 5.0% vac · 8.0% maint · 8.0% mgmt
Financing live
Cash to close
- Down payment
- $37,375
- Closing costs
- $4,485
- Reserves months
- —
- Total cash needed
- —
Loan-product check · same deal, 3 products live
Conventional
25% down · 7.5% · 30yr
- Down + closing
- —
- Monthly P&I
- —
- Monthly cashflow
- —
- DSCR
- —
- Eligible?
- —
Personal DTI + credit; lowest rate.
DSCR
20% down · 8.5% · 30yr
- Down + closing
- —
- Monthly P&I
- —
- Monthly cashflow
- —
- DSCR
- —
- Eligible?
- —
No personal income docs; deal must DSCR.
Hard money
10% down · 12.0% · 12mo
- Down + closing
- —
- Monthly P&I
- —
- Monthly cashflow
- —
- DSCR
- —
- Eligible?
- —
Short-term bridge; refi at stabilization.
Rent comps 37 comps
| Address | Beds | Baths | Sqft | Rent | $/sqft | DOM | Units | Dist |
|---|---|---|---|---|---|---|---|---|
| 12522 8th Ave W Everett, WA | 1.0–3.0 | 1.0–2.0 | 1005 | $2,146 | $2.13 | 5d | 8 | 0.09mi |
| 921 130th St SW Unit A101 Everett, WA | 2.0 | 2.0 | 844 | $1,700 | $2.01 | 5d | 1 | 0.15mi |
| 1007 130th St SW Everett, WA | 1.0–2.0 | 1.0–2.0 | 796 | $1,800 | $2.26 | 2d | 9 | 0.15mi |
| 820 124th St SW Apt D Everett, WA | 2.0 | 1.5 | 960 | $1,595 | $1.66 | 5d | 1 | 0.16mi |
| 12906 8th Ave W Everett, WA | 2.0 | 2.0 | 841 | $1,675 | $1.99 | 5d | 1 | 0.18mi |
| 12601 8th Ave W Everett, WA | 2.0 | 1.0 | 637 | $1,839 | $2.88 | 5d | 15 | 0.21mi |
| 12907 E Gibson Rd Everett, WA | 1.0–2.0 | 1.0–2.0 | 859 | $2,085 | $2.43 | 5d | 4 | 0.21mi |
| 12907 E Gibson Rd Everett, WA | 1.0–2.0 | 1.0–2.0 | 775 | $2,081 | $2.69 | 2d | 5 | 0.21mi |
| 12433 Admiralty Way Everett, WA | 1.0–3.0 | 1.0–2.0 | 1073 | $2,274 | $2.12 | 3d | 32 | 0.25mi |
| 909 132nd St SW Everett, WA | 1.0 | 1.0 | 520 | $1,495 | $2.88 | 2d | 2 | 0.30mi |
| 12402 Admiralty Way Everett, WA | 1.0–3.0 | 1.0–2.0 | 842 | $1,922 | $2.28 | 2d | 16 | 0.39mi |
| 12121 Admiralty Way Everett, WA | 1.0–3.0 | 1.0–2.0 | 1116 | $2,245 | $2.01 | 3d | 18 | 0.43mi |
| 12530 Admiralty Way Unit D304 Everett, WA | 2.0 | 2.0 | 1050 | $2,400 | $2.29 | 5d | 1 | 0.47mi |
| 11812 E Gibson Rd Everett, WA | 2.0 | 2.0 | 956 | $1,810 | $1.89 | 3d | 7 | 0.54mi |
| 13000 Admiralty Way Unit K103 Everett, WA | 1.0 | 1.0 | 609 | $1,700 | $2.79 | 44d | 1 | 0.60mi |
| 13004 Meridian Ave S Everett, WA | 1.0–3.0 | 1.0–2.0 | 1025 | $1,961 | $1.91 | 2d | 1 | 0.60mi |
| 12121 Highway 99 Everett, WA | 1.0–2.0 | 1.0 | 638 | $1,637 | $2.56 | 5d | 14 | 0.63mi |
| 11527 Highway 99 Unit E302 Everett, WA | 1.0 | 1.0 | 667 | $1,700 | $2.55 | 5d | 1 | 0.76mi |
| 128 127th St SE Everett, WA | 3.0 | 1.0–2.0 | 884 | $2,747 | $3.11 | 2d | 10 | 0.78mi |
| 12118 Highway 99 Everett, WA | 1.0–5.0 | 1.0–3.0 | 1117 | $1,941 | $1.74 | 2d | 5 | 0.82mi |
| 133 124th St SE Everett, WA | 1.0–2.0 | 1.0–2.0 | 820 | $2,055 | $2.50 | 2d | 9 | 0.83mi |
| 1020 112th St SW Everett, WA | 1.0–2.0 | 1.0–2.0 | 853 | $1,752 | $2.05 | 2d | 7 | 0.84mi |
| 11207 9th Pl W Everett, WA | 2.0 | 1.0 | 995 | $1,899 | $1.91 | 20d | 7 | 0.91mi |
| 923 112th St SW Everett, WA | 1.0–3.0 | 1.0–2.0 | 858 | $1,950 | $2.27 | 2d | 24 | 0.96mi |
| 11715 Center Rd Unit A Everett, WA | 2.0 | 1.0 | 750 | $1,700 | $2.27 | 44d | 1 | 0.96mi |
| 1730 112th St SW Everett, WA | 1.0–2.0 | 1.0–2.0 | 805 | $2,100 | $2.61 | 2d | 6 | 0.98mi |
| 14402 Madison Way Lynnwood, WA | 1.0 | 1.0 | 800 | $2,500 | $3.12 | 44d | 1 | 1.09mi |
| 11401 3rd Ave SE Everett, WA | 2.0 | 1.0–2.0 | 862 | $1,962 | $2.28 | 2d | 13 | 1.23mi |
| 10720 Washington Way Everett, WA | 2.0 | 1.0 | 700 | $2,200 | $3.14 | 2d | 1 | 1.23mi |
| 2709 Lincoln Way Lynnwood, WA | 2.0–3.0 | 2.0 | 1120 | $2,256 | $2.01 | 2d | 4 | 1.28mi |
| 13510 N Creek Dr Mill Creek, WA | 1.0–4.0 | 1.0–2.0 | 1020 | $1,642 | $1.61 | 4d | 1 | 1.34mi |
| 12909 Mukilteo Speedway Lynnwood, WA | 3.0–4.0 | 2.0 | 1199 | $1,993 | $1.66 | 5d | 8 | 1.40mi |
| 515 112th St SE Everett, WA | 2.0–3.0 | 2.0–2.5 | 1050 | $1,726 | $1.64 | 3d | 3 | 1.40mi |
| 13401 Dumas Rd Mill Creek, WA | 1.0–2.0 | 1.0–2.0 | 872 | $2,237 | $2.56 | 2d | 5 | 1.41mi |
| 525 112th St SE Everett, WA | 1.0–2.0 | 1.0–2.0 | 1019 | $2,416 | $2.37 | 2d | 6 | 1.42mi |
| 14131 Admiralty Way Unit B Lynnwood, WA | 2.0 | 1.5 | 1000 | $2,245 | $2.25 | 24d | 1 | 1.44mi |
| 14014 Admiralty Way Lynnwood, WA | 1.0–2.0 | 1.0–2.0 | 768 | $1,975 | $2.57 | 5d | 6 | 1.44mi |
Listing history 13 events
-
2026-04-19status Pending
-
2026-04-16$149,500 Active
-
2018-07-06soldstatus $44,500 Sold
-
2018-06-15status Pending Inspection
-
2018-06-04status Active
-
2018-05-25status Pending
-
2018-04-26status Active
-
2018-04-20status Pending Inspection
-
2018-04-16status Active
-
2018-04-03status Pending Inspection
-
2018-03-22$47,500 Active
-
2004-10-27soldstatus $16,000
-
2004-09-08$16,919
ⓘ Source: listings_history table (triggers on properties + properties_extension) + one-shot
backfill from property_details.listing_events for pre-trigger history.
Tax reassessment forecast WA · Resets to sale price
- Current annual tax
- $768 · $64/mo
- Projected year-2 tax
- $1,465 · $122/mo
- Expected delta
- +$697/yr (+$58/mo · 90.7%)
ⓘ Screening estimate from a state-policy table — verify with the county assessor before closing.
Nearby sold comps map
Loading sold comps map…
Walkable amenities ~0.75 mi
Loading nearby amenities…
Taxation est. · year 1
- Rental income
- $22,843
- − Mortgage interest
- −$8,374
- − Property taxes
- −$768
- − Insurance
- −$748
- − Repairs & maintenance
- −$1,827
- − Management
- −$1,827
- − Depreciation
- −$4,349
- Taxable income
- $4,949
- Est. tax owed @ 24.0%
- −$1,188
- After-tax cash flow
- $5,935/yr
For passive investors: Depreciation is non-cash, so a rental often shows a tax loss while cash-flowing — sheltering income. Rental losses are passive: they offset passive income freely, and up to $25,000/yr can offset ordinary (W-2) income if you actively participate and your MAGI is under $100k (phasing out to $0 by $150k); unused losses carry forward. On sale, claimed depreciation is recaptured at up to 25%, and gains may owe capital-gains tax (a 1031 exchange can defer both). Figures are a year-1 estimate at your 24.0% rate — not tax advice; consult a CPA.
Schools (NCES district)
- District
- Mukilteo School District
- NCES district ID
- 5305430
- Math proficiency
- 47% ▼ -2.00%
- Reading proficiency
- 59% ▬ 0.00%
- Median HH income
- $60,807
- Composite
- 48.17/100
- National rank
- #4733
- State rank
- #111 of 291 in WA
Livability — Lake Stickney
- Score
- 73/100
- State rank
- #192
- US rank
- #5224
Category grades
Schools grade is shown separately in the Schools card above.
Census & demographics
- County
- Snohomish County · 786,756 people
- Metro
- Seattle-Tacoma-Bellevue, WA
- Population (ZIP)
- 45,130
- Household income
- $68,513
- Rent vs Own
- Severe rent burden
- 2874.0
Population outlook (Snohomish County) Hauer SSP2
- Today (2025)
- 899,800 people
- By 2030
- 960,975 · +6.8%
- By 2040
- 1,074,447 · +19.4%
- By 2050
- 1,171,954 · +30.2%
- By 2075
- 1,384,849 · +53.9%
- By 2100
- 1,497,296 · +66.4%
Race, ethnicity, and origin ACS 2023
- Neighborhood character
- Highly diverse neighborhood (Simpson 0.71)
- Race & ethnicity
- White 46% Hispanic / Latino 22% Asian 14% Two or more races 11% Black 9% Pacific Islander 2%
- Hispanic origin (detail)
- Mexican 17%
- Common ancestry
- Subsaharan African 4% Italian 2% Portuguese 2%
- Foreign-born
- 31% · Canada, Vietnam, South Korea
- Languages at home
- 58% English-only · Spanish 18% Russian/Polish/Slavic 6% Vietnamese 5%
Political lean MEDSL · Snohomish
- 2024 margin
- D (+19.0) · D 57.8% · R 38.9% · Other 3.3%
- 2008→2024 swing
- +0.1pp no change · 2008: 18.9pp · 2024: 19.0pp
- All cycles
- 2024: D+19.0 2020: D+20.6 2016: D+16.6 2012: D+16.2 2008: D+18.9
Not yet ingested
- Civics
- —
Market trends
- HPI YoY
- ▼ -540.03%
- Current HPI
- 321.7923
- Rent YoY
- ▼ -1.70%
- Metro
- Seattle-Tacoma-Bellevue, WA
- State GDP YoY
- ▲ 4.65%
- F500 in state
- 22
Industry mix (Fortune 500 HQ in WA)
| Industry | F500 HQs | Revenue |
|---|---|---|
| Retail | 2 | $269B |
|
||
| Technology / Retail | 1 | $638B |
|
||
| Technology | 1 | $245B |
|
||
| Telecommunications | 1 | $38B |
|
||
| Food / Beverage | 1 | $36B |
|
||
| Automotive / Trucks | 1 | $34B |
|
||
Price history
+783.6% since first listed13 events — show timeline
- 2026-04-19 Pending — NWMLS as Distributed by MLS Grid
- 2026-04-16 Listed $149,500 NWMLS as Distributed by MLS Grid
- 2018-07-06 Sold (MLS) $44,500 NWMLS as Distributed by MLS Grid
- 2018-06-15 Pending — NWMLS as Distributed by MLS Grid
- 2018-06-04 Relisted — NWMLS as Distributed by MLS Grid
- 2018-05-25 Pending — NWMLS as Distributed by MLS Grid
- 2018-04-26 Relisted — NWMLS as Distributed by MLS Grid
- 2018-04-20 Pending — NWMLS as Distributed by MLS Grid
- 2018-04-16 Relisted — NWMLS as Distributed by MLS Grid
- 2018-04-03 Pending — NWMLS as Distributed by MLS Grid
- 2018-03-22 Listed $47,500 NWMLS as Distributed by MLS Grid
- 2004-10-27 Sold (MLS) $16,000 NWMLS as Distributed by MLS Grid
- 2004-09-08 Listed $16,919 NWMLS as Distributed by MLS Grid
Property tax history
+8.2%/yrLatest (2026): $768 · +5.0% YoY. Source: county tax records.
Cash-flow waterfall
monthlySold comps — $/sqft
last 12 mo · ≤1 miLoading sold comps…