 🌊 Lakefront
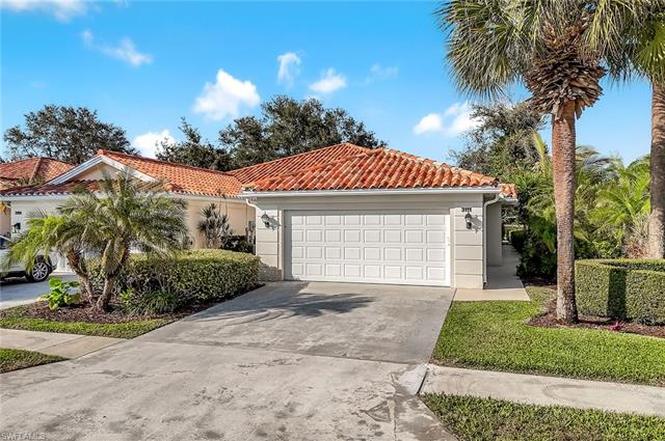
3111 Andorra Ct · Vineyards, FL
Flood risk 1/10 · Minimal
- FEMA flood zone
- X (unshaded)
- Chance of flooding over 30 yrs
- 0.0%
- Est. flood insurance / yr
- $507 – $1,088
Fire risk 1/10 · Minimal
- Est. fire insurance / yr
- $947 – $1,759
Heat risk 10/10 · Severe
- Hot days now (above 107°F)
- 7 days/yr
- Hot days in 30 yrs
- 29 days/yr
Wind risk 10/10 · Severe
- Chance of severe wind over 30 yrs
- 99.0%
Air-quality risk 2/10 · Minimal
- Unhealthy air days now
- 2 days/yr
- Unhealthy air days in 30 yrs
- 2 days/yr
Risk factors via First Street. Map © Google.
Why this score? — see what drove the C- grade
The composite is a weighted blend of 9 inputs, each scored 0–100. Each bar is that input's sub-score; the figure is the points it added to the 100-point composite (weight × sub-score).
- Cash flow +15.4/30.0
- ARV discount +7.5/15.0
- 1% rule +5.7/10.0
- Appreciation +5.1/10.0
- Schools +5.0/10.0
- DSCR +4.7/10.0
- Livability +3.2/5.0
- Rent growth +2.7/5.0
- Condition / age +2.5/5.0
$359,000
🖨 Deal sheet (PDF) 📄 Offer letter ✓ Due diligence
Listing remarks
Investor alert! Exceptional value in the sought-after gated community of Village Walk. This 2-bedroom, 2-bath Capri model offers solid poured concrete, and attached 2-car garage, and a highly functional split-bedrooms floor plan ready for your vision. Interior features include tile flooring throughout the main living areas, wood flooring in both bedrooms, and a screened lanai with garden and lake views. With strong structural integrity and desirable layout, this property presents and ideal opportunity for cosmetic updates or full transformation to unlock its full potential. Village Walk’s central North Naples location near beaches, shopping and dining, supports long-term value and ren
Key facts
- Gated community
- Wood flooring
- Screened lanai
Tags
Property features AI
Finance
- Other: Property is part of a large community of approximately 850 units; 1 unit per floor and 2 units in the building; Zero-acre lot with total area 2,122 (developer brochure source); Restrictions: Architectural and deeded
- HOA & community: Mandatory HOA; Master HOA fee $1,661 quarterly (total annual recurring fees $6,644); One-time fees $1,836; Professional management; HOA maintenance covers cable, internet/WiFi, lawn/land maintenance, manager, recreation facilities, and street maintenance; Community amenities include community pool, exercise room, tennis, pickleball, bocce, community room, library, restaurant, beauty salon, sidewalks and streetlights
Exterior
- Parking: Attached 2-car garage; Paved driveway
- Security: Gated community with guard at gate
- Utilities: Central water; Central sewer; Cable available; Electric service for heat and cooling
- Home design: Residential villa (attached); Duplex building; One story; Built in 1995; Rear exposure faces north; Located in Village Walk (gated community)
- Construction: Poured concrete construction; Stucco exterior; Tile roof; Sliding windows; Manual storm shutters
- Exterior features: Decorative shutters; Patio; Screened lanai/porch; Lake view and lake/ canal irrigation; Zero lot line
Interior
- Kitchen: Dishwasher; Disposal; Microwave; Range; Refrigerator/freezer; Self-cleaning oven
- Bedrooms: 2 bedrooms plus a den; Split bedroom floor plan
- Flooring: Tile; Wood
- Bathrooms: 2 full bathrooms; Master bath with dual sinks and shower (no tub)
- Heating & cooling: Central electric heat; Central electric cooling
- Interior features: High-speed internet available; Laundry tub; Pull-down attic stairs; Smoke detectors; Walk-in closet; Breakfast bar and dining in living area; Den/study; Great room; Laundry in residence; Screened lanai/porch; Unfurnished
- Laundry & utility: Washer included; Central vacuum
Neighborhood map
What this means for you Summary
Snapshot
- This is a 2-bed/2.0-bath single-family listed at $359k.
Deal economics
- At list price, monthly cash flow is $136 ($2k/yr) — positive.
- The deal already cash-flows at list — no discount required.
- Meets the 1% rule at list price ($4k rent vs $359k).
- Recommended offer: $337k (6.0% below list) — sets the bar for market timing.
Location & tenants
- Location reads 64/100 on livability (#679 in FL) — a middle-class / working-renter tenant base. Strengths: crime A+, employment A+, housing A-; Watch: health & safety D, amenities F, commute F.
- Collier (suburban): math 60% / reading 56% proficiency, ranked #16 of 73 in FL (top 22%) — acceptable for families but not a draw, mixed tenant base, ~2y average lease.
- Zoned schools: Vineyards Elementary School (math 79% / reading 75%, grade A, #170 of 2,144 statewide, top 9%, 845 students, 27% FRL) — zoned schools average 27% FRL vs 55% district-wide (28 pts lower); this property's tenant base skews higher-income than the district average.
- Zoned-school proficiency averages 77% at this address vs 58% district-wide (+19 pts) — the actual schools serving this property are materially stronger than the Collier average implies; a family-tenant draw the district grade alone would hide.
- Market conditions: Rents flat; 424 active listings in the ZIP; 40 comparable units currently listed for rent nearby; rentals at typical pace (median 24d on market — plan ~3-4 weeks tenant-placement turnaround); solid renter incomes; 3,520 units permitted in Collier County in 2024 (959 in 5+ unit buildings).
- At $3,842/mo this rent would consume 50% of the median local household income ($92k/yr) (locally 1712% of renters already pay >50% of income on rent) — very limited rent-growth headroom before tenants either downsize or default.
Forward outlook
- In year one you build about $4k of equity ($2k loan paydown + $1k appreciation (0.3% local appreciation)).
- Collier County population projected at +30% by 2050 — long-run rental-demand tailwind backs the buy-and-hold thesis.
- By year 8, paydown + projected appreciation supports a ~$33k cash-out refi (75% LTV) — recoverable capital for the next deal without selling this one.
Negotiation context
- It's been on market 61 days — a 6% lower offer ($337k) is reasonable based on typical stale-listing flexibility.
- 3 sale attempts; this cycle's ask has dropped $50k (12%) from the opening price — seller is motivated, your offer sets the floor, not the list.
Risks & watch-outs
- Climate carrying-cost: severe wind risk, 99% chance of damaging wind over 30y; extreme-heat days projected 7→29/yr by 2055 (HVAC capex compounding) — expect insurance premiums to compound above CPI over the hold.
Questions for the listing agent
- It's been on market 61 days. Have you received any prior offers? Is the seller open to a 6% concession, seller financing, or rate buy-down credit?
- What does the HOA fee cover, when was the last increase, and are there any pending special assessments or reserve-fund shortfalls?
- Why hasn't it sold? Are there any deal-killer items the seller is aware of (foundation, flood, title, zoning, code violations)?
- Is there a deadline driving the sale (1031 exchange, divorce, estate, relocation)? That informs how much negotiation room exists.
- This sits on a lake — are riparian / water-frontage rights deeded with the parcel? Any dock permits, shoreline easements, or HOA water-use restrictions?
- What's the documented flood / surge / shoreline-erosion history here (FEMA AND non-FEMA — e.g., storm surge, creek backup, septic-field saturation)?
- Any water-quality or seasonal algae-bloom issues that affect tenant satisfaction or short-term-rental demand?
- What's the average days-on-market for RENTAL listings here right now (not sales)? A rising rental-DOM trend means longer vacancies and softer asking-rent achievability than the comps imply.
- What's the recent tenant-quality profile in this submarket — average credit score on applications, eviction rate, late-payment / NSF rate, and stable-employment percentage? A property-management company in the area should have these aggregated.
- How much new for-sale + rental construction is in the pipeline within 1–3 miles? Heavy new supply typically softens prices + rents 12–24 months out; constrained supply supports both.
Investment metrics
- 1% rule
- 1.07% ✓
- Cap rate
- 6.75%
- Cash-on-cash
- 1.62%
- DSCR
- 1.07
- GRM
- 7.8
CMA / ARV
No comps found within radius.
Projected returns pro-forma
0.29% appreciation · 0.92% rent growth · sell at horizon
- IRR
- -0.9%
- Equity multiple
- 0.96×
- Total profit
- $-4,389
- Equity at exit
- $109,567
- IRR
- 2.9%
- Equity multiple
- 1.30×
- Total profit
- $30,443
- Equity at exit
- $136,033
Cash invested: $100,520 (down + closing). Projections, not guarantees.
Landlord ↔ Tenant lean methodology
- Overall (STATE)
- 87 Strongly Landlord-Friendly
- State Florida
- 87 Strongly Landlord-Friendly · R+3
- County
- — inherits STATE
- City
- — inherits STATE
ZIP-level market 34109
- Home prices YoY
- 0.1%
- Rents YoY
- 0.9%
- Active inventory
- 424
- Price-to-rent
- 7.8×
Monthly cashflow live
- Estimated rent
- $3,842 high interval (Pro) →
- Mortgage (P&I)
- −$1,883
- Tax from tax record
- −$313 /mo · $3,751/yr
- Insurance
- −$150
- HOA
- −$554
- Vacancy / Maint / Mgmt
- −$807
- Net cashflow
- $136
Break-even live
Sensitivity live
| Price | -10% $339 | -5% $238 | +0% $136 | +5% $35 | +10% $-67 |
|---|---|---|---|---|---|
| Rent | -10% $-167 | -5% $-16 | +0% $136 | +5% $288 | +10% $440 |
| Rate | -1.0pp $317 | -0.5pp $227 | base $136 | +0.5pp $43 | +1.0pp $-52 |
UW: 25.0% down · 7.5% · 30yr · 1.5% tax · 5.0% vac · 8.0% maint · 8.0% mgmt
Financing live
Cash to close
- Down payment
- $89,750
- Closing costs
- $10,770
- Reserves months
- —
- Total cash needed
- —
Loan-product check · same deal, 3 products live
Conventional
25% down · 7.5% · 30yr
- Down + closing
- —
- Monthly P&I
- —
- Monthly cashflow
- —
- DSCR
- —
- Eligible?
- —
Personal DTI + credit; lowest rate.
DSCR
20% down · 8.5% · 30yr
- Down + closing
- —
- Monthly P&I
- —
- Monthly cashflow
- —
- DSCR
- —
- Eligible?
- —
No personal income docs; deal must DSCR.
Hard money
10% down · 12.0% · 12mo
- Down + closing
- —
- Monthly P&I
- —
- Monthly cashflow
- —
- DSCR
- —
- Eligible?
- —
Short-term bridge; refi at stabilization.
Rent comps 40 comps
| Address | Beds | Baths | Sqft | Rent | $/sqft | DOM | Units | Dist |
|---|---|---|---|---|---|---|---|---|
| 3511 Vanderbilt Beach Rd Naples, FL | 1.0–2.0 | 1.0–2.0 | 968 | $2,976 | $3.07 | 14d | 12 | 0.15mi |
| 3320 Bermuda Isle Cir Naples, FL | 1.0–3.0 | 1.0–2.0 | 1134 | $2,390 | $2.11 | 14d | 45 | 0.15mi |
| 3745 Fieldstone Blvd Unit 107 Naples, FL | 2.0 | 2.0 | 1310 | $3,800 | $2.90 | 14d | 1 | 0.22mi |
| 3740 Fieldstone Blvd Unit 104 Naples, FL | 3.0 | 2.0 | 1456 | $2,300 | $1.58 | 14d | 1 | 0.23mi |
| 3775 Fieldstone Blvd Unit 102 Naples, FL | 2.0 | 2.0 | 1281 | $4,700 | $3.67 | 14d | 1 | 0.27mi |
| 3780 Fieldstone Blvd #301 Naples, FL | 3.0 | 2.0 | 1500 | $2,800 | $1.87 | 14d | 1 | 0.28mi |
| 2729 Branch Ln Naples, FL | 3.0 | 2.0 | 1800 | $3,650 | $2.03 | 24d | 1 | 0.38mi |
| 7828 Gardner Dr Unit 5-202 Naples, FL | 3.0 | 2.0 | 1960 | $5,750 | $2.93 | 24d | 1 | 0.44mi |
| 7822 Gardner Dr Unit 6-101 Naples, FL | 2.0 | 2.0 | 1607 | $2,500 | $1.56 | 24d | 1 | 0.45mi |
| 7720 Gardner Dr #201 Naples, FL | 3.0 | 3.0 | 1960 | $5,500 | $2.81 | 24d | 1 | 0.51mi |
| 3664 El Segundo Ct Naples, FL | 2.0 | 2.0 | 1680 | $5,500 | $3.27 | 24d | 1 | 0.52mi |
| 3687 El Segundo Ct Naples, FL | 2.0 | 2.0 | 1680 | $5,000 | $2.98 | 24d | 1 | 0.54mi |
| 3296 Twilight Ln #6202 Naples, FL | 3.0 | 2.5 | 2133 | $6,500 | $3.05 | 14d | 1 | 0.60mi |
| 3049 Driftwood Way #3806 Naples, FL | 3.0 | 2.5 | 1818 | $4,700 | $2.59 | 24d | 1 | 0.66mi |
| 7762 Gardner Dr #102 Naples, FL | 2.0 | 2.0 | 1607 | $6,000 | $3.73 | 24d | 1 | 0.66mi |
| 3037 Driftwood Way #3505 Naples, FL | 2.0 | 2.0 | 1248 | $2,500 | $2.00 | 24d | 1 | 0.66mi |
| 3062 Driftwood Way #4301 Naples, FL | 3.0 | 2.0 | 1573 | $6,500 | $4.13 | 24d | 1 | 0.68mi |
| 3057 Driftwood Way #4004 Naples, FL | 3.0 | 2.5 | 1818 | $6,400 | $3.52 | 24d | 1 | 0.69mi |
| 4681 Rio Poco Ct Naples, FL | 3.0 | 2.0 | 1547 | $3,000 | $1.94 | 24d | 1 | 0.70mi |
| 3029 Driftwood Way #3303 Naples, FL | 2.0 | 2.0 | 1248 | $4,000 | $3.21 | 24d | 1 | 0.71mi |
| 3025 Driftwood Way #3203 Naples, FL | 2.0 | 2.0 | 1248 | $3,900 | $3.12 | 24d | 1 | 0.72mi |
| 3017 Driftwood Way #3001 Naples, FL | 3.0 | 2.0 | 1385 | $5,000 | $3.61 | 24d | 1 | 0.73mi |
| 3009 Driftwood Way #2802 Naples, FL | 3.0 | 2.0 | 1399 | $2,000 | $1.43 | 24d | 1 | 0.74mi |
| 2585 Old Groves Rd Unit L203 Naples, FL | 2.0 | 2.0 | 1448 | $5,500 | $3.80 | 14d | 1 | 0.77mi |
| 3015 Horizon Ln #2702 Naples, FL | 3.0 | 2.0 | 1399 | $1,790 | $1.28 | 24d | 1 | 0.80mi |
| 2516 Orchid Bay Dr #203 Naples, FL | 2.0 | 2.0 | 1360 | $4,750 | $3.49 | 24d | 1 | 0.83mi |
| 2864 Mizzen Way Unit Y106 Naples, FL | 2.0 | 2.0 | 1350 | $5,200 | $3.85 | 14d | 1 | 0.84mi |
| 2885 Citrus Lake Dr Unit N103 Naples, FL | 2.0 | 2.0 | 1249 | $5,250 | $4.20 | 14d | 1 | 0.84mi |
| 7518 Silver Trumpet Ln Unit Q102 Naples, FL | 2.0 | 2.0 | 1300 | $2,600 | $2.00 | 14d | 1 | 0.85mi |
| 3051 Horizon Ln #1803 Naples, FL | 2.0 | 2.0 | 1482 | $5,100 | $3.44 | 24d | 1 | 0.85mi |
| 3048 Horizon Ln #1104 Naples, FL | 3.0 | 2.5 | 1818 | $5,150 | $2.83 | 24d | 1 | 0.86mi |
| 2476 Orchid Bay Dr Unit W201 Naples, FL | 3.0 | 2.0 | 1928 | $2,600 | $1.35 | 14d | 1 | 0.88mi |
| 2880 Citrus Lake Dr Unit Q201 Naples, FL | 3.0 | 2.0 | 1590 | $2,495 | $1.57 | 14d | 1 | 0.90mi |
| 2835 Mizzen Way Naples, FL | 3.0 | 2.0 | 1641 | $2,900 | $1.77 | 24d | 1 | 0.90mi |
| 3035 Horizon Ln #2206 Naples, FL | 2.0 | 2.0 | 1246 | $6,000 | $4.82 | 24d | 1 | 0.91mi |
| 2730 Sailors Way Naples, FL | 3.0 | 3.0 | 1700 | $9,000 | $5.29 | 24d | 1 | 0.91mi |
| 2860 Citrus Lake Dr Unit R-202 Naples, FL | 3.0 | 2.0 | 1590 | $5,000 | $3.14 | 14d | 1 | 0.92mi |
| 2860 Citrus Lake Dr Unit R202 Naples, FL | 3.0 | 2.0 | 1590 | $5,000 | $3.14 | 24d | 1 | 0.92mi |
| 2809 Tiburon Blvd E Unit 2 Naples, FL | 3.0 | 2.0 | 2159 | $18,000 | $8.34 | 14d | 1 | 0.92mi |
| 2748 Tiburon Blvd E Unit C202 Naples, FL | 2.0 | 2.5 | 1865 | $15,000 | $8.04 | 14d | 1 | 0.93mi |
HOA detail
- Monthly dues
- $554 · $6,648/yr
- Likely covers
- security
Listing history 11 events
-
2026-05-07status Pending
-
2026-04-29price $359,000
-
2026-04-27status Active
-
2026-04-17status Pending With Contingencies
-
2026-04-08price $375,000
-
2026-03-30price $399,000
-
2026-03-03status Active
-
2026-02-19status Pending With Contingencies
-
2026-02-13$409,000 Active
-
2005-05-12soldstatus $349,000
-
2004-08-02soldstatus $245,000
ⓘ Source: listings_history table (triggers on properties + properties_extension) + one-shot
backfill from property_details.listing_events for pre-trigger history.
Tax reassessment forecast FL · Resets to sale price
- Current annual tax
- $3,751 · $313/mo
- Projected year-2 tax
- $3,751 · $313/mo
- Expected delta
- $0/yr ($0/mo · -0.0%)
ⓘ Screening estimate from a state-policy table — verify with the county assessor before closing.
Climate risk First Street
- Flood 1/10 Low FEMA zone X (unshaded) · 0% chance over 30 yrs
- Wildfire 1/10 Low
- Heat 10/10 Extreme 7 d/yr ≥107°F today · 29 d/yr by 30 yrs out
- Wind 10/10 Extreme 99% chance of damaging wind over 30 yrs
- Air quality 2/10 Low 2 unhealthy d/yr today · 2 by 30 yrs out
Nearby sold comps map
Loading sold comps map…
Walkable amenities ~0.75 mi
Loading nearby amenities…
Taxation est. · year 1
- Rental income
- $46,100
- − Mortgage interest
- −$20,110
- − Property taxes
- −$3,751
- − Insurance
- −$1,795
- − Repairs & maintenance
- −$3,688
- − Management
- −$3,688
- − HOA
- −$6,648
- − Depreciation
- −$10,444
- Taxable loss
- −$4,023
- Est. tax savings @ 24.0%
- +$966
- After-tax cash flow
- $2,599/yr
For passive investors: Depreciation is non-cash, so a rental often shows a tax loss while cash-flowing — sheltering income. Rental losses are passive: they offset passive income freely, and up to $25,000/yr can offset ordinary (W-2) income if you actively participate and your MAGI is under $100k (phasing out to $0 by $150k); unused losses carry forward. On sale, claimed depreciation is recaptured at up to 25%, and gains may owe capital-gains tax (a 1031 exchange can defer both). Figures are a year-1 estimate at your 24.0% rate — not tax advice; consult a CPA.
Schools (NCES district)
- District
- Collier
- NCES district ID
- 1200330
- Math proficiency
- 60% ▼ -4.00%
- Reading proficiency
- 56% ▼ -2.00%
- Median HH income
- $58,275
- Composite
- 50.23/100
- National rank
- #1892
- State rank
- #16 of 73 in FL
Livability — Vineyards
- Score
- 64/100
- State rank
- #679
- US rank
- #14101
Category grades
Schools grade is shown separately in the Schools card above.
Census & demographics
- County
- Collier County · 396,295 people
- Metro
- Naples-Marco Island, FL
- Population (ZIP)
- 27,273
- Household income
- $92,259
- Rent vs Own
- Severe rent burden
- 1712.0
Population outlook (Collier County) Hauer SSP2
- Today (2025)
- 420,858 people
- By 2030
- 450,054 · +6.9%
- By 2040
- 502,232 · +19.3%
- By 2050
- 544,932 · +29.5%
- By 2075
- 627,203 · +49.0%
- By 2100
- 659,015 · +56.6%
Race, ethnicity, and origin ACS 2023
- Neighborhood character
- Predominantly White (78%)
- Race & ethnicity
- White 78% Hispanic / Latino 11% Two or more races 9% Black 4% Asian 4%
- Hispanic origin (detail)
- Mexican 1% Puerto Rican 1% Cuban 3%
- Common ancestry
- Romanian 5% Scotch-Irish 3% Lithuanian 2%
- Foreign-born
- 20% · Canada, Jamaica, Vietnam
- Languages at home
- 77% English-only · Spanish 10% Other Indo-European 5% Russian/Polish/Slavic 3%
Political lean MEDSL · Collier
- 2024 margin
- Solid R (+33.1) · D 33.1% · R 66.2%
- 2008→2024 swing
- -10.6pp toward R · 2008: -22.5pp · 2024: -33.1pp
- All cycles
- 2024: R+33.1 2020: R+24.7 2016: R+26.0 2012: R+30.1 2008: R+22.5
Not yet ingested
- Civics
- —
Market trends
- HPI YoY
- ▲ 0.29%
- Current HPI
- 279.357
- Rent YoY
- ▲ 0.92%
- Metro
- Naples-Marco Island, FL
- State GDP YoY
- ▲ 3.28%
- F500 in state
- 36
Industry mix (Fortune 500 HQ in FL)
| Industry | F500 HQs | Revenue |
|---|---|---|
| Industrial Technology | 2 | $29B |
|
||
| Insurance | 2 | $17B |
|
||
| Retail | 1 | $60B |
|
||
| Technology Distribution | 1 | $58B |
|
||
| Homebuilding | 1 | $35B |
|
||
| Technology Manufacturing | 1 | $35B |
|
||
Price history
+46.5% since first listed11 events — show timeline
- 2026-05-07 Pending — NAPLESMLS
- 2026-04-29 Price Changed $359,000 NAPLESMLS
- 2026-04-27 Relisted — NAPLESMLS
- 2026-04-17 Pending — NAPLESMLS
- 2026-04-08 Price Changed $375,000 NAPLESMLS
- 2026-03-30 Price Changed $399,000 NAPLESMLS
- 2026-03-03 Relisted — NAPLESMLS
- 2026-02-19 Pending — NAPLESMLS
- 2026-02-13 Listed $409,000 NAPLESMLS
- 2005-05-12 Sold (Public Records) $349,000 Public Records
- 2004-08-02 Sold (Public Records) $245,000 Public Records
Property tax history
+7.6%/yrLatest (2025): $3,751 · +0.9% YoY. Source: county tax records.
Cash-flow waterfall
monthlySold comps — $/sqft
last 12 mo · ≤1 miLoading sold comps…