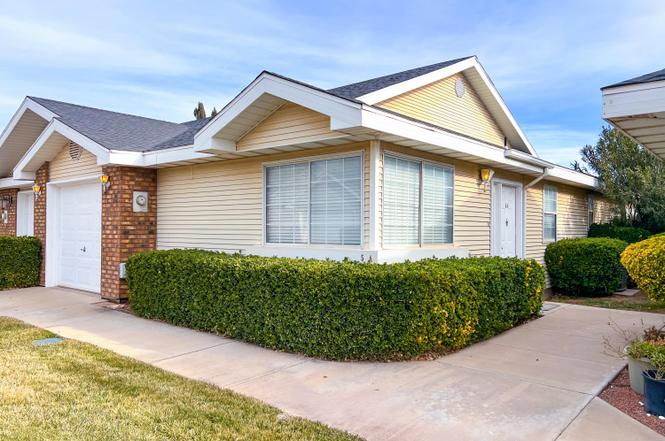
2051 W Canyon View Dr Unit 5A · St. George, UT
Flood risk 1/10 · Minimal
- FEMA flood zone
- X (unshaded)
- Chance of flooding over 30 yrs
- 0.0%
- Est. flood insurance / yr
- $507 – $1,088
Fire risk 6/10 · Moderate
- Est. fire insurance / yr
- $453 – $841
Heat risk 7/10 · Major
- Hot days now (above 105°F)
- 6 days/yr
- Hot days in 30 yrs
- 16 days/yr
Wind risk 1/10 · Minimal
- Chance of severe wind over 30 yrs
- —
Air-quality risk 1/10 · Minimal
- Unhealthy air days now
- 0 days/yr
- Unhealthy air days in 30 yrs
- 0 days/yr
Risk factors via First Street. Map © Google.
Why this score? — see what drove the D grade
The composite is a weighted blend of 9 inputs, each scored 0–100. Each bar is that input's sub-score; the figure is the points it added to the 100-point composite (weight × sub-score).
- Cash flow +15.0/30.0
- ARV discount +7.5/15.0
- 1% rule +5.0/10.0
- DSCR +5.0/10.0
- Schools +3.7/10.0
- Rent growth +3.1/5.0
- Livability +2.5/5.0
- Condition / age +2.5/5.0
- Appreciation +0.0/10.0
$45,000
🖨 Deal sheet (PDF) 📄 Offer letter ✓ Due diligence
Listing remarks MLS
Fractional Ownership in Green Valley Area of St George
Key facts
- Green valley area
- Scenic biking trails
- Hiking trails
Tags
Property features AI
Finance
- HOA & community: Homeowners association with a $199 monthly fee
Exterior
- Utilities: Cable available; Electricity available; Sewer available; Natural gas connected
- Home design: Residential property; Single-story; Entry on main level
- Construction: Vinyl siding; Asphalt roof; Slab foundation; Built on a 30 x 60 lot
- Exterior features: Partial fencing; Landscaped lot
Interior
- Heating & cooling: Central air conditioning; Forced air heating
- Interior features: Window coverings
Neighborhood map
What this means for you Summary
Snapshot
- This is a 3-bed/2.0-bath condo listed at $45k.
Deal economics
- At list price, monthly cash flow is $1k ($16k/yr) — positive.
- The deal already cash-flows at list — no discount required.
- Meets the 1% rule at list price ($2k rent vs $45k).
- Recommended offer: $40k (12.0% below list) — sets the bar for market timing.
Location & tenants
- Location reads: area grade D — affects rentability + tenant quality, not the cash-flow math above.
- Washington District (urban): math 42% / reading 45% proficiency, ranked #37 of 80 in UT (top 46%) — families likely to look elsewhere, expect single-tenant / working-renter base with shorter leases.
- Zoned schools: Arrowhead School (math 34% / reading 36%, grade F, #388 of 585 statewide, top 67%, 552 students, 30% FRL); Tonaquint Intermediate (math 31% / reading 38%, grade F, #96 of 138 statewide, top 69%, 735 students, 42% FRL); Dixie High (math 26% / reading 37%, grade F, #117 of 171 statewide, top 68%, 1,293 students, 31% FRL) — zoned schools at 35% FRL track the district average.
- Market conditions: Rents rising (+2.4%/yr); 779 active listings in the ZIP; 3 comparable units currently listed for rent nearby; rentals at typical pace (median 15d on market — plan ~3-4 weeks tenant-placement turnaround); 3,140 units permitted in Washington County in 2024 (650 in 5+ unit buildings).
- This rent runs 41% of the median local income ($70k/yr) — at the standard rent-burdened threshold; future hikes will face affordability resistance.
Forward outlook
- Local home prices are declining (-3.0%/yr); year-one equity from $311 of loan paydown is wiped out by about $1k of value loss. Plan a longer hold.
- Washington County population projected at +44% by 2050 — long-run rental-demand tailwind backs the buy-and-hold thesis.
- At projected returns (-3.0% appreciation + 2.4% rent growth), your $13k cash investment doubles in ~1 year — after that, you're playing with house money.
Negotiation context
- It's been on market 194 days — a 12% lower offer ($40k) is reasonable based on typical stale-listing flexibility.
- 8 sale attempts since 22y ago with the ask held roughly flat each time — persistent listings suggest the price (not the market) is what's stuck; bring a comps-based counter.
Risks & watch-outs
- Watch-outs: property tax is 4.2% of price.
- Climate carrying-cost: major wildfire risk; extreme-heat days projected 6→16/yr by 2055 (HVAC capex compounding) — expect insurance premiums to compound above CPI over the hold.
Questions for the listing agent
- It's been on market 194 days. Have you received any prior offers? Is the seller open to a 12% concession, seller financing, or rate buy-down credit?
- Property tax is high relative to price — has the assessment been appealed recently, and will the sale trigger a re-assessment?
- What does the HOA fee cover, when was the last increase, and are there any pending special assessments or reserve-fund shortfalls?
- Any open or pending special assessments — roof, HVAC, plumbing, elevator, façade? What's the per-unit balance and payoff schedule, and is the seller paying it off at close or rolling it to the buyer?
- Why hasn't it sold? Are there any deal-killer items the seller is aware of (foundation, flood, title, zoning, code violations)?
- Is there a deadline driving the sale (1031 exchange, divorce, estate, relocation)? That informs how much negotiation room exists.
- The area grade is low — what's the realistic commute time and amenity access for the typical tenant pool here? Any planned neighborhood developments (good or bad) we should know about?
- What's the average days-on-market for RENTAL listings here right now (not sales)? A rising rental-DOM trend means longer vacancies and softer asking-rent achievability than the comps imply.
- What's the recent tenant-quality profile in this submarket — average credit score on applications, eviction rate, late-payment / NSF rate, and stable-employment percentage? A property-management company in the area should have these aggregated.
- How much new apartment / multifamily construction is in the pipeline within 1–3 miles? Heavy new supply (>2% of stock underway) typically softens rents 12–24 months out; light construction supports rent growth.
Investment metrics
- 1% rule
- 5.37% ✓
- Cap rate
- 40.89%
- Cash-on-cash
- 123.55%
- DSCR
- 6.50
- GRM
- 1.6
CMA / ARV
No comps found within radius.
Projected returns pro-forma
-3.0% appreciation · 2.42% rent growth · sell at horizon
- IRR
- —
- Equity multiple
- 6.89×
- Total profit
- $74,154
- Equity at exit
- $6,710
- IRR
- —
- Equity multiple
- 14.19×
- Total profit
- $166,179
- Equity at exit
- $3,891
Cash invested: $12,600 (down + closing). Projections, not guarantees.
Landlord ↔ Tenant lean methodology
- Overall (STATE)
- 86 Strongly Landlord-Friendly
- State Utah
- 86 Strongly Landlord-Friendly · R+15
- County
- — inherits STATE
- City
- — inherits STATE
ZIP-level market 84770
- Rents YoY
- 2.4%
- Active inventory
- 779
- Price-to-rent
- 1.6×
Monthly cashflow live
- Estimated rent
- $2,417 medium interval (Pro) →
- Mortgage (P&I)
- −$236
- Tax from tax record
- −$158 /mo · $1,897/yr
- Insurance
- −$19
- HOA
- −$199
- Vacancy / Maint / Mgmt
- −$507
- Net cashflow
- $1,297
Break-even live
Sensitivity live
| Price | -10% $1,323 | -5% $1,310 | +0% $1,297 | +5% $1,285 | +10% $1,272 |
|---|---|---|---|---|---|
| Rent | -10% $1,106 | -5% $1,202 | +0% $1,297 | +5% $1,393 | +10% $1,488 |
| Rate | -1.0pp $1,320 | -0.5pp $1,309 | base $1,297 | +0.5pp $1,286 | +1.0pp $1,274 |
UW: 25.0% down · 7.5% · 30yr · 1.5% tax · 5.0% vac · 8.0% maint · 8.0% mgmt
Financing live
Cash to close
- Down payment
- $11,250
- Closing costs
- $1,350
- Reserves months
- —
- Total cash needed
- —
Loan-product check · same deal, 3 products live
Conventional
25% down · 7.5% · 30yr
- Down + closing
- —
- Monthly P&I
- —
- Monthly cashflow
- —
- DSCR
- —
- Eligible?
- —
Personal DTI + credit; lowest rate.
DSCR
20% down · 8.5% · 30yr
- Down + closing
- —
- Monthly P&I
- —
- Monthly cashflow
- —
- DSCR
- —
- Eligible?
- —
No personal income docs; deal must DSCR.
Hard money
10% down · 12.0% · 12mo
- Down + closing
- —
- Monthly P&I
- —
- Monthly cashflow
- —
- DSCR
- —
- Eligible?
- —
Short-term bridge; refi at stabilization.
Rent comps 3 comps
| Address | Beds | Baths | Sqft | Rent | $/sqft | DOM | Units | Dist |
|---|---|---|---|---|---|---|---|---|
| 1111 Gap Canyon Pkwy Unit S201 St. George, UT | 3.0 | 3.0 | 1487 | $2,700 | $1.82 | 15d | 1 | 0.04mi |
| 1366 W Indian Hills Dr Saint George, UT | 2.0–3.0 | 2.0–2.5 | 1125 | $1,560 | $1.39 | 22d | 6 | 1.30mi |
| 302 S Divario Canyon Dr Saint George, UT | 1.0–3.0 | 1.0–2.0 | 999 | $1,799 | $1.80 | 15d | 3 | 1.32mi |
HOA detail condo
- Monthly dues
- $199 · $2,388/yr
- Assessments
- None detected in remarks — confirm with the listing agent.
Listing history 43 events
-
2026-06-22days on market $45,000 Active 194 DOM
-
2026-06-19days on market $45,000 Active 192 DOM
-
2026-06-18days on market $45,000 Active 191 DOM
-
2026-06-17days on market $45,000 Active 190 DOM
-
2026-06-16days on market $45,000 Active 189 DOM
-
2026-06-15days on market $45,000 Active 188 DOM
-
2026-06-14days on market $45,000 Active 186 DOM
-
2026-06-13days on market $45,000 Active 185 DOM
-
2026-06-10days on market $45,000 Active 183 DOM
-
2026-06-09days on market $45,000 Active 182 DOM
-
2026-06-08days on market $45,000 Active 181 DOM
-
2026-06-07days on market $45,000 Active 180 DOM
-
2026-06-05days on market $45,000 Active 177 DOM
-
2026-06-02days on market $45,000 Active 175 DOM
-
2026-06-01days on market $45,000 Active 174 DOM
-
2026-05-31days on market $45,000 Active 173 DOM
-
2026-05-30days on market $45,000 Active 172 DOM
-
2025-12-09$45,000 Active
Show marketing remark (54 chars)
Fractional Ownership in Green Valley Area of St George
-
2025-12-09status Active 54-char remark
Show marketing remark (54 chars)
Fractional Ownership in Green Valley Area of St George
-
2025-09-08price $46,000
-
2024-01-17status Pending 54-char remark
Show marketing remark (54 chars)
Fractional Ownership in Green Valley Area of St George
-
2024-01-10price $39,900 54-char remark
Show marketing remark (54 chars)
Fractional Ownership in Green Valley Area of St George
-
2023-10-11$112,000 Active 54-char remark
Show marketing remark (54 chars)
Fractional Ownership in Green Valley Area of St George
-
2023-09-11historical
-
2023-09-05price $44,900
-
2023-02-03$49,000 Active
-
2023-02-01historical
-
2023-01-09price $49,500
-
2022-11-28price $49,000
-
2022-11-17$55,000 Active
-
2022-11-04historical
-
2022-11-02price $55,000
-
2022-10-08price $58,900
-
2022-09-12price $59,000
-
2022-08-31$69,000 Active
-
2022-04-15soldstatus
-
2022-04-14soldstatus Closed
-
2022-02-20historical Backup
-
2022-02-09$55,000 Active
-
2004-03-31soldstatus
-
2004-03-29soldstatus
-
2004-01-07$12,000
-
2002-11-15soldstatus
ⓘ Source: listings_history table (triggers on properties + properties_extension) + one-shot
backfill from property_details.listing_events for pre-trigger history.
Tax reassessment forecast UT · Resets to sale price
- Current annual tax
- $1,897 · $158/mo
- Projected year-2 tax
- $1,897 · $158/mo
- Expected delta
- $0/yr ($0/mo · 0.0%)
ⓘ Screening estimate from a state-policy table — verify with the county assessor before closing.
Climate risk First Street
- Flood 1/10 Low FEMA zone X (unshaded) · 0% chance over 30 yrs
- Wildfire 6/10 Major
- Heat 7/10 Severe 6 d/yr ≥105°F today · 16 d/yr by 30 yrs out
- Wind 1/10 Low
- Air quality 1/10 Low 0 unhealthy d/yr today · 0 by 30 yrs out
Nearby sold comps map
Loading sold comps map…
Walkable amenities ~0.75 mi
Loading nearby amenities…
Taxation est. · year 1
- Rental income
- $28,999
- − Mortgage interest
- −$2,521
- − Property taxes
- −$1,897
- − Insurance
- −$225
- − Repairs & maintenance
- −$2,320
- − Management
- −$2,320
- − HOA
- −$2,388
- − Depreciation
- −$1,309
- Taxable income
- $16,020
- Est. tax owed @ 24.0%
- −$3,845
- After-tax cash flow
- $11,723/yr
For passive investors: Depreciation is non-cash, so a rental often shows a tax loss while cash-flowing — sheltering income. Rental losses are passive: they offset passive income freely, and up to $25,000/yr can offset ordinary (W-2) income if you actively participate and your MAGI is under $100k (phasing out to $0 by $150k); unused losses carry forward. On sale, claimed depreciation is recaptured at up to 25%, and gains may owe capital-gains tax (a 1031 exchange can defer both). Figures are a year-1 estimate at your 24.0% rate — not tax advice; consult a CPA.
Schools (NCES district)
- District
- Washington District
- NCES district ID
- 4901140
- Math proficiency
- 42% ▼ -3.00%
- Reading proficiency
- 45% ▼ -3.00%
- Median HH income
- $50,861
- Composite
- 37.47/100
- National rank
- #4408
- State rank
- #37 of 80 in UT
Livability — St. George
No livability data for this city. (Only ~50 U.S. cities are tracked.)
Census & demographics
- Census place
- St. George, UT
- County
- Washington County · 179,216 people
- City population
- 101,579
- Metro
- St. George, UT
- Population (ZIP)
- 48,397
- Household income
- $70,024
- Rent vs Own
- Severe rent burden
- 1605.0
Population outlook (Washington County) Hauer SSP2
- Today (2025)
- 193,324 people
- By 2030
- 211,699 · +9.5%
- By 2040
- 246,449 · +27.5%
- By 2050
- 278,447 · +44.0%
- By 2075
- 342,734 · +77.3%
- By 2100
- 382,815 · +98.0%
Race, ethnicity, and origin ACS 2023
- Neighborhood character
- Predominantly White (79%)
- Race & ethnicity
- White 79% Hispanic / Latino 15% Two or more races 6% Native American 1% Asian 1%
- Hispanic origin (detail)
- Mexican 10%
- Common ancestry
- Italian 8% Slovak 4% Scottish 2%
- Foreign-born
- 8% · Canada, Vietnam
- Languages at home
- 86% English-only · Spanish 11% Other Indo-European 1% Vietnamese 1%
Political lean MEDSL · Washington
- 2024 margin
- Solid R (+52.3) · D 23.0% · R 75.2% · Other 1.8%
- 2008→2024 swing
- +1.2pp toward D · 2008: -53.5pp · 2024: -52.3pp
- All cycles
- 2024: R+52.3 2020: R+51.7 2016: R+52.1 2012: R+67.0 2008: R+53.5
Not yet ingested
- Civics
- —
Market trends
- HPI YoY
- ▼ -356.86%
- Current HPI
- 234.9418
- Rent YoY
- ▲ 2.42%
- Metro
- St. George, UT
- State GDP YoY
- ▲ 3.54%
- F500 in state
- 2
Industry mix (Fortune 500 HQ in UT)
| Industry | F500 HQs | Revenue |
|---|---|---|
| Financial Services | 1 | $3B |
|
||
Price history
+275.0% since first listed26 events — show timeline
- 2025-12-09 Listed $45,000 WCBOR
- 2025-12-09 Relisted — PCMLS
- 2025-09-08 Price Changed $46,000 WCBOR
- 2024-01-17 Pending — PCMLS
- 2024-01-10 Price Changed $39,900 PCMLS
- 2023-10-11 Listed $112,000 PCMLS
- 2023-09-11 Listing Removed — WFRMLS
- 2023-09-05 Price Changed $44,900 WFRMLS
- 2023-02-03 Listed $49,000 WFRMLS
- 2023-02-01 Listing Removed — WFRMLS
- 2023-01-09 Price Changed $49,500 WFRMLS
- 2022-11-28 Price Changed $49,000 WFRMLS
- 2022-11-17 Listed $55,000 WFRMLS
- 2022-11-04 Listing Removed — WFRMLS
- 2022-11-02 Price Changed $55,000 WFRMLS
- 2022-10-08 Price Changed $58,900 WFRMLS
- 2022-09-12 Price Changed $59,000 WFRMLS
- 2022-08-31 Listed $69,000 WFRMLS
- 2022-04-15 Sold (Public Records) — Public Records
- 2022-04-14 Sold (MLS) — WFRMLS
- 2022-02-20 Contingent — WFRMLS
- 2022-02-09 Listed $55,000 WFRMLS
- 2004-03-31 Sold (MLS) — WFRMLS
- 2004-03-29 Sold (Public Records) — Public Records
- 2004-01-07 Listed $12,000 WFRMLS
- 2002-11-15 Sold (Public Records) — Public Records
Property tax history
+3.1%/yrLatest (2025): $1,897 · +2.6% YoY. Source: county tax records.
Cash-flow waterfall
monthlySold comps — $/sqft
last 12 mo · ≤1 miLoading sold comps…