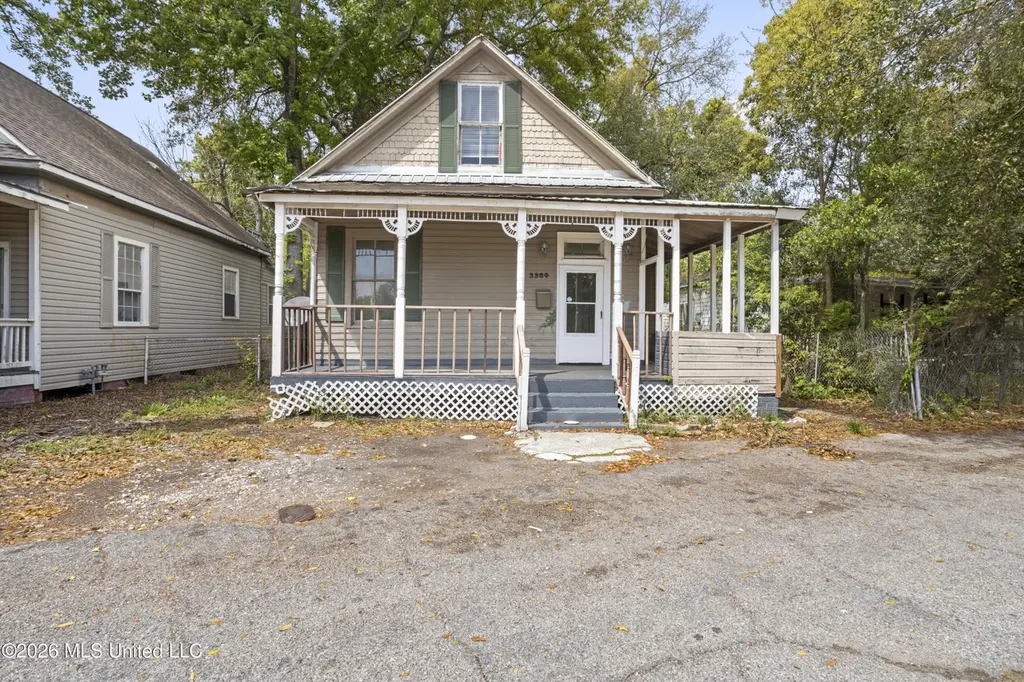
3304 W Railroad St · Gulfport, MS
Flood risk 1/10 · Minimal
- FEMA flood zone
- X (unshaded)
- Chance of flooding over 30 yrs
- 0.0%
- Est. flood insurance / yr
- $507 – $1,088
Fire risk 1/10 · Minimal
- Est. fire insurance / yr
- $1,241 – $2,305
Heat risk 10/10 · Severe
- Hot days now (above 106°F)
- 7 days/yr
- Hot days in 30 yrs
- 24 days/yr
Wind risk 9/10 · Severe
- Chance of severe wind over 30 yrs
- 99.0%
Air-quality risk 1/10 · Minimal
- Unhealthy air days now
- 0 days/yr
- Unhealthy air days in 30 yrs
- 0 days/yr
Risk factors via First Street. Map © Google.
Why this score? — see what drove the B+ grade
The composite is a weighted blend of 9 inputs, each scored 0–100. Each bar is that input's sub-score; the figure is the points it added to the 100-point composite (weight × sub-score).
- Cash flow +30.0/30.0
- ARV discount +15.0/15.0
- 1% rule +10.0/10.0
- DSCR +10.0/10.0
- Rent growth +5.0/5.0
- Livability +3.7/5.0
- Schools +3.4/10.0
- Condition / age +2.5/5.0
- Appreciation +0.0/10.0
$89,900
🖨 Deal sheet (PDF) 📄 Offer letter ✓ Due diligence
Listing remarks MLS
Prime investment opportunity! This fixer-upper is priced for value-add and positioned for strong ROI. Located near the beaches, within walking distance to the casino, and minutes from major entertainment, this property is ideal for a high-demand short-term rental, long-term income property, or profitable flip. Don't miss the chance to capitalize on location and upside potential. AS IS - Schedule your showing today !
Key facts
- Profitable flip
- Upside potential
- Fixer-upper
Tags
Neighborhood map
What this means for you Summary
Snapshot
- This is a 3-bed/1.0-bath single-family listed at $90k.
Deal economics
- At list price, monthly cash flow is $486 ($6k/yr) — positive.
- The deal already cash-flows at list — no discount required.
- Meets the 1% rule at list price ($1k rent vs $90k).
- Recommended offer: $87k (3.0% below list) — sets the bar for market timing.
- Cap rate 12.8% vs local median 4.9% in Gulfport — top-decile yield for the area; either an underpriced asset or a hidden risk that comps aren't pricing in. Stress-test before assuming the spread holds.
Location & tenants
- Location reads 73/100 on livability (#15 in MS) — a middle-class / working-renter tenant base. Strengths: cost of living A+, housing A+, health & safety A+; Watch: schools D, amenities F, commute F.
- Gulfport School District (urban): math 41% / reading 42% proficiency, ranked #37 of 130 in MS (top 28%) — families likely to look elsewhere, expect single-tenant / working-renter base with shorter leases; 67% free/reduced lunch — lower-income household profile, screen leases tightly.
- Market conditions: Rents rising fast (+10.5%/yr); 252 active listings in the ZIP; 17 comparable units currently listed for rent nearby; rentals lingering (median 45d on market — plan ~5-8 weeks vacancy on turnover, expect pricing pressure); 59% of comp listings sitting > 30 days — soft ceiling on asking rent; lower-income renter base — watch delinquency; 2,194 units permitted in Harrison County in 2024 (0 in 5+ unit buildings).
- At $1,360/mo this rent would consume 47% of the median local household income ($35k/yr) (locally 1516% of renters already pay >50% of income on rent) — very limited rent-growth headroom before tenants either downsize or default.
Forward outlook
- Local home prices are declining (-3.0%/yr); year-one equity from $622 of loan paydown is wiped out by about $3k of value loss. Plan a longer hold.
- Harrison County population projected at +27% by 2050 — long-run rental-demand tailwind backs the buy-and-hold thesis.
- At projected returns (-3.0% appreciation + 8.0% rent growth), your $25k cash investment doubles in ~5 years — after that, you're playing with house money.
Negotiation context
- It's been on market 39 days — a 3% lower offer ($87k) is reasonable based on typical stale-listing flexibility.
- 3 sale attempts since 16y ago; this cycle's ask has dropped $20k (18%) from the opening price — seller is motivated, your offer sets the floor, not the list.
Risks & watch-outs
- Watch-outs: built in 1900 — expect roof / HVAC / electrical / plumbing capex.
- Climate carrying-cost: severe wind risk, 99% chance of damaging wind over 30y; extreme-heat days projected 7→24/yr by 2055 (HVAC capex compounding) — expect insurance premiums to compound above CPI over the hold.
Questions for the listing agent
- It's been on market 39 days. Have you received any prior offers? Is the seller open to a 3% concession, seller financing, or rate buy-down credit?
- Built in 1900 — when were the roof, HVAC, electrical panel, plumbing, and water heater last replaced?
- Is there a deadline driving the sale (1031 exchange, divorce, estate, relocation)? That informs how much negotiation room exists.
- Schools are D-rated, which usually means shorter tenancies and higher turnover. Who's the typical renter profile here, and what's been the actual vacancy rate?
- What's the average days-on-market for RENTAL listings here right now (not sales)? A rising rental-DOM trend means longer vacancies and softer asking-rent achievability than the comps imply.
- What's the recent tenant-quality profile in this submarket — average credit score on applications, eviction rate, late-payment / NSF rate, and stable-employment percentage? A property-management company in the area should have these aggregated.
- How much new for-sale + rental construction is in the pipeline within 1–3 miles? Heavy new supply typically softens prices + rents 12–24 months out; constrained supply supports both.
Investment metrics
- 1% rule
- 1.51% ✓
- Cap rate
- 12.79%
- Cash-on-cash
- 23.19%
- DSCR
- 2.03
- GRM
- 5.5
CMA / ARV
- ARV (median comp)
- $161,168
- List price
- $89,900
- Delta
- -44.22%
- Verdict
- UNDERPRICED
- Comps
- 20 within 1.0 mi
Show comp detail 12 sales within ~0.75 mi
| Address | Dist | Beds/Ba | Sqft | Sold | Price | $/sf | Match |
|---|---|---|---|---|---|---|---|
| 1108 37th Ave | 0.27mi | 3/2.0 | 1,267 (+2%) | 5mo | $220,000 | $174 | 76 |
| 1310 36th Ave | 0.19mi | 2/2.0 (-1) | 1,286 (+3%) | 3mo | $175,000 | $136 | 74 |
| 1408 36th Ave | 0.21mi | 2/2.0 (-1) | 1,220 (-2%) | 10mo | $162,000 | $133 | 69 |
| 3416 11th St | 0.18mi | 2/1.0 (-1) | 1,321 (+6%) | 10mo | $217,000 | $164 | 68 |
| 1426 33rd Ave | 0.12mi | 2/1.0 (-1) | 1,105 (-11%) | 8mo | $225,000 | $204 | 64 |
| 3607 Park Blvd | 0.32mi | 2/2.0 (-1) | 1,340 (+8%) | 2mo | $189,900 | $142 | 62 |
| 915 39th Ave | 0.47mi | 2/1.0 (-1) | 1,288 (+4%) | 7mo | $275,000 | $214 | 61 |
| 914 39th Ave | 0.45mi | 3/2.0 | 1,300 (+4%) | 9mo | $300,000 | $231 | 60 |
| 4114 Central St | 0.68mi | 3/2.0 | 1,310 (+5%) | 2mo | $354,000 | $270 | 53 |
| 1705 Oleander Ave | 0.35mi | 2/3.0 (-1) | 1,380 (+11%) | 6mo | $176,500 | $128 | 47 |
| 2116 31st Ave | 0.66mi | 3/2.0 | 1,359 (+9%) | 7mo | $65,000 | $48 | 44 |
| 1521 42nd Ave | 0.62mi | 3/2.0 | 1,100 (-12%) | 13mo | $190,000 | $173 | 37 |
Match score weights: distance 35% · size 25% · config 20% · recency 20%. Top-matched comps best support the ARV.
Projected returns pro-forma
-3.0% appreciation · 8.0% rent growth · sell at horizon
- IRR
- 21.6%
- Equity multiple
- 1.94×
- Total profit
- $23,600
- Equity at exit
- $13,404
- IRR
- 32.7%
- Equity multiple
- 4.70×
- Total profit
- $93,149
- Equity at exit
- $7,773
Cash invested: $25,172 (down + closing). Projections, not guarantees.
Landlord ↔ Tenant lean methodology
- Overall (STATE)
- 90 Strongly Landlord-Friendly
- State Mississippi
- 90 Strongly Landlord-Friendly · R+11
- County
- — inherits STATE
- City
- — inherits STATE
ZIP-level market 39501
- Home prices YoY
- -34.5%
- Rents YoY
- 10.5%
- Active inventory
- 252
- Price-to-rent
- 5.5×
Monthly cashflow live
- Estimated rent
- $1,360 high interval (Pro) →
- Mortgage (P&I)
- −$471
- Tax from tax record
- −$79 /mo · $946/yr
- Insurance
- −$37
- HOA
- −$0
- Vacancy / Maint / Mgmt
- −$286
- Net cashflow
- $486
Break-even live
Sensitivity live
| Price | -10% $537 | -5% $512 | +0% $486 | +5% $461 | +10% $436 |
|---|---|---|---|---|---|
| Rent | -10% $379 | -5% $433 | +0% $486 | +5% $540 | +10% $594 |
| Rate | -1.0pp $532 | -0.5pp $509 | base $486 | +0.5pp $463 | +1.0pp $439 |
UW: 25.0% down · 7.5% · 30yr · 1.5% tax · 5.0% vac · 8.0% maint · 8.0% mgmt
Financing live
Cash to close
- Down payment
- $22,475
- Closing costs
- $2,697
- Reserves months
- —
- Total cash needed
- —
Loan-product check · same deal, 3 products live
Conventional
25% down · 7.5% · 30yr
- Down + closing
- —
- Monthly P&I
- —
- Monthly cashflow
- —
- DSCR
- —
- Eligible?
- —
Personal DTI + credit; lowest rate.
DSCR
20% down · 8.5% · 30yr
- Down + closing
- —
- Monthly P&I
- —
- Monthly cashflow
- —
- DSCR
- —
- Eligible?
- —
No personal income docs; deal must DSCR.
Hard money
10% down · 12.0% · 12mo
- Down + closing
- —
- Monthly P&I
- —
- Monthly cashflow
- —
- DSCR
- —
- Eligible?
- —
Short-term bridge; refi at stabilization.
Rent comps 17 comps
| Address | Beds | Baths | Sqft | Rent | $/sqft | DOM | Units | Dist |
|---|---|---|---|---|---|---|---|---|
| 3305 12th St Gulfport, MS | 2.0 | 1.5 | 1100 | $1,295 | $1.18 | 44d | 1 | 0.09mi |
| 1106 32nd Ave Gulfport, MS | 3.0 | 2.0 | 1200 | $1,300 | $1.08 | 44d | 1 | 0.17mi |
| 1513 34th Ave Gulfport, MS | 2.0 | 2.0 | 884 | $1,250 | $1.41 | 44d | 1 | 0.20mi |
| 3633 Southward Dr Gulfport, MS | 2.0 | 2.0 | 900 | $1,000 | $1.11 | 44d | 1 | 0.32mi |
| 2068 W Beach Blvd Biloxi, MS | 1.0–3.0 | 1.0–2.0 | 998 | $1,700 | $1.70 | 14d | 1 | 0.51mi |
| 1221 42nd Ave Gulfport, MS | 3.0 | 1.0 | 1000 | $1,400 | $1.40 | 44d | 1 | 0.58mi |
| 4319 Lewis St Gulfport, MS | 3.0 | 2.0 | 1371 | $1,649 | $1.20 | 14d | 1 | 0.86mi |
| 2414 34th Ave Gulfport, MS | 2.0 | 1.0 | 912 | $1,125 | $1.23 | 22d | 1 | 0.87mi |
| 4409 Ford St Gulfport, MS | 2.0 | 1.0 | 1000 | $1,500 | $1.50 | 44d | 1 | 0.93mi |
| 1822 15th St Gulfport, MS | 2.0 | 2.0 | 1100 | $1,900 | $1.73 | 44d | 1 | 1.05mi |
| 1412 Jo Ellen Cir Gulfport, MS | 3.0 | 1.5 | 1275 | $1,050 | $0.82 | 14d | 1 | 1.36mi |
| 1206 Beach Ave Gulfport, MS | 3.0 | 2.0 | 1076 | $1,500 | $1.39 | 14d | 1 | 1.36mi |
| 2227 17th Ave Gulfport, MS | 2.0 | 1.0 | 1000 | $850 | $0.85 | 44d | 1 | 1.37mi |
| 2207 16th Ave Gulfport, MS | 2.0 | 1.0 | 1325 | $1,425 | $1.08 | 14d | 1 | 1.41mi |
| 1605 20th St Gulfport, MS | 3.0 | 3.0 | 1350 | $1,095 | $0.81 | 44d | 1 | 1.41mi |
| 1511 2nd St Gulfport, MS | 3.0 | 1.5 | 1030 | $2,000 | $1.94 | 44d | 1 | 1.45mi |
| 2317 30th St Gulfport, MS | 2.0 | 1.0 | 1164 | $2,150 | $1.85 | 22d | 1 | 1.48mi |
Listing history 11 events
-
2026-06-18days on market $89,900 Active 39 DOM
-
2026-06-18status $89,900 Active 38 DOM
-
2026-05-18status Pending 419-char remark
Show marketing remark (419 chars)
Prime investment opportunity! This fixer-upper is priced for value-add and positioned for strong ROI. Located near the beaches, within walking distance to the casino, and minutes from major entertainment, this property is ideal for a high-demand short-term rental, long-term income property, or profitable flip. Don't miss the chance to capitalize on location and upside potential. AS IS - Schedule your showing today !
-
2026-05-13price $89,900 419-char remark
Show marketing remark (419 chars)
Prime investment opportunity! This fixer-upper is priced for value-add and positioned for strong ROI. Located near the beaches, within walking distance to the casino, and minutes from major entertainment, this property is ideal for a high-demand short-term rental, long-term income property, or profitable flip. Don't miss the chance to capitalize on location and upside potential. AS IS - Schedule your showing today !
-
2026-05-08status Active 419-char remark
Show marketing remark (419 chars)
Prime investment opportunity! This fixer-upper is priced for value-add and positioned for strong ROI. Located near the beaches, within walking distance to the casino, and minutes from major entertainment, this property is ideal for a high-demand short-term rental, long-term income property, or profitable flip. Don't miss the chance to capitalize on location and upside potential. AS IS - Schedule your showing today !
-
2026-05-04status Pending 419-char remark
Show marketing remark (419 chars)
Prime investment opportunity! This fixer-upper is priced for value-add and positioned for strong ROI. Located near the beaches, within walking distance to the casino, and minutes from major entertainment, this property is ideal for a high-demand short-term rental, long-term income property, or profitable flip. Don't miss the chance to capitalize on location and upside potential. AS IS - Schedule your showing today !
-
2026-04-29price $94,900 419-char remark
Show marketing remark (419 chars)
Prime investment opportunity! This fixer-upper is priced for value-add and positioned for strong ROI. Located near the beaches, within walking distance to the casino, and minutes from major entertainment, this property is ideal for a high-demand short-term rental, long-term income property, or profitable flip. Don't miss the chance to capitalize on location and upside potential. AS IS - Schedule your showing today !
-
2026-04-06$109,900 Active 419-char remark
Show marketing remark (419 chars)
Prime investment opportunity! This fixer-upper is priced for value-add and positioned for strong ROI. Located near the beaches, within walking distance to the casino, and minutes from major entertainment, this property is ideal for a high-demand short-term rental, long-term income property, or profitable flip. Don't miss the chance to capitalize on location and upside potential. AS IS - Schedule your showing today !
-
2010-12-22soldstatus
-
2010-12-20soldstatus 261-char remark
Show marketing remark (261 chars)
Buyers agent to receive a 1500.00 selling bonus if closed by 12/31/2010. Buyers agent to receive a 1500.00 selling bonus if closed by 12/31/2010 for owner occupant purchases.Property has multiple offers. All agents to submit highest and best by 12/02/2010 @ 3pm
-
2010-11-29$29,900 261-char remark
Show marketing remark (261 chars)
Buyers agent to receive a 1500.00 selling bonus if closed by 12/31/2010. Buyers agent to receive a 1500.00 selling bonus if closed by 12/31/2010 for owner occupant purchases.Property has multiple offers. All agents to submit highest and best by 12/02/2010 @ 3pm
ⓘ Source: listings_history table (triggers on properties + properties_extension) + one-shot
backfill from property_details.listing_events for pre-trigger history.
Tax reassessment forecast MS · Resets to sale price
- Current annual tax
- $946 · $79/mo
- Projected year-2 tax
- $946 · $79/mo
- Expected delta
- $0/yr ($0/mo · 0.0%)
ⓘ Screening estimate from a state-policy table — verify with the county assessor before closing.
Climate risk First Street
- Flood 1/10 Low FEMA zone X (unshaded) · 0% chance over 30 yrs
- Wildfire 1/10 Low
- Heat 10/10 Extreme 7 d/yr ≥106°F today · 24 d/yr by 30 yrs out
- Wind 9/10 Extreme 99% chance of damaging wind over 30 yrs
- Air quality 1/10 Low 0 unhealthy d/yr today · 0 by 30 yrs out
Nearby sold comps map
Loading sold comps map…
Walkable amenities ~0.75 mi
Loading nearby amenities…
Taxation est. · year 1
- Rental income
- $16,316
- − Mortgage interest
- −$5,036
- − Property taxes
- −$946
- − Insurance
- −$450
- − Repairs & maintenance
- −$1,305
- − Management
- −$1,305
- − Depreciation
- −$2,615
- Taxable income
- $4,659
- Est. tax owed @ 24.0%
- −$1,118
- After-tax cash flow
- $4,719/yr
For passive investors: Depreciation is non-cash, so a rental often shows a tax loss while cash-flowing — sheltering income. Rental losses are passive: they offset passive income freely, and up to $25,000/yr can offset ordinary (W-2) income if you actively participate and your MAGI is under $100k (phasing out to $0 by $150k); unused losses carry forward. On sale, claimed depreciation is recaptured at up to 25%, and gains may owe capital-gains tax (a 1031 exchange can defer both). Figures are a year-1 estimate at your 24.0% rate — not tax advice; consult a CPA.
Schools (NCES district)
- District
- Gulfport School District
- NCES district ID
- 2801710
- Math proficiency
- 41% ▼ -15.00%
- Reading proficiency
- 42% ▼ -6.00%
- Median HH income
- $35,712
- Composite
- 34.38/100
- National rank
- #5213
- State rank
- #37 of 130 in MS
Livability — Gulfport
- Score
- 73/100
- State rank
- #15
- US rank
- #5010
Category grades
Schools grade is shown separately in the Schools card above.
Census & demographics
- Census place
- Gulfport, MS
- County
- Harrison County · 178,171 people
- City population
- 96,188
- Metro
- Gulfport-Biloxi, MS
- Population (ZIP)
- 22,565
- Household income
- $34,758
- Rent vs Own
- Severe rent burden
- 1516.0
Population outlook (Harrison County) Hauer SSP2
- Today (2025)
- 228,444 people
- By 2030
- 241,942 · +5.9%
- By 2040
- 267,531 · +17.1%
- By 2050
- 291,062 · +27.4%
- By 2075
- 346,711 · +51.8%
- By 2100
- 378,165 · +65.5%
Race, ethnicity, and origin ACS 2023
- Neighborhood character
- Diverse neighborhood (Simpson 0.56)
- Race & ethnicity
- Black 59% White 29% Two or more races 7% Hispanic / Latino 5%
- Hispanic origin (detail)
- Mexican 2%
- Common ancestry
- Lithuanian 2% Serbian 1% Slovak 1%
- Foreign-born
- 2% · Canada
- Languages at home
- 95% English-only · Spanish 4%
Political lean MEDSL · Harrison
- 2024 margin
- Strong R (+28.9) · D 35.0% · R 63.9% · Other 1.1%
- 2008→2024 swing
- -2.9pp toward R · 2008: -26.0pp · 2024: -28.9pp
- All cycles
- 2024: R+28.9 2020: R+25.2 2016: R+30.7 2012: R+26.6 2008: R+26.0
Not yet ingested
- Civics
- —
Market trends
- HPI YoY
- ▼ -110.16%
- Current HPI
- 208.998
- Rent YoY
- ▲ 10.49%
- Metro
- Gulfport-Biloxi, MS
- State GDP YoY
- —
- F500 in state
- 0
Price history
+200.7% since first listed9 events — show timeline
- 2026-05-18 Pending — MLSU
- 2026-05-13 Price Changed $89,900 MLSU
- 2026-05-08 Relisted — MLSU
- 2026-05-04 Pending — MLSU
- 2026-04-29 Price Changed $94,900 MLSU
- 2026-04-06 Listed $109,900 MLSU
- 2010-12-22 Sold (Public Records) — Public Records
- 2010-12-20 Sold (MLS) — MLSU
- 2010-11-29 Listed $29,900 MLSU
Property tax history
+1.4%/yrLatest (2025): $946 · +4.5% YoY. Source: county tax records.
Cash-flow waterfall
monthlySold comps — $/sqft
last 12 mo · ≤1 miLoading sold comps…