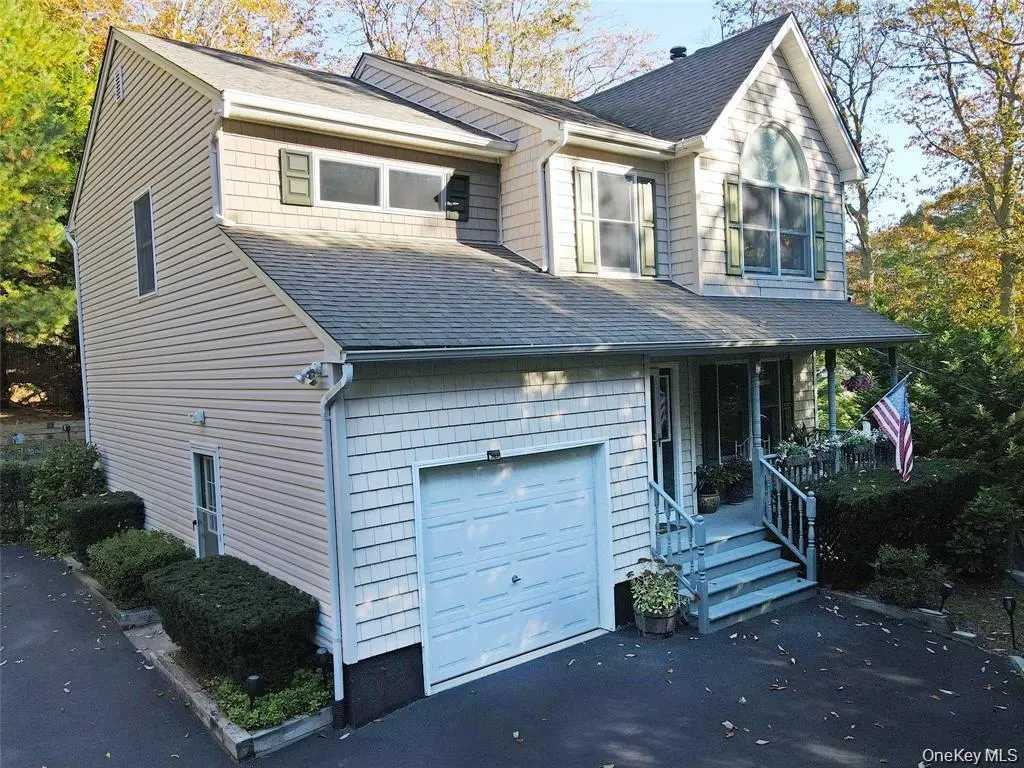
64 Glen Rd · Baiting Hollow, NY
Flood risk 1/10 · Minimal
- FEMA flood zone
- X (unshaded)
- Chance of flooding over 30 yrs
- 0.0%
- Est. flood insurance / yr
- $473 – $860
Fire risk 3/10 · Minor
- Est. fire insurance / yr
- $691 – $1,283
Heat risk 4/10 · Minor
- Hot days now (above 93°F)
- 7 days/yr
- Hot days in 30 yrs
- 18 days/yr
Wind risk 8/10 · Major
- Chance of severe wind over 30 yrs
- 80.0%
Air-quality risk 3/10 · Minor
- Unhealthy air days now
- 2 days/yr
- Unhealthy air days in 30 yrs
- 3 days/yr
Risk factors via First Street. Map © Google.
Why this score? — see what drove the C grade
The composite is a weighted blend of 9 inputs, each scored 0–100. Each bar is that input's sub-score; the figure is the points it added to the 100-point composite (weight × sub-score).
- Cash flow +23.9/30.0
- DSCR +7.7/10.0
- Appreciation +6.6/10.0
- 1% rule +6.2/10.0
- Schools +3.6/10.0
- Livability +3.0/5.0
- ARV discount +2.5/15.0
- Rent growth +2.5/5.0
- Condition / age +2.5/5.0
$799,000
🖨 Deal sheet 📄 Offer letter ✓ Due diligence
Listing remarks MLS
What A Beautiful Young 2004 Built Colonial In A Quiet Desirable Community With Private Beach Rights. This Home Offers Lots Of Updates That Includes Oak Flooring Throughout, Granite Kitchen, Wood Burning Fireplace W/Marble, Newly Finished Basement & A Oversized Deck For Your Summer Entertainment. Nothing Better Than Owning A Home That You Can Walk To The Beach Anytime., Additional information: Appearance:Diamond,Interior Features:Lr/Dr,Separate Hotwater Heater:Yes
Key facts
- Charming gazebo
- Two new trex decks
- Renovated kitchen
Tags
Property features AI
Finance
- HOA & community: Homeowners association with an annual fee of $710; HOA fee covers snow removal and trash
Exterior
- Parking: Driveway; 1-car garage
- Utilities: PSEG electric; Cesspool sewer; Cable available; Water connected
- Home design: Single family residence; Wooded, landscaped backyard
- Construction: Frame construction; Vinyl siding; Concrete perimeter foundation
- Exterior features: Fire pit; Shed(s)
Interior
- Kitchen: Dishwasher; Electric cooktop; Electric oven; Microwave; Refrigerator; Stainless steel appliances
- Bedrooms: Multiple bedrooms (total rooms: 8)
- Flooring: Hardwood floors
- Bathrooms: 2 full bathrooms; 1 half bathroom
- Heating & cooling: Baseboard heating; Hot water heating; Oil heating; Ductless cooling; Wall/window AC units
- Interior features: Eat-in kitchen; Formal dining; Granite counters; Open floorplan; Open kitchen; Primary bathroom; Smart thermostat; Walk-in closets; Finished full basement; Full attic with scuttle access; Covered porch; Deck
- Laundry & utility: Laundry room; Washer; Dryer; Electric water heater
Neighborhood map
What this means for you Summary
Snapshot
- This is a 4-bed/2.5-bath single-family listed at $799k.
Deal economics
- At list price, monthly cash flow is $2k ($19k/yr) — positive.
- The deal already cash-flows at list — no discount required.
- Meets the 1% rule at list price ($9k rent vs $799k).
- Recommended offer: $775k (3.0% below list) — sets the bar for market timing.
- Cap rate 8.6% vs local median 5.5% in Baiting Hollow — top-decile yield for the area; either an underpriced asset or a hidden risk that comps aren't pricing in. Stress-test before assuming the spread holds.
Location & tenants
- Location reads 60/100 on livability (#953 in NY) — a middle-class / working-renter tenant base. Strengths: crime A+, employment A+, housing A+; Watch: amenities F, commute F, cost of living F.
- Riverhead Central School District (suburban): math 34% / reading 48% proficiency, ranked #489 of 590 in NY (top 83%) — families likely to look elsewhere, expect single-tenant / working-renter base with shorter leases.
- Zoned schools: Riley Avenue School (math 42% / reading 52%, grade D-, #1,195 of 2,108 statewide, top 60%, 461 students, 34% FRL); Riverhead Middle School (math 18% / reading 35%, grade F, #594 of 729 statewide, top 81%, 827 students, 57% FRL); Riverhead Senior High School (math 80% / reading 86%, grade A, #440 of 1,100 statewide, top 40%, 2,001 students, 52% FRL).
- Market conditions: 84 active listings in the ZIP; 2 comparable units currently listed for rent nearby; 1,366 units permitted in Suffolk County in 2024 (216 in 5+ unit buildings).
Forward outlook
- In year one you build about $32k of equity ($6k loan paydown + $26k appreciation (3.3% local appreciation)).
- Suffolk County population projected to shrink 5% by 2050 — rents likely to lag national; underwrite the cash flow, not the appreciation.
- At projected returns (3.3% appreciation + 3.0% rent growth), your $224k cash investment doubles in ~5 years — after that, you're playing with house money.
- By year 2, paydown + projected appreciation supports a ~$51k cash-out refi (75% LTV) — recoverable capital for the next deal without selling this one.
Negotiation context
- It's been on market 48 days — a 3% lower offer ($775k) is reasonable based on typical stale-listing flexibility.
- 3 sale attempts since 9y ago with the ask held roughly flat each time — persistent listings suggest the price (not the market) is what's stuck; bring a comps-based counter.
- Current owner paid $395k; list at $799k implies a 102% gain — meaningful room to come down on a strong offer.
Risks & watch-outs
- Climate carrying-cost: severe wind risk, 80% chance of damaging wind over 30y — expect insurance premiums to compound above CPI over the hold.
Questions for the listing agent
- It's been on market 48 days. Have you received any prior offers? Is the seller open to a 3% concession, seller financing, or rate buy-down credit?
- What does the HOA fee cover, when was the last increase, and are there any pending special assessments or reserve-fund shortfalls?
- Is there a deadline driving the sale (1031 exchange, divorce, estate, relocation)? That informs how much negotiation room exists.
- Schools are D-rated, which usually means shorter tenancies and higher turnover. Who's the typical renter profile here, and what's been the actual vacancy rate?
- What's the average days-on-market for RENTAL listings here right now (not sales)? A rising rental-DOM trend means longer vacancies and softer asking-rent achievability than the comps imply.
- What's the recent tenant-quality profile in this submarket — average credit score on applications, eviction rate, late-payment / NSF rate, and stable-employment percentage? A property-management company in the area should have these aggregated.
- How much new for-sale + rental construction is in the pipeline within 1–3 miles? Heavy new supply typically softens prices + rents 12–24 months out; constrained supply supports both.
Investment metrics
- 1% rule
- 1.12% ✓
- Cap rate
- 8.63%
- Cash-on-cash
- 8.35%
- DSCR
- 1.37
- GRM
- 7.4
CMA / ARV
- ARV (median comp)
- $718,855
- List price
- $799,000
- Delta
- 11.15%
- Verdict
- OVERPRICED
- Comps
- 6 within 1.0 mi
Show comp detail 4 sales within ~0.75 mi
| Address | Dist | Beds/Ba | Sqft | Sold | Price | $/sf | Match |
|---|---|---|---|---|---|---|---|
| 76 Fern Rd E | 0.07mi | 3/2.5 (-1) | 2,348 (-12%) | 8mo | $870,000 | $371 | 66 |
| 1485 Sound Ave | 0.40mi | 3/2.5 (-1) | 2,800 (+6%) | 11mo | $975,000 | $348 | 58 |
| 103 Silver Beech Ln | 0.67mi | 3/3.5 (-1) | 2,775 (+5%) | 4mo | $1,360,000 | $490 | 49 |
| 3 Silver Beech Ln | 0.69mi | 4/2.5 | 2,600 (-2%) | 19mo | $975,000 | $375 | 48 |
Match score weights: distance 35% · size 25% · config 20% · recency 20%. Top-matched comps best support the ARV.
Projected returns pro-forma
3.26% appreciation · 3.0% rent growth · sell at horizon
- IRR
- 16.0%
- Equity multiple
- 1.92×
- Total profit
- $206,564
- Equity at exit
- $371,001
- IRR
- 17.4%
- Equity multiple
- 3.61×
- Total profit
- $583,212
- Equity at exit
- $581,054
Cash invested: $223,720 (down + closing). Projections, not guarantees.
Landlord ↔ Tenant lean methodology
- Overall (STATE)
- 15 Strongly Tenant-Friendly
- State New York
- 15 Strongly Tenant-Friendly · D+10
- County
- — inherits STATE
- City
- — inherits STATE
ZIP-level market 11933
- Home prices YoY
- 0.8%
- Active inventory
- 84
- Price-to-rent
- 7.4×
Monthly cashflow live
- Estimated rent
- $8,986 medium interval (Pro) →
- Mortgage (P&I)
- −$4,190
- Tax from tax record
- −$960 /mo · $11,524/yr
- Insurance
- −$333
- HOA
- −$59
- Vacancy / Maint / Mgmt
- −$1,887
- Net cashflow
- $1,556
Break-even live
UW: 25.0% down · 7.5% · 30yr · 1.5% tax · 5.0% vac · 8.0% maint · 8.0% mgmt
Financing live
Cash to close
- Down payment
- $199,750
- Closing costs
- $23,970
- Reserves months
- —
- Total cash needed
- —
Loan-product check · same deal, 3 products live
Conventional
25% down · 7.5% · 30yr
- Down + closing
- —
- Monthly P&I
- —
- Monthly cashflow
- —
- DSCR
- —
- Eligible?
- —
Personal DTI + credit; lowest rate.
DSCR
20% down · 8.5% · 30yr
- Down + closing
- —
- Monthly P&I
- —
- Monthly cashflow
- —
- DSCR
- —
- Eligible?
- —
No personal income docs; deal must DSCR.
Hard money
10% down · 12.0% · 12mo
- Down + closing
- —
- Monthly P&I
- —
- Monthly cashflow
- —
- DSCR
- —
- Eligible?
- —
Short-term bridge; refi at stabilization.
Rent comps 2 comps
| Address | Beds | Baths | Sqft | Rent | $/sqft | DOM | Units | Dist |
|---|---|---|---|---|---|---|---|---|
| 52 Summit Dr Calverton, NY | 3.0 | 2.0 | 2256 | $10,000 | $4.43 | 44d | 1 | 0.68mi |
| 1871 Edwards Ave Calverton, NY | 4.0 | 2.5 | 2378 | $8,000 | $3.36 | 7d | 1 | 0.70mi |
HOA detail
- Monthly dues
- $59 · $708/yr
- Likely covers
- water
Listing history 22 events
-
2026-06-18days on market $799,000 Active 48 DOM
-
2026-06-17days on market $799,000 Active 47 DOM
-
2026-06-16days on market $799,000 Active 46 DOM
-
2026-06-15days on market $799,000 Active 45 DOM
-
2026-06-13days on market $799,000 Active 43 DOM
-
2026-06-09days on market $799,000 Active 39 DOM
-
2026-06-08days on market $799,000 Active 38 DOM
-
2026-06-07days on market $799,000 Active 37 DOM
-
2026-06-04days on market $799,000 Active 34 DOM
-
2026-06-03days on market $799,000 Active 33 DOM
-
2026-06-02days on market $799,000 Active 32 DOM
-
2026-06-01days on market $799,000 Active 31 DOM
-
2026-05-31days on market $799,000 Active 30 DOM
-
2026-05-01$799,000 Active 1245-char remark
-
2026-05-01historical
-
2026-03-28price $799,000
-
2026-02-01price $824,999
-
2025-10-27$849,999 Active
-
2018-02-06soldstatus $395,000
-
2018-01-12soldstatus $395,000 Closed
Show marketing remark (471 chars)
What A Beautiful Young 2004 Built Colonial In A Quiet Desirable Community With Private Beach Rights. This Home Offers Lots Of Updates That Includes Oak Flooring Throughout, Granite Kitchen, Wood Burning Fireplace W/Marble, Newly Finished Basement & A Oversized Deck For Your Summer Entertainment. Nothing Better Than Owning A Home That You Can Walk To The Beach Anytime., Additional information: Appearance:Diamond,Interior Features:Lr/Dr,Separate Hotwater Heater:Yes
-
2017-11-14status Under Contract
Show marketing remark (471 chars)
What A Beautiful Young 2004 Built Colonial In A Quiet Desirable Community With Private Beach Rights. This Home Offers Lots Of Updates That Includes Oak Flooring Throughout, Granite Kitchen, Wood Burning Fireplace W/Marble, Newly Finished Basement & A Oversized Deck For Your Summer Entertainment. Nothing Better Than Owning A Home That You Can Walk To The Beach Anytime., Additional information: Appearance:Diamond,Interior Features:Lr/Dr,Separate Hotwater Heater:Yes
-
2017-10-20$399,900 New
Show marketing remark (471 chars)
What A Beautiful Young 2004 Built Colonial In A Quiet Desirable Community With Private Beach Rights. This Home Offers Lots Of Updates That Includes Oak Flooring Throughout, Granite Kitchen, Wood Burning Fireplace W/Marble, Newly Finished Basement & A Oversized Deck For Your Summer Entertainment. Nothing Better Than Owning A Home That You Can Walk To The Beach Anytime., Additional information: Appearance:Diamond,Interior Features:Lr/Dr,Separate Hotwater Heater:Yes
ⓘ Source: listings_history table (triggers on properties + properties_extension) + one-shot
backfill from property_details.listing_events for pre-trigger history.
Tax reassessment forecast NY · Partial reset (capped growth)
- Current annual tax
- $11,524 · $960/mo
- Projected year-2 tax
- $12,514 · $1,043/mo
- Expected delta
- +$989/yr (+$82/mo · 8.6%)
ⓘ Screening estimate from a state-policy table — verify with the county assessor before closing.
Climate risk First Street
- Flood 1/10 Low FEMA zone X (unshaded) · 0% chance over 30 yrs
- Wildfire 3/10 Moderate
- Heat 4/10 Moderate 7 d/yr ≥93°F today · 18 d/yr by 30 yrs out
- Wind 8/10 Severe 80% chance of damaging wind over 30 yrs
- Air quality 3/10 Moderate 2 unhealthy d/yr today · 3 by 30 yrs out
Nearby sold comps map
Loading sold comps map…
Walkable amenities ~0.75 mi
Loading nearby amenities…
Taxation est. · year 1
- Rental income
- $107,830
- − Mortgage interest
- −$44,756
- − Property taxes
- −$11,524
- − Insurance
- −$3,995
- − Repairs & maintenance
- −$8,626
- − Management
- −$8,626
- − HOA
- −$708
- − Depreciation
- −$23,244
- Taxable income
- $6,350
- Est. tax owed @ 24.0%
- −$1,524
- After-tax cash flow
- $17,154/yr
For passive investors: Depreciation is non-cash, so a rental often shows a tax loss while cash-flowing — sheltering income. Rental losses are passive: they offset passive income freely, and up to $25,000/yr can offset ordinary (W-2) income if you actively participate and your MAGI is under $100k (phasing out to $0 by $150k); unused losses carry forward. On sale, claimed depreciation is recaptured at up to 25%, and gains may owe capital-gains tax (a 1031 exchange can defer both). Figures are a year-1 estimate at your 24.0% rate — not tax advice; consult a CPA.
Schools (NCES district)
- District
- Riverhead Central School District
- NCES district ID
- 3624690
- Math proficiency
- 34% ▼ -4.00%
- Reading proficiency
- 48% ▲ 13.00%
- Median HH income
- $61,607
- Composite
- 36.38/100
- National rank
- #4683
- State rank
- #489 of 590 in NY
Livability — Baiting Hollow
- Score
- 60/100
- State rank
- #953
- US rank
- #18639
Category grades
Schools grade is shown separately in the Schools card above.
Census & demographics
- Census place
- Baiting Hollow, NY
- Population (ZIP)
- 6,784
Population outlook (Suffolk County) Hauer SSP2
- Today (2025)
- 1,505,262 people
- By 2030
- 1,498,318 · -0.5%
- By 2040
- 1,471,101 · -2.3%
- By 2050
- 1,424,848 · -5.3%
- By 2075
- 1,337,157 · -11.2%
- By 2100
- 1,217,720 · -19.1%
Race, ethnicity, and origin ACS 2023
- Neighborhood character
- Predominantly White (79%)
- Race & ethnicity
- White 79% Hispanic / Latino 10% Black 8% Two or more races 2% Asian 1%
- Hispanic origin (detail)
- Puerto Rican 1% Dominican 4%
- Common ancestry
- Romanian 5% Lithuanian 3% Iranian 1%
- Foreign-born
- 11% · Canada, Jamaica, South Korea
- Languages at home
- 85% English-only · Spanish 10% Other Indo-European 3% German/W. Germanic 1%
Political lean MEDSL · Suffolk
- 2024 margin
- Lean R (+10.0) · D 45.0% · R 55.0%
- 2008→2024 swing
- -16.0pp toward R · 2008: 6.0pp · 2024: -10.0pp
- All cycles
- 2024: R+10.0 2020: R+0.0 2016: R+8.2 2012: D+2.9 2008: D+6.0
Not yet ingested
- Civics
- —
Market trends
- HPI YoY
- ▲ 3.26%
- Current HPI
- 397.7148
- Rent YoY
- —
- Metro
- —
- State GDP YoY
- ▲ 2.60%
- F500 in state
- 92
Industry mix (Fortune 500 HQ in NY)
| Industry | F500 HQs | Revenue |
|---|---|---|
| Financial Services | 10 | $950B |
|
||
| Consumer Goods | 9 | $162B |
|
||
| Insurance | 4 | $225B |
|
||
| Telecommunications | 2 | $144B |
|
||
| Pharmaceuticals | 2 | $112B |
|
||
| Media / Entertainment | 2 | $69B |
|
||
Price history
+99.8% since first listed9 events — show timeline
- 2026-05-01 Listing Removed — OneKey® MLS as Distributed by MLS Grid
- 2026-05-01 Listed $799,000 OneKey® MLS as Distributed by MLS Grid
- 2026-03-28 Price Changed $799,000 OneKey® MLS as Distributed by MLS Grid
- 2026-02-01 Price Changed $824,999 OneKey® MLS as Distributed by MLS Grid
- 2025-10-27 Listed $849,999 OneKey® MLS as Distributed by MLS Grid
- 2018-02-06 Sold (Public Records) $395,000 Public Records
- 2018-01-12 Sold (MLS) $395,000 OneKey® MLS as Distributed by MLS Grid
- 2017-11-14 Pending — OneKey® MLS as Distributed by MLS Grid
- 2017-10-20 Listed $399,900 OneKey® MLS as Distributed by MLS Grid
Property tax history
+3.0%/yrLatest (2025): $11,524 · +0.0% YoY. Source: county tax records.
Cash-flow waterfall
monthlySold comps — $/sqft
last 12 mo · ≤1 miLoading sold comps…