1002 Grandridge Rd · Grandview, WA
Flood risk 1/10 · Minimal
- FEMA flood zone
- X (unshaded)
- Chance of flooding over 30 yrs
- 0.0%
- Est. flood insurance / yr
- $507 – $1,088
Fire risk 1/10 · Minimal
- Est. fire insurance / yr
- $604 – $1,122
Heat risk 4/10 · Minor
- Hot days now (above 98°F)
- 7 days/yr
- Hot days in 30 yrs
- 15 days/yr
Wind risk 1/10 · Minimal
- Chance of severe wind over 30 yrs
- —
Air-quality risk 9/10 · Severe
- Unhealthy air days now
- 13 days/yr
- Unhealthy air days in 30 yrs
- 13 days/yr
Risk factors via First Street. Map © Google.
Why this score? — see what drove the C grade
The composite is a weighted blend of 9 inputs, each scored 0–100. Each bar is that input's sub-score; the figure is the points it added to the 100-point composite (weight × sub-score).
- Cash flow +19.8/30.0
- ARV discount +15.0/15.0
- DSCR +6.3/10.0
- 1% rule +4.5/10.0
- Schools +3.9/10.0
- Livability +3.4/5.0
- Rent growth +2.5/5.0
- Condition / age +2.5/5.0
- Appreciation +0.0/10.0
$189,900
🖨 Deal sheet 📄 Offer letter ✓ Due diligence
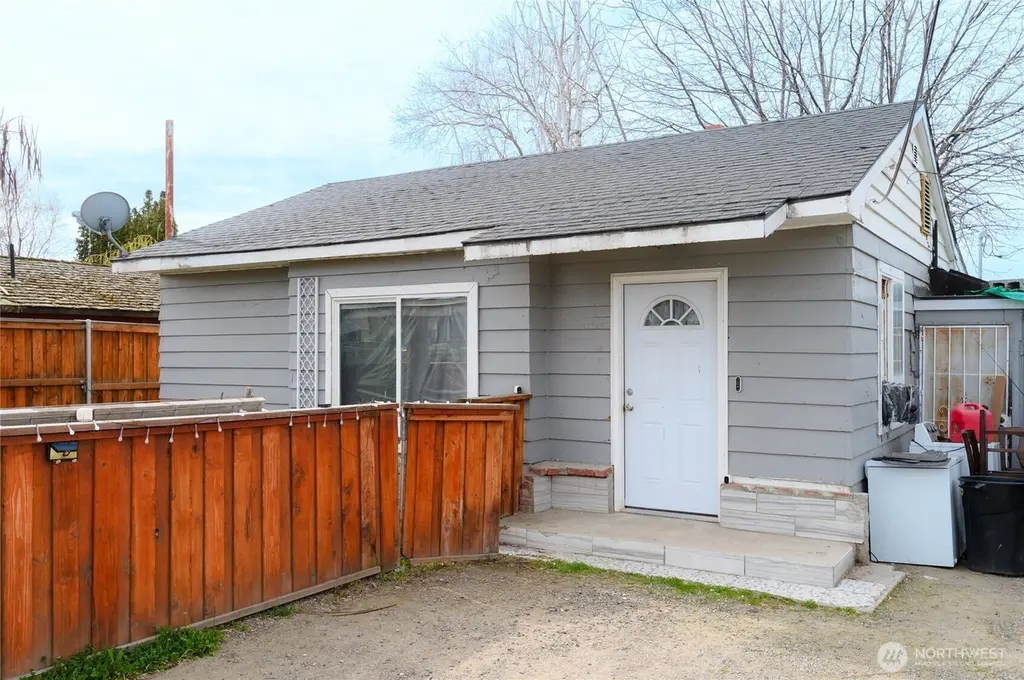
Listing remarks
Welcome to this charming home in the heart of Grandview, offering great potential and opportunity for customization. The main level features a functional layout with a spacious living area, a dedicated dining space, and a kitchen with ample cabinetry ready for your personal touch. This home offers flexible living with multiple bedrooms and an unfinished basement, providing the perfect opportunity to add value, create additional living space, or customize to fit your needs. With a little TLC, this property can truly shine and become a great primary residence or investment opportunity. The property also features ample parking and a convenient location close to schools, parks, and local amenit
Key facts
- Ample cabinetry
- Ample parking
- Unfinished basement
Tags
Neighborhood map
What this means for you Summary
Snapshot
- This is a 2-bed/1.0-bath single-family listed at $190k.
Deal economics
- At list price, monthly cash flow is $224 ($3k/yr) — positive.
- The deal already cash-flows at list — no discount required.
- To meet the 1% rule (rent ≥ 1% of price), the offer needs to be $181k (4.8% below list).
- Recommended offer: $173k (9.0% below list) — sets the bar for market timing.
- Cap rate 7.7% vs local median 2.2% in Grandview — top-decile yield for the area; either an underpriced asset or a hidden risk that comps aren't pricing in. Stress-test before assuming the spread holds.
Location & tenants
- Location reads 67/100 on livability (#308 in WA) — a middle-class / working-renter tenant base. Strengths: cost of living A+, housing A+; Watch: schools D, crime D, amenities F.
- Grandview School District (town): math 47% / reading 40% proficiency, ranked #203 of 291 in WA (top 70%) — families likely to look elsewhere, expect single-tenant / working-renter base with shorter leases; 73% free/reduced lunch — lower-income household profile, screen leases tightly.
- Market conditions: 193 active listings in the ZIP; 2 comparable units currently listed for rent nearby; 468 units permitted in Yakima County in 2024 (23 in 5+ unit buildings).
Forward outlook
- Local home prices are declining (-3.0%/yr); year-one equity from $1k of loan paydown is wiped out by about $6k of value loss. Plan a longer hold.
- Yakima County population projected at +6% by 2050 — modest demand growth; plan on rents tracking national, not racing it.
Negotiation context
- It's been on market 91 days — a 9% lower offer ($173k) is reasonable based on typical stale-listing flexibility.
- Current owner paid $52k; list at $190k implies a 262% gain — meaningful room to come down on a strong offer.
Risks & watch-outs
- Watch-outs: built in 1952 — expect roof / HVAC / electrical / plumbing capex.
Questions for the listing agent
- It's been on market 91 days. Have you received any prior offers? Is the seller open to a 9% concession, seller financing, or rate buy-down credit?
- Built in 1952 — when were the roof, HVAC, electrical panel, plumbing, and water heater last replaced?
- Why hasn't it sold? Are there any deal-killer items the seller is aware of (foundation, flood, title, zoning, code violations)?
- Is there a deadline driving the sale (1031 exchange, divorce, estate, relocation)? That informs how much negotiation room exists.
- Schools are D-rated, which usually means shorter tenancies and higher turnover. Who's the typical renter profile here, and what's been the actual vacancy rate?
- Crime grade is D in this area — have there been break-ins, vandalism, or insurance claims at this property in the last 3 years? What carrier currently insures it and at what premium?
- What's the average days-on-market for RENTAL listings here right now (not sales)? A rising rental-DOM trend means longer vacancies and softer asking-rent achievability than the comps imply.
- What's the recent tenant-quality profile in this submarket — average credit score on applications, eviction rate, late-payment / NSF rate, and stable-employment percentage? A property-management company in the area should have these aggregated.
- How much new for-sale + rental construction is in the pipeline within 1–3 miles? Heavy new supply typically softens prices + rents 12–24 months out; constrained supply supports both.
Investment metrics
- 1% rule
- 0.95% ✗
- Cap rate
- 7.71%
- Cash-on-cash
- 5.06%
- DSCR
- 1.23
- GRM
- 8.8
CMA / ARV
- ARV (median comp)
- $317,788
- List price
- $189,900
- Delta
- -40.24%
- Verdict
- UNDERPRICED
- Comps
- 20 within 1.0 mi
Show comp detail 4 sales within ~0.75 mi
| Address | Dist | Beds/Ba | Sqft | Sold | Price | $/sf | Match |
|---|---|---|---|---|---|---|---|
| 124 Blantons Lp | 0.36mi | 3/2.0 (+1) | 1,007 (+8%) | 3mo | $315,990 | $314 | 59 |
| 305 Birch St | 0.56mi | 3/1.0 (+1) | 936 (0%) | 13mo | $295,000 | $315 | 58 |
| 908 W 5th St | 0.55mi | 3/1.5 (+1) | 974 (+4%) | 10mo | $299,000 | $307 | 52 |
| 1204 Missouri St | 0.69mi | 2/1.0 | 967 (+3%) | 20mo | $285,000 | $295 | 45 |
Match score weights: distance 35% · size 25% · config 20% · recency 20%. Top-matched comps best support the ARV.
Projected returns pro-forma
-3.0% appreciation · 3.0% rent growth · sell at horizon
- IRR
- -8.5%
- Equity multiple
- 0.69×
- Total profit
- $-16,518
- Equity at exit
- $28,315
- IRR
- 1.0%
- Equity multiple
- 1.07×
- Total profit
- $3,861
- Equity at exit
- $16,419
Cash invested: $53,172 (down + closing). Projections, not guarantees.
Landlord ↔ Tenant lean methodology
- Overall (STATE)
- 28 Tenant-Leaning
- State Washington
- 28 Tenant-Leaning · D+8
- County
- — inherits STATE
- City
- — inherits STATE
ZIP-level market 98930
- Home prices YoY
- -16.7%
- Active inventory
- 193
- Price-to-rent
- 8.8×
Monthly cashflow live
- Estimated rent
- $1,808 medium interval (Pro) →
- Mortgage (P&I)
- −$996
- Tax from tax record
- −$129 /mo · $1,550/yr
- Insurance
- −$79
- HOA
- −$0
- Vacancy / Maint / Mgmt
- −$380
- Net cashflow
- $224
Break-even live
UW: 25.0% down · 7.5% · 30yr · 1.5% tax · 5.0% vac · 8.0% maint · 8.0% mgmt
Financing live
Cash to close
- Down payment
- $47,475
- Closing costs
- $5,697
- Reserves months
- —
- Total cash needed
- —
Loan-product check · same deal, 3 products live
Conventional
25% down · 7.5% · 30yr
- Down + closing
- —
- Monthly P&I
- —
- Monthly cashflow
- —
- DSCR
- —
- Eligible?
- —
Personal DTI + credit; lowest rate.
DSCR
20% down · 8.5% · 30yr
- Down + closing
- —
- Monthly P&I
- —
- Monthly cashflow
- —
- DSCR
- —
- Eligible?
- —
No personal income docs; deal must DSCR.
Hard money
10% down · 12.0% · 12mo
- Down + closing
- —
- Monthly P&I
- —
- Monthly cashflow
- —
- DSCR
- —
- Eligible?
- —
Short-term bridge; refi at stabilization.
Rent comps 2 comps
| Address | Beds | Baths | Sqft | Rent | $/sqft | DOM | Units | Dist |
|---|---|---|---|---|---|---|---|---|
| 1007 Grandridge Rd Unit C202 Grandview, WA | 2.0 | 2.0 | 963 | $1,885 | $1.96 | 43d | 1 | 0.08mi |
| 1002 Hillcrest St Grandview, WA | 2.0 | 1.0 | 888 | $1,195 | $1.35 | 43d | 1 | 0.78mi |
Listing history 18 events
-
2026-06-18days on market $189,900 Active 91 DOM
-
2026-06-17days on market $189,900 Active 90 DOM
-
2026-06-16days on market $189,900 Active 89 DOM
-
2026-06-15days on market $189,900 Active 88 DOM
-
2026-06-15days on market $189,900 Active 87 DOM
-
2026-06-13days on market $189,900 Active 86 DOM
-
2026-06-12days on market $189,900 Active 85 DOM
-
2026-06-09days on market $189,900 Active 82 DOM
-
2026-06-08days on market $189,900 Active 81 DOM
-
2026-06-08days on market $189,900 Active 80 DOM
-
2026-06-05days on market $189,900 Active 78 DOM
-
2026-06-03days on market $189,900 Active 76 DOM
-
2026-06-02days on market $189,900 Active 75 DOM
-
2026-06-01days on market $189,900 Active 74 DOM
-
2026-05-31days on market $189,900 Active 73 DOM
-
2026-04-21price $199,900
-
2026-03-19$209,900 Active
-
2010-06-21soldstatus $52,500
ⓘ Source: listings_history table (triggers on properties + properties_extension) + one-shot
backfill from property_details.listing_events for pre-trigger history.
Tax reassessment forecast WA · Resets to sale price
- Current annual tax
- $1,550 · $129/mo
- Projected year-2 tax
- $1,861 · $155/mo
- Expected delta
- +$311/yr (+$26/mo · 20.1%)
ⓘ Screening estimate from a state-policy table — verify with the county assessor before closing.
Climate risk First Street
- Flood 1/10 Low FEMA zone X (unshaded) · 0% chance over 30 yrs
- Wildfire 1/10 Low
- Heat 4/10 Moderate 7 d/yr ≥98°F today · 15 d/yr by 30 yrs out
- Wind 1/10 Low
- Air quality 9/10 Extreme 13 unhealthy d/yr today · 13 by 30 yrs out
Nearby sold comps map
Loading sold comps map…
Walkable amenities ~0.75 mi
Loading nearby amenities…
Taxation est. · year 1
- Rental income
- $21,699
- − Mortgage interest
- −$10,637
- − Property taxes
- −$1,550
- − Insurance
- −$950
- − Repairs & maintenance
- −$1,736
- − Management
- −$1,736
- − Depreciation
- −$5,524
- Taxable loss
- −$434
- Est. tax savings @ 24.0%
- +$104
- After-tax cash flow
- $2,797/yr
For passive investors: Depreciation is non-cash, so a rental often shows a tax loss while cash-flowing — sheltering income. Rental losses are passive: they offset passive income freely, and up to $25,000/yr can offset ordinary (W-2) income if you actively participate and your MAGI is under $100k (phasing out to $0 by $150k); unused losses carry forward. On sale, claimed depreciation is recaptured at up to 25%, and gains may owe capital-gains tax (a 1031 exchange can defer both). Figures are a year-1 estimate at your 24.0% rate — not tax advice; consult a CPA.
Schools (NCES district)
- District
- Grandview School District
- NCES district ID
- 5303150
- Math proficiency
- 47% ▲ 8.00%
- Reading proficiency
- 40% ▬ 0.00%
- Median HH income
- $43,388
- Composite
- 39.06/100
- National rank
- #8271
- State rank
- #203 of 291 in WA
Livability — Grandview
- Score
- 67/100
- State rank
- #308
- US rank
- #10853
Category grades
Schools grade is shown separately in the Schools card above.
Census & demographics
- Census place
- Grandview, WA
- Population (ZIP)
- 15,071
Population outlook (Yakima County) Hauer SSP2
- Today (2025)
- 256,514 people
- By 2030
- 259,403 · +1.1%
- By 2040
- 265,677 · +3.6%
- By 2050
- 273,061 · +6.5%
- By 2075
- 296,991 · +15.8%
- By 2100
- 315,291 · +22.9%
Race, ethnicity, and origin ACS 2023
- Neighborhood character
- Predominantly Hispanic (79%)
- Race & ethnicity
- Hispanic / Latino 79% Two or more races 27% White 18% Native American 1%
- Hispanic origin (detail)
- Mexican 77%
- Common ancestry
- Italian 2% Portuguese 1% Iranian 1%
- Foreign-born
- 27% · Canada
- Languages at home
- 33% English-only · Spanish 65%
Political lean MEDSL · Yakima
- 2024 margin
- R (+14.3) · D 41.6% · R 55.9% · Other 2.5%
- 2008→2024 swing
- -3.8pp toward R · 2008: -10.6pp · 2024: -14.3pp
- All cycles
- 2024: R+14.3 2020: R+7.7 2016: R+15.4 2012: R+15.1 2008: R+10.6
Not yet ingested
- Civics
- —
Market trends
- HPI YoY
- ▼ -65.13%
- Current HPI
- 324.6036
- Rent YoY
- —
- Metro
- —
- State GDP YoY
- ▲ 4.65%
- F500 in state
- 22
Industry mix (Fortune 500 HQ in WA)
| Industry | F500 HQs | Revenue |
|---|---|---|
| Retail | 2 | $269B |
|
||
| Technology / Retail | 1 | $638B |
|
||
| Technology | 1 | $245B |
|
||
| Telecommunications | 1 | $38B |
|
||
| Food / Beverage | 1 | $36B |
|
||
| Automotive / Trucks | 1 | $34B |
|
||
Price history
+280.8% since first listed3 events — show timeline
- 2026-04-21 Price Changed $199,900 NWMLS as Distributed by MLS Grid
- 2026-03-19 Listed $209,900 NWMLS as Distributed by MLS Grid
- 2010-06-21 Sold (Public Records) $52,500 Public Records
Property tax history
+5.8%/yrLatest (2026): $1,550 · +6.7% YoY. Source: county tax records.
Cash-flow waterfall
monthlySold comps — $/sqft
last 12 mo · ≤1 miLoading sold comps…