2704 Rion St · Georgetown, SC
Flood risk 1/10 · Minimal
- FEMA flood zone
- X (unshaded)
- Chance of flooding over 30 yrs
- 0.0%
- Est. flood insurance / yr
- $507 – $1,088
Fire risk 5/10 · Moderate
- Est. fire insurance / yr
- $783 – $1,453
Heat risk 9/10 · Severe
- Hot days now (above 108°F)
- 7 days/yr
- Hot days in 30 yrs
- 17 days/yr
Wind risk 8/10 · Major
- Chance of severe wind over 30 yrs
- 99.0%
Air-quality risk 2/10 · Minimal
- Unhealthy air days now
- 0 days/yr
- Unhealthy air days in 30 yrs
- 1 days/yr
Risk factors via First Street. Map © Google.
Why this score? — see what drove the C grade
The composite is a weighted blend of 9 inputs, each scored 0–100. Each bar is that input's sub-score; the figure is the points it added to the 100-point composite (weight × sub-score).
- Cash flow +20.8/30.0
- ARV discount +15.0/15.0
- DSCR +6.6/10.0
- 1% rule +4.3/10.0
- Livability +3.2/5.0
- Schools +2.7/10.0
- Rent growth +2.5/5.0
- Condition / age +2.5/5.0
- Appreciation +0.0/10.0
$175,000
🖨 Deal sheet (PDF) 📄 Offer letter ✓ Due diligence
Listing remarks
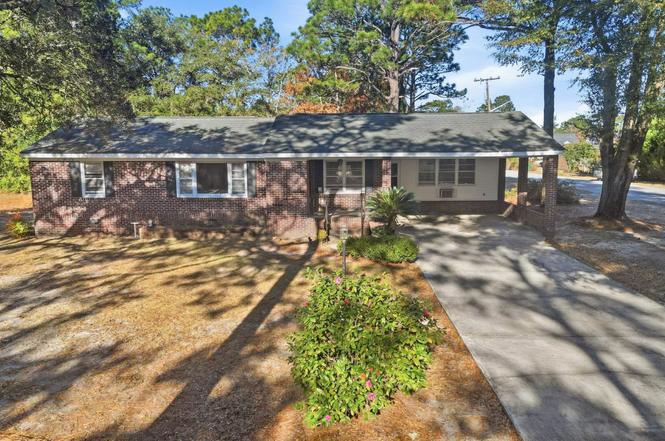
2704 Rion Street is a single-level home with strong upside, located in Maryville on a large lot with no HOA. The property offers 3 bedrooms, 1 full bath, and 1 half bath, with 1,468 heated square feet and a functional layout. A garage and separate carport provide practical parking and storage, adding everyday utility and resale value. The home presents a clear remodel or value-add opportunity, well suited for investors or buyers looking to renovate and customize. The location supports long-term demand, with close proximity to a boat landing and water access, nearby dining and shopping, a county airport, and easy access to the main route to Charleston. The combination of lot size, lack of re
Key facts
- Large lot
- Remodel opportunity
- Functional layout
Tags
Property features AI
Finance
- Other: Property is for sale; Resale condition
- HOA & community: Association fee billed monthly
Exterior
- Parking: Attached garage (1-car); Additional parking for a total of 4 spaces
- Utilities: Electricity available; Public water; Sewer available
- Home design: Single-story home; Brick veneer exterior; Crawlspace foundation; Zoned residential; Corner city lot, rectangular shape
- Construction: Brick veneer construction; Crawlspace foundation
- Exterior features: Front porch; Screened porch; Porch; Exterior storage
Interior
- Kitchen: Range; Range hood; Dishwasher; Disposal; Refrigerator; Kitchen exhaust fan
- Bedrooms: Primary and additional bedrooms on the main level; Bedroom 1 approximately 13 x 14 (main level); Bedroom 2 approximately 10.8 x 11 (main level); Additional bedroom/other spaces (one listed as bedroom on main level)
- Flooring: Wood flooring
- Bathrooms: 1 full bathroom; 1 half bathroom
- Heating & cooling: Central heating (electric); Central air conditioning
- Interior features: Ceiling fans throughout; Main level primary bedroom; Tub/shower; Unfurnished
- Laundry & utility: Washer hookup
Neighborhood map
What this means for you Summary
Snapshot
- This is a 3-bed/1.0-bath single-family listed at $175k.
Deal economics
- At list price, monthly cash flow is $241 ($3k/yr) — positive.
- The deal already cash-flows at list — no discount required.
- To meet the 1% rule (rent ≥ 1% of price), the offer needs to be $164k (6.5% below list).
- Recommended offer: $154k (12.0% below list) — sets the bar for market timing.
- Cap rate 7.9% vs local median 4.7% in Georgetown — top-decile yield for the area; either an underpriced asset or a hidden risk that comps aren't pricing in. Stress-test before assuming the spread holds.
Location & tenants
- Location reads 65/100 on livability (#141 in SC) — a middle-class / working-renter tenant base. Strengths: cost of living A+, housing A+, health & safety A+; Watch: amenities D, crime F, commute F.
- Georgetown 01 (town): math 26% / reading 38% proficiency, ranked #51 of 80 in SC (top 64%) — families likely to look elsewhere, expect single-tenant / working-renter base with shorter leases.
- Zoned schools: Maryville Elementary (math 27% / reading 22%, grade F, #452 of 597 statewide, top 78%, 445 students, 100% FRL); Georgetown Middle (math 15% / reading 23%, grade F, #185 of 229 statewide, top 81%, 712 students, 100% FRL); Georgetown High (math 27% / reading 75%, grade D+, #148 of 196 statewide, top 76%, 940 students, 77% FRL) — zoned schools average 92% FRL vs 59% district-wide (33 pts higher); higher-poverty schools than district average — tighter screening recommended.
- Market conditions: 412 active listings in the ZIP; 2 comparable units currently listed for rent nearby; 323 units permitted in Georgetown County in 2024 (0 in 5+ unit buildings).
Forward outlook
- Local home prices are declining (-3.0%/yr); year-one equity from $1k of loan paydown is wiped out by about $5k of value loss. Plan a longer hold.
Negotiation context
- It's been on market 165 days — a 12% lower offer ($154k) is reasonable based on typical stale-listing flexibility.
- 5 sale attempts; this cycle's ask has dropped $40k (19%) from the opening price — seller is motivated, your offer sets the floor, not the list.
Risks & watch-outs
- Watch-outs: built in 1959 — expect roof / HVAC / electrical / plumbing capex.
- Climate carrying-cost: severe wind risk, 99% chance of damaging wind over 30y; moderate wildfire risk; extreme-heat days projected 7→17/yr by 2055 (HVAC capex compounding) — expect insurance premiums to compound above CPI over the hold.
Questions for the listing agent
- It's been on market 165 days. Have you received any prior offers? Is the seller open to a 12% concession, seller financing, or rate buy-down credit?
- Built in 1959 — when were the roof, HVAC, electrical panel, plumbing, and water heater last replaced?
- Why hasn't it sold? Are there any deal-killer items the seller is aware of (foundation, flood, title, zoning, code violations)?
- Is there a deadline driving the sale (1031 exchange, divorce, estate, relocation)? That informs how much negotiation room exists.
- Schools are F-rated, which usually means shorter tenancies and higher turnover. Who's the typical renter profile here, and what's been the actual vacancy rate?
- Crime grade is F in this area — have there been break-ins, vandalism, or insurance claims at this property in the last 3 years? What carrier currently insures it and at what premium?
- What's the average days-on-market for RENTAL listings here right now (not sales)? A rising rental-DOM trend means longer vacancies and softer asking-rent achievability than the comps imply.
- What's the recent tenant-quality profile in this submarket — average credit score on applications, eviction rate, late-payment / NSF rate, and stable-employment percentage? A property-management company in the area should have these aggregated.
- How much new for-sale + rental construction is in the pipeline within 1–3 miles? Heavy new supply typically softens prices + rents 12–24 months out; constrained supply supports both.
Investment metrics
- 1% rule
- 0.93% ✗
- Cap rate
- 7.95%
- Cash-on-cash
- 5.90%
- DSCR
- 1.26
- GRM
- 8.9
CMA / ARV
- ARV (on-the-fly)
- $293,600
- Comps found
- 12
Show comp detail 12 sales within ~0.75 mi
| Address | Dist | Beds/Ba | Sqft | Sold | Price | $/sf | Match |
|---|---|---|---|---|---|---|---|
| 1029 St. Martin St | 0.61mi | 3/2.0 | 1,478 (+1%) | 5mo | $295,000 | $200 | 62 |
| 1009 St. Martin St | 0.68mi | 3/2.0 | 1,475 (+0%) | 3mo | $291,000 | $197 | 61 |
| 425 Grain Field Dr | 0.40mi | 3/2.0 | 1,616 (+10%) | 3mo | $356,250 | $220 | 58 |
| 3003 Waterfall Way | 0.62mi | 4/2.0 (+1) | 1,500 (+2%) | 3mo | $296,000 | $197 | 56 |
| 1047 St. Martin St | 0.51mi | 3/2.0 | 1,618 (+10%) | 1mo | $323,840 | $200 | 54 |
| 428 Maryville Daisy St | 0.50mi | 3/2.0 | 1,330 (-9%) | 4mo | $274,000 | $206 | 53 |
| 705 Fogel St | 0.48mi | 3/1.0 | 1,258 (-14%) | 2mo | $207,500 | $165 | 52 |
| 1025 St. Martin St | 0.63mi | 3/2.0 | 1,618 (+10%) | 1mo | $325,397 | $201 | 48 |
| 2313 Lot B Laural Oak Plan Withers St | 0.59mi | 3/2.0 | 1,595 (+9%) | 8mo | $335,000 | $210 | 47 |
| 1023 St. Martin St | 0.64mi | 3/2.0 | 1,618 (+10%) | 2mo | $308,000 | $190 | 47 |
| 2315 Lot C Abaco Plan Withers St | 0.57mi | 3/2.0 | 1,660 (+13%) | 2mo | $324,990 | $196 | 46 |
| 1027 St. Martin St | 0.62mi | 3/2.0 | 1,249 (-15%) | 2mo | $278,990 | $223 | 40 |
Match score weights: distance 35% · size 25% · config 20% · recency 20%. Top-matched comps best support the ARV.
Projected returns pro-forma
-3.0% appreciation · 3.0% rent growth · sell at horizon
- IRR
- -7.2%
- Equity multiple
- 0.73×
- Total profit
- $-13,080
- Equity at exit
- $26,093
- IRR
- 2.3%
- Equity multiple
- 1.16×
- Total profit
- $8,083
- Equity at exit
- $15,131
Cash invested: $49,000 (down + closing). Projections, not guarantees.
Landlord ↔ Tenant lean methodology
- Overall (STATE)
- 90 Strongly Landlord-Friendly
- State South Carolina
- 90 Strongly Landlord-Friendly · R+6
- County
- — inherits STATE
- City
- — inherits STATE
ZIP-level market 29440
- Home prices YoY
- -34.9%
- Active inventory
- 412
- Price-to-rent
- 8.9×
Monthly cashflow live
- Estimated rent
- $1,636 medium interval (Pro) →
- Mortgage (P&I)
- −$918
- Tax from tax record
- −$61 /mo · $730/yr
- Insurance
- −$73
- HOA
- −$0
- Vacancy / Maint / Mgmt
- −$344
- Net cashflow
- $241
Break-even live
Sensitivity live
| Price | -10% $340 | -5% $291 | +0% $241 | +5% $191 | +10% $142 |
|---|---|---|---|---|---|
| Rent | -10% $112 | -5% $176 | +0% $241 | +5% $306 | +10% $370 |
| Rate | -1.0pp $329 | -0.5pp $286 | base $241 | +0.5pp $196 | +1.0pp $150 |
UW: 25.0% down · 7.5% · 30yr · 1.5% tax · 5.0% vac · 8.0% maint · 8.0% mgmt
Financing live
Cash to close
- Down payment
- $43,750
- Closing costs
- $5,250
- Reserves months
- —
- Total cash needed
- —
Loan-product check · same deal, 3 products live
Conventional
25% down · 7.5% · 30yr
- Down + closing
- —
- Monthly P&I
- —
- Monthly cashflow
- —
- DSCR
- —
- Eligible?
- —
Personal DTI + credit; lowest rate.
DSCR
20% down · 8.5% · 30yr
- Down + closing
- —
- Monthly P&I
- —
- Monthly cashflow
- —
- DSCR
- —
- Eligible?
- —
No personal income docs; deal must DSCR.
Hard money
10% down · 12.0% · 12mo
- Down + closing
- —
- Monthly P&I
- —
- Monthly cashflow
- —
- DSCR
- —
- Eligible?
- —
Short-term bridge; refi at stabilization.
Rent comps 2 comps
| Address | Beds | Baths | Sqft | Rent | $/sqft | DOM | Units | Dist |
|---|---|---|---|---|---|---|---|---|
| 821 Cedar St Georgetown, SC | 3.0 | 2.0 | 1176 | $1,800 | $1.53 | 25d | 1 | 0.20mi |
| 2307 S Fraser St Georgetown, SC | 2.0 | 2.0 | 900 | $1,000 | $1.11 | 21d | 2 | 0.59mi |
Listing history 23 events
-
2026-06-22days on market $175,000 Active 165 DOM
-
2026-06-18days on market $175,000 Active 162 DOM
-
2026-06-17days on market $175,000 Active 161 DOM
-
2026-06-16days on market $175,000 Active 160 DOM
-
2026-06-15days on market $175,000 Active 159 DOM
-
2026-06-14pricestatusdays on market $175,000 Active 157 DOM
-
2026-06-07statusdays on market $199,500 Pending 154 DOM
-
2026-06-03days on market $199,500 Active Under Contract 152 DOM
-
2026-06-02days on market $199,500 Active Under Contract 151 DOM
-
2026-06-01days on market $199,500 Active Under Contract 150 DOM
-
2026-05-31days on market $199,500 Active Under Contract 149 DOM
-
2026-05-30days on market $199,500 Active Under Contract 148 DOM
-
2026-05-01status Active Under Contract
-
2026-04-30historical
-
2026-04-24historical Active Under Contract
-
2026-04-14status Active
-
2026-03-13historical Active Under Contract
-
2026-02-18status Active
-
2026-02-10historical Active Under Contract
-
2026-02-02price $199,500
-
2026-01-28status Active
-
2026-01-21historical Active Under Contract
-
2026-01-01$215,000 Active
ⓘ Source: listings_history table (triggers on properties + properties_extension) + one-shot
backfill from property_details.listing_events for pre-trigger history.
Tax reassessment forecast SC · Resets to sale price
- Current annual tax
- $730 · $61/mo
- Projected year-2 tax
- $998 · $83/mo
- Expected delta
- +$267/yr (+$22/mo · 36.6%)
ⓘ Screening estimate from a state-policy table — verify with the county assessor before closing.
Climate risk First Street
- Flood 1/10 Low FEMA zone X (unshaded) · 0% chance over 30 yrs
- Wildfire 5/10 Major
- Heat 9/10 Extreme 7 d/yr ≥108°F today · 17 d/yr by 30 yrs out
- Wind 8/10 Severe 99% chance of damaging wind over 30 yrs
- Air quality 2/10 Low 0 unhealthy d/yr today · 1 by 30 yrs out
Nearby sold comps map
Loading sold comps map…
Walkable amenities ~0.75 mi
Loading nearby amenities…
Taxation est. · year 1
- Rental income
- $19,633
- − Mortgage interest
- −$9,803
- − Property taxes
- −$730
- − Insurance
- −$875
- − Repairs & maintenance
- −$1,571
- − Management
- −$1,571
- − Depreciation
- −$5,091
- Taxable loss
- −$7
- Est. tax savings @ 24.0%
- +$2
- After-tax cash flow
- $2,894/yr
For passive investors: Depreciation is non-cash, so a rental often shows a tax loss while cash-flowing — sheltering income. Rental losses are passive: they offset passive income freely, and up to $25,000/yr can offset ordinary (W-2) income if you actively participate and your MAGI is under $100k (phasing out to $0 by $150k); unused losses carry forward. On sale, claimed depreciation is recaptured at up to 25%, and gains may owe capital-gains tax (a 1031 exchange can defer both). Figures are a year-1 estimate at your 24.0% rate — not tax advice; consult a CPA.
Schools (NCES district)
- District
- Georgetown 01
- NCES district ID
- 4502280
- Math proficiency
- 26% ▼ -11.00%
- Reading proficiency
- 38% ▼ -5.00%
- Median HH income
- $43,045
- Composite
- 27.15/100
- National rank
- #7030
- State rank
- #51 of 80 in SC
Livability — Georgetown
- Score
- 65/100
- State rank
- #141
- US rank
- #13446
Category grades
Schools grade is shown separately in the Schools card above.
Census & demographics
- Census place
- Georgetown, SC
- Population (ZIP)
- 26,419
Population outlook (Georgetown County) Hauer SSP2
- Today (2025)
- 63,275 people
- By 2030
- 63,630 · +0.6%
- By 2040
- 63,130 · -0.2%
- By 2050
- 61,904 · -2.2%
- By 2075
- 59,305 · -6.3%
- By 2100
- 53,852 · -14.9%
Race, ethnicity, and origin ACS 2023
- Neighborhood character
- Majority White (52%)
- Race & ethnicity
- White 52% Black 45% Hispanic / Latino 2%
- Common ancestry
- Italian 3% Lithuanian 2% Slovak 1%
- Foreign-born
- 3% · Canada
- Languages at home
- 97% English-only · Spanish 2%
Political lean MEDSL · Georgetown
- 2024 margin
- R (+19.5) · D 39.6% · R 59.1% · Other 1.2%
- 2008→2024 swing
- -14.2pp toward R · 2008: -5.2pp · 2024: -19.5pp
- All cycles
- 2024: R+19.5 2020: R+12.7 2016: R+13.0 2012: R+7.6 2008: R+5.2
Not yet ingested
- Civics
- —
Market trends
- HPI YoY
- ▼ -111.84%
- Current HPI
- 208.6792
- Rent YoY
- —
- Metro
- —
- State GDP YoY
- ▲ 4.51%
- F500 in state
- 2
Industry mix (Fortune 500 HQ in SC)
| Industry | F500 HQs | Revenue |
|---|---|---|
| Packaging | 1 | $7B |
|
||
Price history
-7.2% since first listed11 events — show timeline
- 2026-05-01 Relisted — CCAR
- 2026-04-30 Listing Removed — CCAR
- 2026-04-24 Contingent — CCAR
- 2026-04-14 Relisted — CCAR
- 2026-03-13 Contingent — CCAR
- 2026-02-18 Relisted — CCAR
- 2026-02-10 Contingent — CCAR
- 2026-02-02 Price Changed $199,500 CCAR
- 2026-01-28 Relisted — CCAR
- 2026-01-21 Contingent — CCAR
- 2026-01-01 Listed $215,000 CCAR
Property tax history
+5.3%/yrLatest (2025): $730 · +20.0% YoY. Source: county tax records.
Cash-flow waterfall
monthlySold comps — $/sqft
last 12 mo · ≤1 miLoading sold comps…